HAL Id: insu-01322417
https://hal-insu.archives-ouvertes.fr/insu-01322417
Submitted on 19 Sep 2019
HAL is a multi-disciplinary open access
archive for the deposit and dissemination of
sci-entific research documents, whether they are
pub-lished or not. The documents may come from
teaching and research institutions in France or
abroad, or from public or private research centers.
L’archive ouverte pluridisciplinaire HAL, est
destinée au dépôt et à la diffusion de documents
scientifiques de niveau recherche, publiés ou non,
émanant des établissements d’enseignement et de
recherche français ou étrangers, des laboratoires
publics ou privés.
wavelength deformations: the Palaeocene–early Eocene
period in the Paris Basin
Justine Briais, François Guillocheau, Eric Lasseur, Cécile Robin, Jean-Jacques
Châteauneuf, Olivier Serrano
To cite this version:
Justine Briais, François Guillocheau, Eric Lasseur, Cécile Robin, Jean-Jacques Châteauneuf, et al..
Response of a low-subsiding intracratonic basin to long wavelength deformations: the Palaeocene–early
Eocene period in the Paris Basin. Solid Earth, European Geosciences Union, 2016, 7 (1), pp.205-228.
�10.5194/se-7-205-2016�. �insu-01322417�
www.solid-earth.net/7/205/2016/ doi:10.5194/se-7-205-2016
© Author(s) 2016. CC Attribution 3.0 License.
Response of a low-subsiding intracratonic basin to long
wavelength deformations: the Palaeocene–early
Eocene period in the Paris Basin
J. Briais1,2, F. Guillocheau1, E. Lasseur2, C. Robin1, J. J. Châteauneuf3, and O. Serrano2 1Géosciences-Rennes, UMR6118, Université de Rennes 1 – CNRS, 35042 Rennes CEDEX, France 2BRGM, 3 avenue Claude Guillemin, 45060 Orléans CEDEX, France
3Biostratigraphy Consultant, 8 quai du Châtelet, 45000 Orléans, France
Correspondence to: J. Briais (j.briais@brgm.fr)
Received: 20 October 2015 – Published in Solid Earth Discuss.: 7 December 2015 Revised: 20 January 2016 – Accepted: 21 January 2016 – Published: 8 February 2016
Abstract. The uppermost Cretaceous to early Palaeogene
is a period of major deformations of the western part of the Eurasian plate with prominent basin inversions starting from the Coniacian onwards. These deformations occur in a complex geodynamic setting within both the context of the Africa–Eurasia convergence and the North Atlantic opening. While Mesozoic graben inversions have been extensively studied, particularly in Eastern Europe and the North Sea, more gentle deformations that affect thicker crust areas (in-tracratonic basins and emerged lands) are not as well docu-mented.
The objective of this study is to constrain the exact tim-ing, type, and magnitude of the early Palaeogene deforma-tions affecting the intracratonic Paris Basin and to integrate them at the western European scale. Low-amplitude defor-mations are attempted through a high-resolution reconstitu-tion of its stratigraphic record based on well-dated outcrops and well-dated wells, and a high number of well-logs that are correlated using the “stacking pattern” sequence strati-graphic technique.
Two orders of sequences are identified (third and fourth order) and correlated throughout the basin. Basin geometric and palaeogeographic reconstitutions are based on sediment thickness and facies analysis. Two-dimensional accommoda-tion space measurements were taken in order to quantify the magnitude of the deformations.
Three phases of deformation were recognized.
1. An intra-Maastrichtian–pre-Thanetian (59 Ma) defor-mation, with major uplift and erosion of the
Cre-taceous strata with two sub-periods of deformation: Maastrichtian–pre-middle-Danian and Upper Danian– pre-Thanetian long-wavelength deformations. This pe-riod of major deformation is coeval with Up-per Cretaceous/pre-Danian compressive deformations linked to the Africa–Eurasia convergence in southern France and with volcanic activity from the North At-lantic to Massif Central and the Rhenish Shield during the Palaeocene.
2. An early Ypresian (55.1–54.3 Ma) medium-wavelength deformation (× 10 km), here reported to be a stress re-arrangement related to the onset of the North Atlantic opening.
3. An uppermost Ypresian (49.8 Ma) long-wavelength de-formation (× 100 km), contemporaneous with flexural compressive deformations in the Aquitaine Basin (Pyre-nean deformation), and related to the Iberia–Eurasia convergence.
1 Introduction
The Paris Basin is one of the most documented basins in the world. It has been studied since the 18th century (Guettard, 1746) and is considered as a typical example of intracra-tonic basins (Pomerol, 1989; Brunet and Le Pichon, 1982; Perrodon and Zabek, 1990). Subsidence and accommoda-tion space measurements (Brunet and Le Pichon, 1982;
Guil-subsiding domain until the Cretaceous–Palaeogene bound-ary and an uplifted emerged area related to Alpine colli-sion since the end of the Rupelian. In between, Cenozoic de-posits were deposited in a very low accommodation regime (5–15 m Ma−1), separated by large time hiatuses (Pomerol, 1989). Deformation phases of the Eurasian plate have been documented from the end of the Cretaceous to the Oligocene and are tentatively related to various phases of convergence (Ziegler, 1990, 1992) or to the Atlantic opening (Anell et al., 2009 and Doré et al., 1999). These phases vary from graben inversions in the North Sea (Ziegler, 1987a), British Isles (Isle of Wight, St George’s Channel, Western Approaches; Ziegler, 1987b), Germany, and Polish Trough to more gen-tle flexures affecting former sag basins (Cloetingh and Van Wees, 2005). The characteristics and mechanisms of the prominent inversion of Mesozoic grabens have been exten-sively studied (Ziegler, 1990; Doré et al., 1999; Lamarche et al., 2003; Anell et al., 2009); conversely, the subtle deforma-tions of thicker crust basins such as the Paris Basin and their relationship to far-field stresses are less well known.
The Palaeocene to early Eocene evolution of the Paris Basin is documented here through a detailed stratigraphical and sedimentological study (Briais, 2015).
The 3-D geometry of the late Palaeocene to early Eocene sediments of the Paris Basin is reconstructed based on se-quence stratigraphic correlations of the wells (with well-logs), calibrated in age, and facies on stratigraphic wells, available in the literature and outcrops. An absolute age model of the main surfaces is compiled based on the bios-tratigraphy, sequence stratigraphic surfaces, high-resolution oxygen isotope curves (Cramer et al., 2011), and Earth orbital solutions for long-term eccentricity (Laskar et al., 2011). A 2-D accommodation space measurement was taken to quantify the magnitude of the deformations.
The timing and type of deformation are tentatively corre-lated to the main geodynamic events that affected the Euro-pean plate during the early Cenozoic.
2 Geological setting
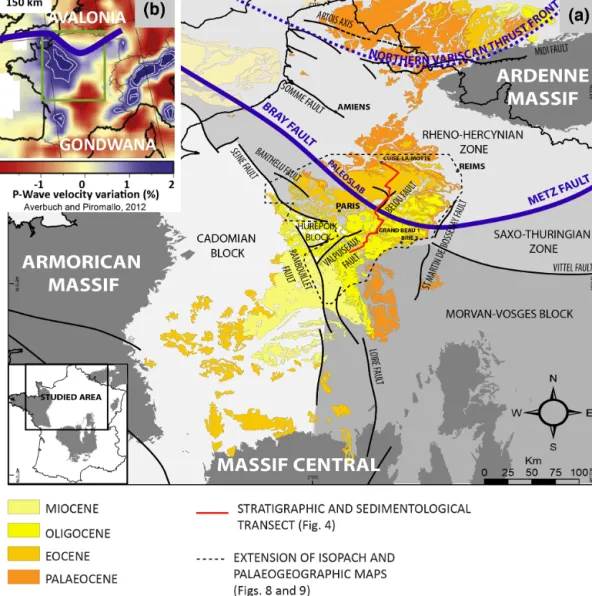
2.1 Crustal structure (Fig. 1)
The lithosphere of the Paris Basin is inherited from the Variscan mountain belt resulting from the carboniferous col-lision of the Avalonia and Gondwana plates and the closure of the RHEIC Ocean (Matte, 1986). The suture of this ocean corresponds to the Bray–Metz Fault (Autran et al., 1994; see Fig. 1a). Recent studies based on the P wave seismic tomog-raphy (Averbuch and Piromallo, 2012) have suggested the occurrence of a subducted slab beneath a part of the Bray Fault (Fig. 1b). On the Gondwana side, the pattern is much more complex with a major fault system, the Seine Fault, corresponding to a magnetic anomaly, the AMBP (Magnetic
sial (Palaeozoic rift: Autran et al., 1986; fossil slab: Averbuch and Piromallo, 2012).
The Seine, Rambouillet, and Loire faults represent the eastern limit of the Cadomian (para-autochthonous block) and the Hurepoix Block, bounded by the Seine, Valpuiseaux, and Rambouillet faults, forms a distinct block as evidenced by geophysics (Autran et al., 1994).
After the collision, the mountain belt collapsed with the growth of numerous Permian basins located along the ma-jor faults; the exact location of these basins is unknown (Mégnien and Mégnien, 1980; Mascle, 1990; Perrodon and Zabeck, 1990; Delmas et al., 2002).
2.2 Deformation history
The subsidence of the Paris Basin started during early Tri-assic times. The long-term subsidence pattern is subdi-vided into three parts: (1) Trias-Cretaceous, a subsiding domain with a mean subsidence rate close to 20 m Ma−1; the subsidence is usually considered as of thermal origin due to the Permo-Trias extension (Perrodon and Zabeck, 1990), (2) Palaeocene–early Oligocene, with low subsidence close to 10 m Ma−1, and (3) uplift since the late Oligocene (Guillocheau et al., 2000). These changes record a major plate reorganization during the uppermost Cretaceous–early Palaeocene and late Oligocene–early Miocene events. Dur-ing its subsidence history, the Paris Basin also records in-traplate deformations; the most spectacular one occurred in early Cretaceous times during the opening of the Bay of Bis-cay and the rotation of Iberia (Neo-Cimmerian and Austrian deformations; Ziegler, 1990). This deformation is recorded by an uplift of the basin borders and by a NW–SE-orientated flexure within the basin (Guillocheau et al., 2000).
Palaeocene and Eocene deformations are recorded in the Paris Basin by emersions, erosions, and hiatuses (early Da-nian, Selandian, and Upper Ypresian; Pomerol, 1989), but the sedimentary geometries and amplitude of these ver-tical movements are not well characterized. Uppermost Cretaceous–early Palaeocene is thought to be a period of im-portant intraplate deformations (Guillocheau et al., 2000) and of major vertical movements (Barbarand et al., 2013).
Several faults are active during this evolution: (1) inher-ited Variscan faults such as the Bray–Vittel Fault or (2) newly formed faults. The most efficient faults are the ones bound-ing the different Variscan units of the continental crust (Bec-caletto et al., 2011).
2.3 Sedimentary infilling
The sedimentary record of the Mesozoic period is con-trolled by tectonically induced second-order transgressive– regressive cycles bounded by unconformities correspond-ing to the intraplate deformation events mentioned above (Guillocheau, 1991; Guillocheau et al., 2000). The sediments
Figure 1. Geological characteristics of the Paris Basin. (a) Main tectonic units of the Variscan basement and present-day outcrops of the
Cenozoic sediments. (b) P wave velocity at 150 km below the Paris Basin, showing a major discontinuity below the Bray Fault (blue line), one of the sutures of the Variscan Belt (from Averbuch and Piromallo, 2012).
are mainly siliciclastic during Triassic and early Cretaceous times and carbonate marl during Jurassic and late Cretaceous (chalk) times.
The Cretaceous–Palaeogene transition is made up of three main stratigraphic units bounded by two hiatuses: (1) the Up-per Cretaceous chalk, (2) the mid-to-late Danian limestones, and (3) the Thanetian sands (Lemoine, 1911).
The low-subsiding Palaeogene period is subdivided into two units bounded by a major discontinuity during the late Ypresian. The first group (Thanetian–Ypresian) is the sub-ject of this study and is composed of siliciclastic deposition. The second one is composed of carbonates (Lutetian), sili-ciclastic sediments (early Bartonian), carbonates and evap-orites (late Bartonian to early Rupelian), followed again by siliciclastic sediments (Rupelian). The major marine
flood-ings are late Thanetian, early Lutetian, early Bartonian, and early Rupelian in age (Guillocheau et al., 2000).
3 Methods
This study is based on the correlation of wells (well-logs with a description of the cuttings and a few cores) and outcrops (Fig. S1 in the Supplement).
The well-log database consists of: (1) 213 petroleum wells (gamma-ray and few resistivity logs), (2) 50 petroleum core-drills (spontaneous polarization and resistivity), and (3) 114 seismic core-drills (gamma-ray only). Data (1) are avail-able from BEPH (“Bureau Exploration Production des Hy-drocarbures”, www.beph.net), (2) and (3) are available in the BSS (“Banque du Sous-Sol”, http://infoterre.brgm.fr).
grammes of the 1960s and 1970s (Chaignes, Montjavoult, Le Ludes, Cuise-la-Motte, Le Tillet, Mont Bernon; Paris Uni-versity/BRGM projects), mining projects (Provins, Brie 1, 2, 3, 4; Wyns and Ducreux, 1983), or BEPH fundings (Ste Colombe, “Craie 700” project; Mégnien and Hanot, 2000; Fig. S1).
Few outcrops are available. Most of them are quarries in operation.
3.1 Sequence stratigraphy: well-log correlations and cycle definitions
Here, we define transgressive–regressive stratigraphic cycles (Guillocheau, 1991) based on the evolution of the sedimen-tary environments and their stacking pattern. Three types of surfaces are defined: (1) maximum flooding surfaces (MFS – Galloway, 1989; Catuneanu et al., 2009, corresponding in open marine environments to the deepest or most distal surface along a depositional profile), (2) maximum regres-sive surfaces (MRS – Catuneanu et al., 2009, corresponding in open marine environments to the shallowest or the most proximal surface along a depositional profile), and (3) un-conformities (UN – Embry, 2009, corresponding to an ero-sion surface in continental environments or to a downward shift of the shoreline).
The 3-D reconstruction of the sedimentary geometries by well correlations at the basin scale (stacking pattern method for the shortest duration stratigraphic cycles; Van Wagoner et al., 1988, 1990; Homewood et al., 1992) is a six-step proce-dure.
1. Definition of sedimentary environments on outcrops and cores, using the classical technique of sedimentary facies analysis: successive depositional profiles were defined for time intervals bounded by major palaeogeo-graphic reorganizations.
2. Calibration of well-logs in terms of sedimentary envi-ronments: from areas where outcrops are close to the wells (less than 1 km), a characteristic well-log pattern (values and shape) was defined and so that the signature of the well-logs for the different depositional environ-ments could be identified (Fig. S5).
3. Definition of the different orders of cycles on the refer-ence boreholes: according to their duration provided by the age model, two orders were defined: third order be-tween 1 and 5 Ma (Haq et al., 1987) and fourth order for 400 and 800 Kyrs cycles imbricated within third order. 4. Correlation of the different orders of cycles from well
to well.
5. Test of the sequence stratigraphic framework and the hierarchy cycles by their 3-D geometry.
ferent orders of cycles.
Palaeographic maps at the level of the main surface (MFS) are then compiled from the various recognized sedimentary environments. Isopach maps between the major surfaces are produced from the interpolation thickness (compacted) in the wells using the kriging method with a geographic informa-tion system (ArcGis and Gocad).
3.2 Sequence stratigraphy: accommodation space measurement
The accommodation space available for sediments is the sum of the tectonic and eustatic variations (Jervey, 1988; Schlager, 1993). It can be measured (Robin et al., 1998), for a given time interval, as the decompacted thickness of the deposited sediments, corrected from the palaeo-bathymetries/palaeoaltitudes at which the sediments were deposited. This requires (1) high-resolution time lines, across the basin, referred to in absolute ages, (2) lithological and porosity data, and (3) an estimation of the palaeodepths or palaeoelevations.
Time lines calibrated in absolute ages
In a low-subsidence setting, the time resolution of the dat-ing is of primary importance to quantify the accommo-dation at high resolution. Palaeogene deposits are dated by biostratigraphy and chemostratigraphy, but only the PETM (Palaeocene–Eocene Thermal Maximum) is dated by chemostratigraphy (Quesnel et al., 2011). Biostratigraphic data are based on calcareous nannofossils (Aubry, 1983; Janin and Bignot, 1993; Bignot et al., 1994; Steurbaut, 1998), dinocysts (Wezellielacea – Chateauneuf and Gruas-Cavagnetto, 1978), benthic foraminifera (Bignot and Neu-mann, 1991), charophytes (Pomerol and Riveline, 1975), and mammals (Russel, 1964; Nel et al., 1999; Smith et al., 2014). Dinocyst data were re-evaluated within the framework of this study by one of us (J. J. Chateauneuf – see Fig. S3).
Unfortunately, as most of the sedimentary record con-sists of continental to shallow marine deposits, the bios-tratigraphic record is quite discontinuous (except for the dinocysts) with marine markers (foraminifera and calcareous nannofossils) only preserved in transgressive peaks (MFS). The second limit for the precision of the biostratigraphy is the discrepancy between the reference marine biozone and the other ones (dinocysts); large variations occur in the different charts available, e.g. Gradstein et al. (2012) and Köthe (2003, 2012). Dinocysts and wetzieliellaceae biostratigraphic-scale resolution is around 1 My, thus using both scales together im-plies that resolution can be considered as below 1 My.
As already mentioned, time lines are the sequence stratig-raphy time lines defined above (mainly MRS and MFS). Some unconformities (UN) are also used. Our age model is based on a combination of biostratigraphy, chemostratigrahy,
and cyclostratigraphy. In a given biozone, defined by bios-tratigraphy, the absolute age of MRS, MFS, and UN is fixed using inverted oxygen isotope curves (Cramer et al., 2009) recalibrated on the ICS12 chart by Gradstein et al. (2012) and the most recent orbital solutions provided by Laskar et al. (2011) as proxies for sea level variations.
Within the range of the different biozones, a maximum flooding surface (deepest facies) has to be a warm peak (chemostratigraphy) which corresponds to a proxy of de-crease of the ice volume and an inde-crease of the sea level (Cramer et al., 2011); a maximum flooding has to be a high-eccentricity period (orbital solutions); the reverse is found for the maximum regressive surface.
Estimation of decompacted thicknesses from lithology and porosity data
Lithologies were determined from well-logs, cuttings, cores, and outcrops. Decompaction of the sediments was based on: (1) the sediment porosity at the time of their deposition, and (2) the porosity–depth coefficient, both of which are directly linked to the unit lithology. Here, we use a new compilation of compaction laws (Dabrio, 1982). This compilation takes envelope surfaces into account, including the global range of porosity versus depth for four main lithologies (sandstone, clay, carbonate, and silt). Here, we only use three litholo-gies: (1) sand, (2) carbonate, and (3) clay. These envelopes can be used to define the upper and lower compaction curves that are used to calibrate the error induced by the compaction law. Late erosion of the deposits overlying the Palaeogene sediments can be considered as relatively low, thus the cur-rent depth can be used as an approximation of the maximum burial depth of the studied deposits.
Palaeodepth/palaeoelevation measurement
Palaeodepth/palaeoelevation measurements are based on the type of sedimentary environments defined both on (1) out-crops, cuttings, and cores, and (2) their well-log signatures (Fig. S5). The palaeodepth is deduced from the location of the facies compared to the fair-weather wave base (−5 to −30 m, Howard and Reineck, 1981). By comparison with present-day environments, coastal plain environments are as-sumed to be few metres above mean sea level. The palaeoele-vation is estimated defining topographic trends deduced from the palaeogeography during earlier stages of deposition.
In the case of erosion, eroded thicknesses are estimated using extrapolation of preserved thicknesses in parts of the basin and considering a coherent trend of thickness variations using of underlying series. Eroded thicknesses are estimated from internal sedimentary geometries.
Error calculation
Different tests were performed in order to quantify the un-certainties on the accommodation values.
1. High-resolution time lines: possible miscorrelations were minimized by multiple inter-well correlations (Fig. S1); isopachs do not show any error.
2. Decompacted lithologies: in most of the correlated well logs, only gamma rays were measured. Estimations of the lithologies are based on descriptions of the well cut-tings and the proportion of clay is estimated from the gamma-ray measurement; possible errors are reduced by tests on the various compaction laws.
3. Palaeodepth/palaeoelevation: several scenarios were tested and are presented in Sect. 4.3.
4 Results and interpretation 4.1 Depositional model
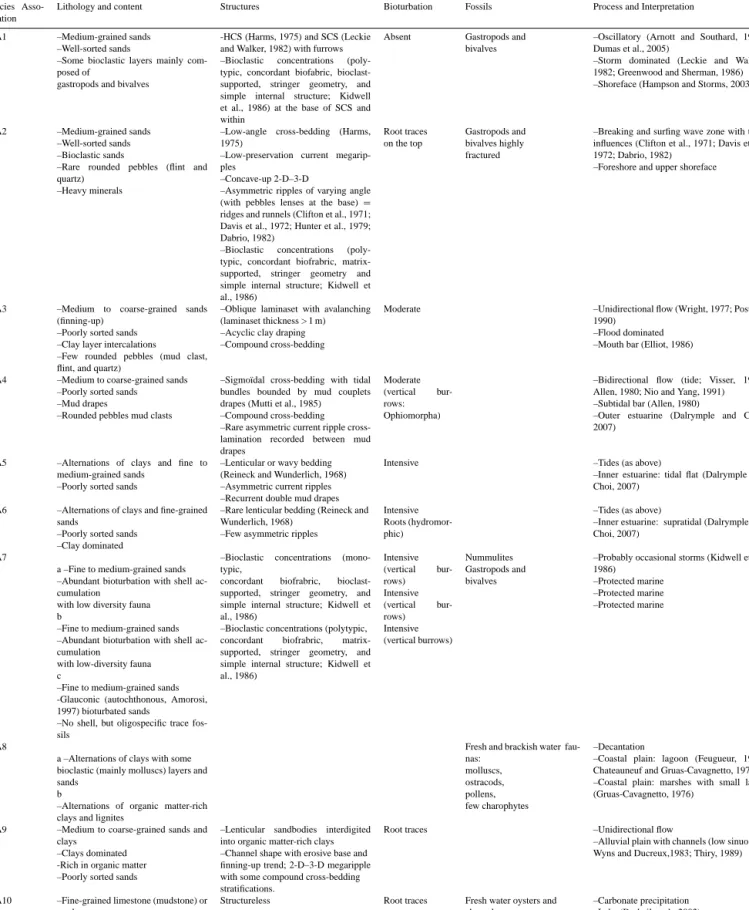
Ten sedimentary facies associations are identified here (see Table 1 and the images in Fig. S4). They are characteristic of shallow marine, large embayment (protected marine), coastal plain (marshes), and continental (lake and channel rivers) en-vironments.
Wave-dominated coastal deposits
FA1 and FA2 are characterized by homolithic well-sorted siliciclastic sands with HCS (Hummock Cross Stratification), SCS (Swaley Cross Stratification), and numerous recurrent scours (furrows). These sedimentary structures are encoun-tered in wave-dominated coastal environments (shoreface to inner storm ramp; Greenwood and Sherman, 1986; Hamp-son and Storms, 2003) deposited above the fair-weather wave base (Harms, 1975; Leckie and Walker, 1982; Walker and Plint 1992; Reading and Collinson, 1996; FA1).
Some beach deposits exist (FA2), made up of coarse-grained sands with low-angle cross-bedding (Harms, 1975) overlying concave-up 2-D and 3-D megaripples, characteris-tic of ridges and runnels (Clifton et al., 1971; Davis et al., 1972; Hunter et al., 1979; Dabrio, 1982) at the transition be-tween the foreshore and shoreface.
Flood-dominated coastal deposits
FA3 are characterized by compound cross-bedding (Harms, 1975), migrating toward the open sea. These compound bed-sets, with graded oblique laminabed-sets, acyclic clay deposits between the laminasets, and a unidirectional palaeocurrent (Wright, 1977; Postma, 1990) pattern (no tidal deposit crite-ria such as reverse current or tidal bundles), are characteristic of mouth bars (Elliot, 1986).
Tide-dominated coastal deposits
FA4, 5, and 6 contain classical sigmoidal cross-bedding (Allen, 1980), characteristic of tidal deposits (Allen, 1980,
Table 1. Facies description and interpretation. Facies
Asso-ciation
Lithology and content Structures Bioturbation Fossils Process and Interpretation
FA1 –Medium-grained sands –Well-sorted sands
–Some bioclastic layers mainly com-posed of
gastropods and bivalves
-HCS (Harms, 1975) and SCS (Leckie and Walker, 1982) with furrows –Bioclastic concentrations (poly-typic, concordant biofabric, bioclast-supported, stringer geometry, and simple internal structure; Kidwell et al., 1986) at the base of SCS and within
Absent Gastropods and bivalves
–Oscillatory (Arnott and Southard, 1990; Dumas et al., 2005)
–Storm dominated (Leckie and Walker, 1982; Greenwood and Sherman, 1986) –Shoreface (Hampson and Storms, 2003)
FA2 –Medium-grained sands –Well-sorted sands –Bioclastic sands
–Rare rounded pebbles (flint and quartz)
–Heavy minerals
–Low-angle cross-bedding (Harms, 1975)
–Low-preservation current megarip-ples
–Concave-up 2-D–3-D
–Asymmetric ripples of varying angle (with pebbles lenses at the base) = ridges and runnels (Clifton et al., 1971; Davis et al., 1972; Hunter et al., 1979; Dabrio, 1982)
–Bioclastic concentrations (poly-typic, concordant biofrabric, matrix-supported, stringer geometry and simple internal structure; Kidwell et al., 1986) Root traces on the top Gastropods and bivalves highly fractured
–Breaking and surfing wave zone with tidal influences (Clifton et al., 1971; Davis et al., 1972; Dabrio, 1982)
–Foreshore and upper shoreface
FA3 –Medium to coarse-grained sands (finning-up)
–Poorly sorted sands –Clay layer intercalations –Few rounded pebbles (mud clast, flint, and quartz)
–Oblique laminaset with avalanching (laminaset thickness > 1 m) –Acyclic clay draping –Compound cross-bedding
Moderate –Unidirectional flow (Wright, 1977; Postma, 1990)
–Flood dominated –Mouth bar (Elliot, 1986)
FA4 –Medium to coarse-grained sands –Poorly sorted sands –Mud drapes
–Rounded pebbles mud clasts
–Sigmoïdal cross-bedding with tidal bundles bounded by mud couplets drapes (Mutti et al., 1985) –Compound cross-bedding –Rare asymmetric current ripple cross-lamination recorded between mud drapes
Moderate (vertical bur-rows: Ophiomorpha)
–Bidirectional flow (tide; Visser, 1980; Allen, 1980; Nio and Yang, 1991) –Subtidal bar (Allen, 1980)
–Outer estuarine (Dalrymple and Choi, 2007)
FA5 –Alternations of clays and fine to medium-grained sands
–Poorly sorted sands
–Lenticular or wavy bedding (Reineck and Wunderlich, 1968) –Asymmetric current ripples –Recurrent double mud drapes
Intensive –Tides (as above)
–Inner estuarine: tidal flat (Dalrymple and Choi, 2007)
FA6 –Alternations of clays and fine-grained sands
–Poorly sorted sands –Clay dominated
–Rare lenticular bedding (Reineck and Wunderlich, 1968)
–Few asymmetric ripples
Intensive Roots (hydromor-phic)
–Tides (as above)
–Inner estuarine: supratidal (Dalrymple and Choi, 2007)
FA7
a –Fine to medium-grained sands –Abundant bioturbation with shell ac-cumulation
with low diversity fauna b
–Fine to medium-grained sands –Abundant bioturbation with shell ac-cumulation
with low-diversity fauna c
–Fine to medium-grained sands -Glauconic (autochthonous, Amorosi, 1997) bioturbated sands
–No shell, but oligospecific trace fos-sils
–Bioclastic concentrations (mono-typic,
concordant biofrabric, bioclast-supported, stringer geometry, and simple internal structure; Kidwell et al., 1986)
–Bioclastic concentrations (polytypic, concordant biofrabric, matrix-supported, stringer geometry, and simple internal structure; Kidwell et al., 1986) Intensive (vertical bur-rows) Intensive (vertical bur-rows) Intensive (vertical burrows) Nummulites Gastropods and bivalves
–Probably occasional storms (Kidwell et al., 1986)
–Protected marine –Protected marine –Protected marine
FA8
a –Alternations of clays with some bioclastic (mainly molluscs) layers and sands
b
–Alternations of organic matter-rich clays and lignites
Fresh and brackish water fau-nas: molluscs, ostracods, pollens, few charophytes –Decantation
–Coastal plain: lagoon (Feugueur, 1963; Chateauneuf and Gruas-Cavagnetto, 1978) –Coastal plain: marshes with small lakes (Gruas-Cavagnetto, 1976)
FA9 –Medium to coarse-grained sands and clays
–Clays dominated -Rich in organic matter –Poorly sorted sands
–Lenticular sandbodies interdigited into organic matter-rich clays –Channel shape with erosive base and finning-up trend; 2-D–3-D megaripple with some compound cross-bedding stratifications.
Root traces –Unidirectional flow
–Alluvial plain with channels (low sinuosity; Wyns and Ducreux,1983; Thiry, 1989)
FA10 –Fine-grained limestone (mudstone) or marls
Structureless Root traces Fresh water oysters and charophytes
–Carbonate precipitation –Lake (Dutheil et al., 2002)
1982; Allen and Homewood, 1984; Visser, 1980; Nio and Yang, 1991; Dalrymple and Choi, 2007). Three different types of tidal environments were recognized: (1) subaqueous tidal bars (outer estuary or bay – FA4) characterized by com-pound cross-bedding with sigmoidal cross-bedding and tidal bundles (Allen, 1980), (2) tidal flats with small-scale current lamination and mud drapes (FA5), and (3) supratidal clay-dominated deposits with few asymmetric ripples (sands) and some roots occurrences (FA6).
Protected marine environments
Large embayments (FA7) are characterized by extremely bioturbated glauconitic sands with poorly preserved sedi-mentary structures. Wave deposits are missing, thereby sug-gesting a large embayment protected from the wave energy. This interpretation is supported by a quite low shell biodiver-sity (oligospecific), indicating a stressed environment (e.g. salinity decrease or/and depleted oxygenation). The three dif-ferent facies sub-associations (FA7a to c) record difdif-ferent de-grees of confinement, from the outer (FA7a) to inner (FA7c) bays. FA7a shows no evidence of wave activity but a normal shell biodiversity, whereas FA7c shows also no wave activity, but no shells or oligo- (to mono-) specific trace fossils.
Coastal plain environments
FA8 are characterized by clays, sands and lignites with (1) brackish (e.g. Cyrena cuneiformis) to (2) fresh wa-ter (Viviparus suessoniensis) faunas (Feugueur, 1963; Chateauneuf and Gruas-Cavagnetto, 1978). Brackish clays and sands are more characteristic of lagoon deposits (FA8a) while fresh water organic-rich clays and lignites with inter-calated soils (mangroves: Gruas-Cavagnetto, 1976) are more characteristic of marshes with small lakes (FA8b).
Alluvial plain environments
FA9 are characterized by (1) silty clays with root traces and no evidence of marine to brackish shells and trace fossils in-terpreted as floodplain, and (2) lenticular sand bodies inter-digited into organic matter-rich clays interpreted as fluvial channels (Wyns and Ducreux, 1983; Thiry, 1989).
Lacustrine environments
FA10 are characterized by more or less clayey fine-grained limestones (mudstones texture) with charophytes and fresh water oysters and gastropods (Feugueur, 1963; Pomerol et al., 1977; Wyns and Ducreux, 1983; Riveline, 1984; Dutheil et al., 2002). Some calcretes at the top of lacustrine lime-stones and karst were described (Thiry, 1981; Aubry et al., 2005).
4.2 Depositional cycle and facies distribution along a S–N transect (Melun–Soissons): definition of the stratigraphic cycles and isopach units
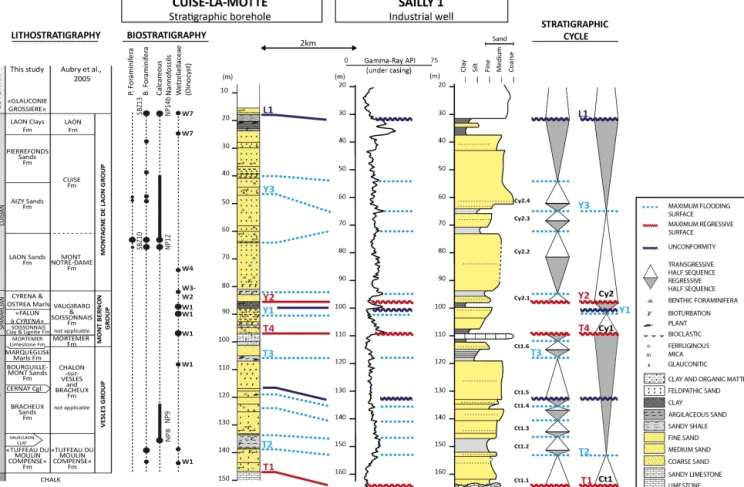
The existing Cenozoic lithostratigraphic nomenclature of the Paris Basin is quite complex and confusing, resulting from roughly two centuries of geological studies in a low subsid-ing basin with numerous facies variations through time and space at the marine–continental domain transition. Aubry et al. (2005) have proposed a simplified lithostratigraphy with the creation of new formations (Fig. 2). This new lithostratig-raphy is defined on the border (onlapping parts) of the sub-siding domain and involves unfortunately large lacunae. In the present work, we define a homogenized lithostratigraphy that takes both the basin and border sedimentary packages into account based on our correlations (Figs. 2, S2, and 4).
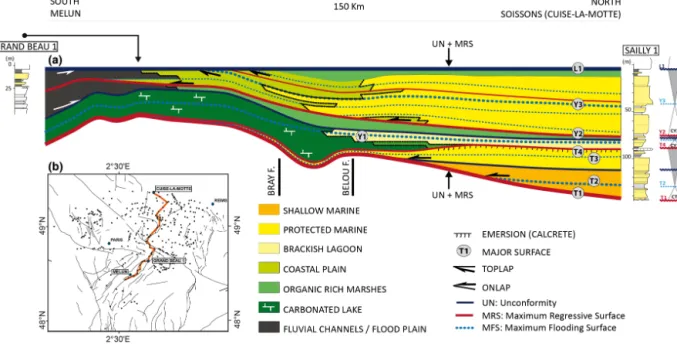
A S–N transect extending from Melun to Soissons (Cuise-la-Motte) summarizes the main geometrical features of the Palaeocene–early Eocene period in the Paris Basin (Figs. 4 and S6). It is based on the correlations of 31 wells using the stacking pattern technique (Sect. 3.1). The stratigraphy of the wells at each extremity of the section (the most marine one to the north, Sailly 1, and a more continental one to the south, Grand Beau 1) was defined and dated by correlation with two stratigraphic wells (Cuise-la-Motte and Brie 3; see Figs. 2 and S2). The well-logs facies used and their interpretation are summarized in Fig. S5.
The Thanetian third-order cycle (Ct, surfaces T1 to T4) is characterized by sediments onlapping southward over the late Campanian chalk. The uppermost Cretaceous (Up-per Campanian and Maastrichtian), Danian, and Selandian are missing here (hiatus of 17 Ma between 76 and 59 Ma; Pomerol, 1989).
The bounding surfaces of the cycle are defined as follows (Fig. 2):
– Base MRS (T1): base of the “Tuffeau de Moulin
Compensé” Fm (shallow marine glauconitic calcareous sands), probably dated NP7 (Steurbaut, 1998; see dis-cussion below).
– MFS (T2): top of the “Tuffeau de Moulin Compensé”
Fm (nannofossil-rich top layer, Janin and Bignot, 1993 – FA1); the age is debated: NP6 for Janin and Big-not (1993) and NP7 for Steurbaut (1998). We prefer to use the work of Steurbaut, because it is more integrated at European scale.
– Unconformity: a sharp transition between the
wave-dominated shore deposits (FA1) of the Bracheux Sands Fm (HST) and the fluvio-estuarine (tidal dominated, Dutheil et al., 2002 – FA3 to FA5) Bourguillemont Sands Fm dated by Steurbaut (1998) around the NP8– NP9 transition. This unconformity is the time equivalent of the Cernay conglomerate Fm (Laurain and Meyer, 1986).
Figure 2. Stratigraphy and sedimentology of the most marine Palaeocene–Lower Eocene sediments of the Paris Basin: the Cuise-la-Motte
stratigraphic borehole (Bolin et al., 1982) and the Sailly 1 well. The sequence stratigraphic interpretation is based on both the environmental changes along the Cuise-la-Motte borehole (palaeoecology and sedimentology) and on well-log correlations (see Fig. 4).
– Top MRS (T4): top of the Mortemer Limestones Fm
(la-custrine deposits topped by calcrete – FA10) dated by charophytes (long-lasting P. discermas zone in the late Thanetian to early Ypresian).
Six fourth-order cycles are defined: 0.5 in the transgressive trend and 5.5 in the regressive trend. The regressive trend is punctuated after the unconformity (above the Bourguille-mont Sands Fm) by two marine floodings characterized by: (1) protected marine to brackish clays (Marquéglise Fm – T3 marker for the accommodation space measurement), and (2) brackish clays of the Sinceny Fm (Pomerol et al., 1977), just below the Mortemer Limestones Fm. T3 is a major MFS within this regressive trend and could define a cycle of inter-mediate order within this dominant trend.
The paradox of this cycle is that the MFS T2 time line, corresponding to the deepest sediments, does not correspond to the maximum flooding of the marine facies over the con-tinental domain which occurs at the time of a minor MFS T3 (Fig. 4).
This is explained by a tectonic control on the expression of the Thanetian sedimentation. The evolution of the
flex-ure (mainly its relaxation) produces a change in the degree of inclination of the depositional profile, which is steeper af-ter deformation at the beginning of the cycle (i.e during T2) and flatter at the end of the cycle (during T3). Therefore, even if the sea level is higher during T2, transgression on a steeper surface leads to a less important extension of the marine flooding (Briais et al., 2016).
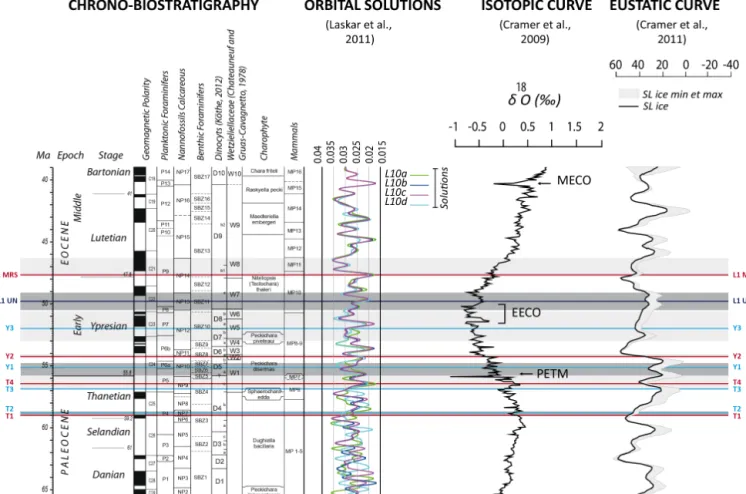
The age model (Fig. 3 and Table 2) for the Thanetian cy-cle is mainly based on the chemostratigraphy (δ18O curve of Cramer et al., 2009), as the orbital solutions are unstable for ages older than 50 Myrs (Laskar et al., 2011; Fig. 3). The biostratigraphic range of the MFS T2 (major) and T3 (minor) fit with two warming events at 58.8 (T2) and 56.9 Ma (T3). The top MRS T4, located before the PETM (see below) cor-responds to the cooler event of the end of the Thanetian at 56.4 Ma. The base MRS T1 is only constrained by the range of the short biozone NP7 and was defined at 59 Ma (base of biozone NP7).
The Ypresian 1 (Cy1, T4 to Y2) third-order cycle is mainly made up of bays, marshes, and lakes – i.e. environments close to their base level.
Figure 3. Age model for the Palaeocene–Lower Eocene of the Paris Basin based on re-evaluated biostratigraphic data (this study) calibrated
on recent bio-chronostratigraphic charts (Gradstein et al., 2012; Köthe, 2012; Châteauneuf and Gruas-Cavagnetto, 1978; revised in this study) and on the calibration of sequences on both the orbital solutions (Laskar et al., 2011) and isotopic curve (Cramer et al., 2009); see text for discussion and Table 2.
– Base MRS (T4): base of the Soissonnais Clays and
Lig-nites Fm (organic rich marshes – FA8b – to organic-rich lakes); previously dated at 56.4 Ma.
– MFS (Y1): intra “Faluns à Cyrena” Fm (brackish
environment – FA8a), dated as the dinocyst zone D6a (Chateauneuf and Gruas-Cavagnetto, 1978, revised here).
– Unconformity: between the “Faluns à Cyrena” and the
“Marnes à huîtres et Cyrènes” Fms, there is a sharp tran-sition from brackish to subaqueous fresh water environ-ment (organic rich marshes – FA8b).
– Top MRS (Y2): top of the “Marnes à huîtres et
Cyrènes” Fm (FA8), which corresponds in some places (Attichy–Soissons) to characean-rich lacustrine carbon-ates (FA10).
The transgressive trend is characterized by a well-recorded volumetric facies partitioning (Cross, 1988; Cross and Les-senger, 1998) between thin protected marine deposits (con-densation) and “highly” aggradational continental deposits,
made up of carbonate lacustrine deposits (FA10) with organic-rich marsh deposits in between. The progradational trend is a stacking of two system tracts bounded by an un-conformity. The lower system tract displays the same fa-cies succession as during the transgression. The upper sys-tem tract is composed of organic-rich marsh deposits (the Sparnacian lignites described by French stratigraphers) that pass upstream to lacustrine kaolinitic clays, reworking lat-eritic profiles (Thiry, 1981), the so-called Provins Clays Fm that also gathered the underlying marly clays (Fig. S2).
Due to poor preservation, no fourth-order cycles, which can be correlated along the section, were identified.
The negative carbon isotopic excursion of the Palaeocene– Eocene Thermal Maximum (PETM), a marker of the Palaeocene–Eocene boundary, occurred within the Soisson-nais Clays and Lignites Fm (Sinceny area in the eastern part of the basin; Quesnel et al., 2011).
The age model for the Ypresian 1 cycle (Fig. 3) is based on both the chemostratigraphy (δ18O curve of Cramer et al., 2009) and orbital solutions (Laskar et al., 2011). The bios-tratigraphic range of the MFS Y1 fits with the warming event
Figure 4. (a) South–north stratigraphic and sedimentological transect (Melun–Cuise-la-Motte) based on well-log correlations using the
stacking pattern technique (see Fig. S6) with horizontalization on the MRS of the Lutetian. (b) Location of the section.
at 55.1 Ma and is in the range of the different solutions of a high-eccentricity period described by Laskar et al. (2011). The top of MRS Y2 corresponds to both the cooler event and a low-eccentricity peak at 54.3 Ma.
The Ypresian 2 (“Cuisian”, Y2 to L1) third-order cycle is deformed at the end of its depositions and is truncated at this top. The upper limit is paraconformable in the northern part of the basin and tilted-eroded in the southern part. It corre-sponds to a strong time hiatus before the Lutetian deposition (Pomerol, 1989). The unconformity (UN L1) is thus quite difficult to date in the Paris Basin. This event is very well recorded in the Belgium Basin, the southwestern limit of the North Sea, and is dated within the NP13 biozone (Vanden-berghe et al., 2004).
– Base MRS (Y2): base of the Laon Sands Fm, it
corresponds to the top of the lacustrine facies over-lain by marine to protected marine (FA7) glauconitic micas-rich, fine-to-medium grained sands dated as from the dinocyst zone D6a (Chateauneuf and Gruas-Cavagnetto, 1978, revised here).
– MFS (Y3): intra-Aizy Sands Fm, a marine peak within
protected marine environments with marine faunas, e.g. nannofossils and large foraminifers, dated as from the nannofossil biozone NP12 (Aubry, 1983) and the large foraminifer biozone SBZ10 (Bignot and Neu-mann, 1991).
– Top UN (L1): top of the Laon Clay Fm, more or
less organic-rich clays with sands deposited in a large
coastal (to alluvial) plain, dated as NP13 by analogy with Belgium (see above).
This cycle shows similar facies (the Cuisian facies described by French stratigraphers) during both the transgressive and regressive trends. They evolve from a depositional setting in large bays, more or less protected from waves and some-times dominated by tides (large estuaries), passing laterally to coastal plains (FA8a – “Fausses glaises” Fm) and then flu-vial flood plains (FA9 – Villenauxe, Monpothier, and Breuil-let Sandstones Fms). The time line Y3 corresponds to the major marine flooding of the continental domain followed by the progradation of the coastal plain deposits (Fig. 4).
Four higher-order cycles were defined (Cy2.1 to Cy2.4). The age model for the Ypresian 2 cycle (Fig. 3) is based on both the chemostratigraphy and orbital solutions. The bios-tratigraphic range (NP12) of the MFS Y3 fits with the warm-ing event at 52 Ma and is in the range of the different so-lutions of a high-eccentricity period described by Laskar et al. (2011). The top MRS L1, in the sense of the first flood-ing, is dated NP14 (Aubry, 1983) and corresponds to both the cooler event and a low-eccentricity peak at 47.8 Ma.
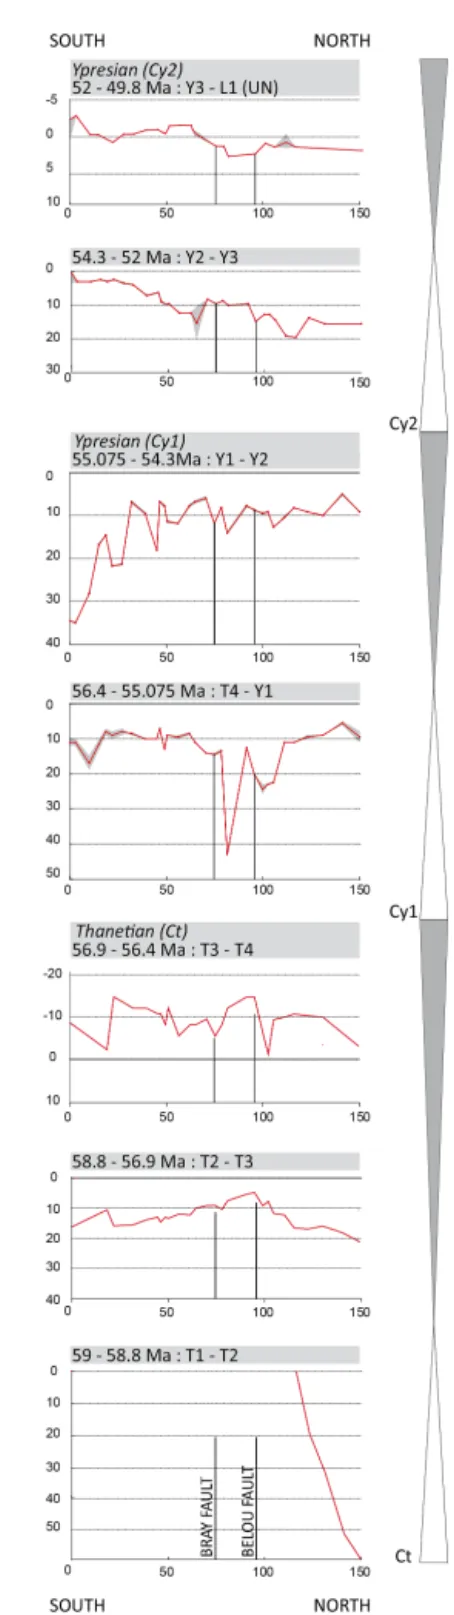
Accommodation space measurement along the S–N transect (Melun–Soissons transect)
The accommodation space was measured on eight time lines (T1 to L1), defined above, and 31 wells that compose the S–N transect, crossing two faults: the major Bray Fault and the Belou Fault (Fig. 5). The data set is available in Figs. S1 and S7.
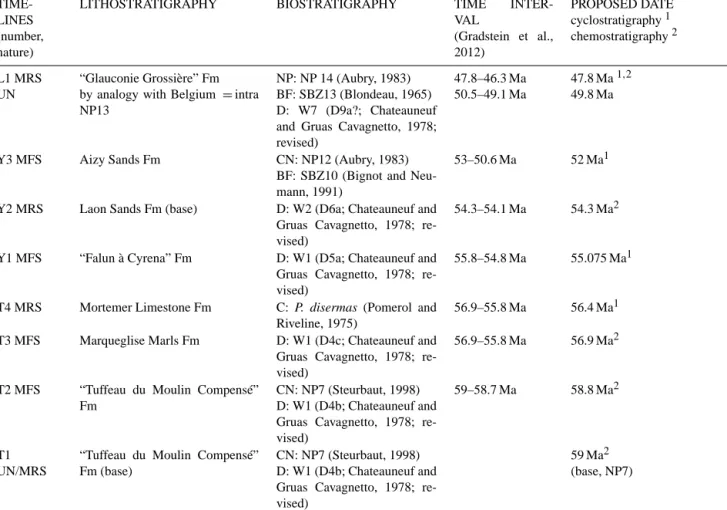
Table 2. Age model for the bounding cycles of the stratigraphic surfaces (MFS, MRS, and Unconformities).
TIME-LINES (number, nature)
LITHOSTRATIGRAPHY BIOSTRATIGRAPHY TIME INTER-VAL (Gradstein et al., 2012) PROPOSED DATE cyclostratigraphy1 chemostratigraphy2 L1 MRS UN “Glauconie Grossière” Fm by analogy with Belgium = intra NP13
NP: NP 14 (Aubry, 1983) BF: SBZ13 (Blondeau, 1965) D: W7 (D9a?; Chateauneuf and Gruas Cavagnetto, 1978; revised)
47.8–46.3 Ma 50.5–49.1 Ma
47.8 Ma1,2 49.8 Ma
Y3 MFS Aizy Sands Fm CN: NP12 (Aubry, 1983) BF: SBZ10 (Bignot and Neu-mann, 1991)
53–50.6 Ma 52 Ma1
Y2 MRS Laon Sands Fm (base) D: W2 (D6a; Chateauneuf and Gruas Cavagnetto, 1978; re-vised)
54.3–54.1 Ma 54.3 Ma2
Y1 MFS “Falun à Cyrena” Fm D: W1 (D5a; Chateauneuf and Gruas Cavagnetto, 1978; re-vised)
55.8–54.8 Ma 55.075 Ma1
T4 MRS Mortemer Limestone Fm C: P. disermas (Pomerol and Riveline, 1975)
56.9–55.8 Ma 56.4 Ma1 T3 MFS Marqueglise Marls Fm D: W1 (D4c; Chateauneuf and
Gruas Cavagnetto, 1978; re-vised)
56.9–55.8 Ma 56.9 Ma2
T2 MFS “Tuffeau du Moulin Compensé” Fm
CN: NP7 (Steurbaut, 1998) D: W1 (D4b; Chateauneuf and Gruas Cavagnetto, 1978; re-vised)
59–58.7 Ma 58.8 Ma2
T1 UN/MRS
“Tuffeau du Moulin Compensé” Fm (base)
CN: NP7 (Steurbaut, 1998) D: W1 (D4b; Chateauneuf and Gruas Cavagnetto, 1978; re-vised)
59 Ma2 (base, NP7)
MFS: Maximum flooding surface; MRS: Maximum regressive surface; Un: Unconformity; CN: Calcareous Nannofossils; D: Dinocyst and Wetzeliellaceae; C: Charophyte; M: Mammals; BF: Benthic Foraminifera;1Laskar et al. (2011),2Cramer et al. (2009).
The observed facies are quite high wave-energy facies and a fair-weather wave base between −20 and −15 m is realis-tic. Thus, from the shoreline to proximal upper offshore de-posits, two palaeodepth hypotheses were tested: between 0 and −20 m and 0 and −30 m. For inner estuarine and pro-tected marine environments (more or less tidal-influenced embayments), well-log correlations show persistent electro-facies over large distances, suggesting relatively flat profiles, and have been ranked between −5 and 0 m. The coastal plain has an elevation of a few metres above mean sea level. The palaeoelevation was estimated between 0 m (at the shoreline) up to +10 m, close to the transition to more fluvial deposits. Different hypotheses (minimum and maximum) regarding the compaction and the palaeodepth are tested on the Cuise-la-Motte well (see Fig. S8). The curves for the different hy-potheses are very similar to each other. Thus, uncertainties on the palaeodepths and decompaction do not significantly influence the measured accommodations.
Two types of graphs are compiled here: the cumulated ac-commodation space (Fig. S9) and the acac-commodation space variation between each time line (Fig. 5), both of which are
found along the 31 wells of the S–N regional transect (Fig. 4), using the minimum compaction hypothesis.
The accommodation space rate varies along the transect (Fig. 5), regardless of the which time slice is analysed, sug-gesting a local (multiple of 1 km) to medium (multiple of 10 km) wavelength tectonic control. At the transect scale, the accommodation space rate varies from north to south. It is constantly higher in the north during the Thanetian while a different pattern is observed during the Ypresian Cy1 where the Bray and Belou faults control the accommodation rate distribution. During the Ypresian Cy2, the distribution is more similar to the Thanetian distribution.
The accommodation rate varies between 60 (creation) and −5 m Ma−1(removal). The highest rate (60 m Ma−1) is prob-ably unlikely. This results from poorly constrained MRS age (T1) and the maximum rate value is probably lower.
1. The Thanetian cycle (T1–T4, Ct) is characterized dur-ing its transgressive period (T1–T2) by a marine onlap, which means no creation of accommodation space in the continental area, north of the Belou Fault, and by a sharp increase of accommodation space toward the north to
Figure 5. Accommodation space rate (m Ma−1) for Palaeocene– early Eocene times along the south–north transect (Fig. 4) for each time interval. Each curve (red line) represents the accommodation space. Error bars (in grey) take different compaction rates into ac-count (see Fig. S8).
The regressive trend was split into two time intervals to better constrain the accommodation variations during this period, within which maximum onlap occurs (T3). From T2 to T3, the accommodation rate is positive and subdivided into two domains by the Bray/Belou faults. From T3 to T4, the accommodation rate is negative with variable values around −5 to −15 m Ma−1. The nega-tive accommodation period is coeval with a forced re-gression wedge in the Belgian basin (Steurbaut, 1998; Vandenberghe et al., 2004). In the Paris Basin, it is only recorded by an emersion (calcrete) at the top of Mortemer Limestones Fm. No erosion and incision is recorded in the Paris Basin, probably due to the flat pro-file.
2. Ypresian 1 cycle (T4–Y2, Cy1) is characterized by quite low values (around 10 m Ma−1), which are slightly higher during the transgressive trend (T4–Y1). The ac-commodation rate is quite homogeneous, except be-tween the Bray and Belou faults for the transgressive period where much higher values are measured (up to 45 m Ma−1). The regressive trend (Y1–Y2) of the Ypre-sian 1 cycle records a major change in the regional ac-commodation rate trend with higher values in the for-merly poorly subsiding southern part. This time interval records a unique inversion of accommodation space dis-tribution, located southward, i.e. toward the continent. High accommodation rate is recorded by high thick-ness of fluvial sediments deposited in a regressive trend thanks to a high local subsidence.
3. Ypresian 2 cycle (Y2–L1, Cy2) is more homogeneous with accommodation creation during the Y2–Y3 inter-val and maximum accommodation in the northern part (10–15 m Ma−1). During the regressive trend Y3–L1, the values are lower (around zero) and more homoge-neous. Accommodation is higher between the Bray and Belou faults.
The top Ypresian unconformity records a minimum value of approximately −5 m Ma−1of accommodation space removal
in the southern part of the transect, reflecting erosion before Lutetian sedimentation. Here, the eroded decompacted thick-nesses are estimated from preserved thickthick-nesses in the north-ern part and from sedimentary geometries (toplap) showing a truncation (Fig. 4).
Considering that transgression–regression are controlled by A/S ratio (accommodation/sediment flux), we can pro-pose from our accommodation measurement that:
– the Thanetian (T1–T4) and Ypresian 2 (Y2–L1) cycles
are clearly controlled by accommodation space varia-tions, which are positive and “higher” during the trans-gressive period and positive (low) to negative at the end of the regressive hemicycle.
– In contrast, the Ypresian 1 (T4-Y2) cycle, with low
ac-commodation variations between the transgressive and regressive hemicycles, is probably more controlled by an increase in the sedimentary flux during the induced regressive trend.
4.3 Basin-scale data
4.3.1 Major discontinuities of the uppermost Cretaceous–early Palaeocene (base of the late Campanian to the base of the Thanetian – 76 to 59 Ma)
Since the works of Bertrand (1892) and Lemoine (1911), major unconformities with a deformation and hiatuses corre-sponding to a major change in the depositional system (chalk vs. shallow marine sandstones) are well known in the Paris Basin. Paradoxically, because of its long wavelength, few studies have been carried out on this kind of deformation. In further detail, this deformation pattern is much more com-plex. This period corresponds to a major decrease in the Paris Basin subsidence that needs to be understood when dealing with Paleaogene deformations.
In details, this deformation is characterized by two time hiatuses separated by a sedimentation phase during the Da-nian. Our main concern here is to evaluate whether there is a continuity in subsidence regime from the latest Cretaceous to Thanetian sedimentation.
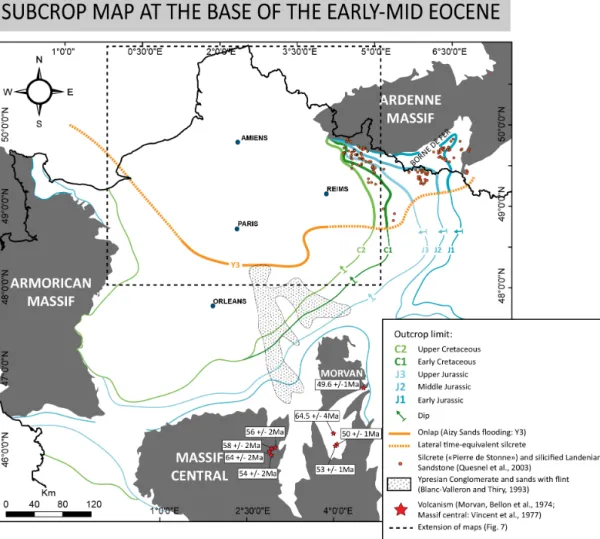
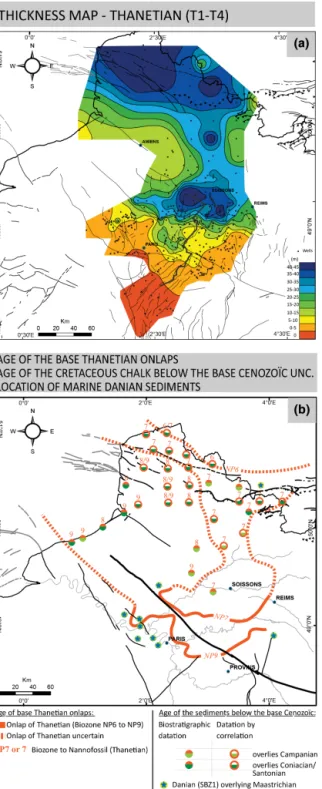
To better understand the nature and origin of the defor-mation occurring during this time interval, we compiled and compared different types of maps over an area larger than the studied area (up to Belgium): (1) a basin-scale map il-lustrating the geometrical relationships between the tabular Palaeocene to Middle Eocene deposits over the tilted late Cretaceous to Jurassic sediments (Fig. 6); (2) a subcrop map of the age of the chalk below dated occurrences (wells and mainly outcrops) of middle/late Danian and Thanetian sedi-ments (Fig. 7b), (3) a location map of the dated Danian sed-iments (Fig. 7b); these maps are compared with (4) a thick-ness map of the Thanetian cycle (Fig. 7a), and (5) an age map of the base of the Thanetian sediments, to better understand the basal onlap (Fig. 7b).
The large-scale structural map, showing the relationships between the tabular Cenozoic sediments and the underly-ing Mesozoic sedimentary rocks (Fig. 6), suggests that the present-day ring-like structure is pre-Ypresian in age. Along the Ardennes Massif, silcrete overlain by early Ypresian sed-iments (Quesnel, 2003) known as “Pierre de Stonne” (Voisin, 1988) overlap all the tilted Jurassic to Cretaceous sedimen-tary rocks.
The subcrop map (Fig. 7b) at the base of the Palaeocene indicates that (1) no sediments younger than the basal late Campanian (top of the planctonic foraminifera biozone
Con-tusotruncanna plummerae – see Fig. S3) are preserved in
the central part of the Paris Basin, while reworked
Maas-trichtian faunas and deposits (flints with foraminifers) are known at the base of the Thanetian (Blanc and Guillevin, 1974; Quesnel et al., 1996). (2) These youngest chalk are all preserved below Danian outcrops which are located in iso-lated areas as lenses (Fig. 7b). Danian sediments show the same facies: bioclastic algal limestones in shallow subaque-ous conditions (Bignot, 1993; Montenat et al., 2002). Para-doxically, Danian sediments are the most marine deposits of all the Cenozoic deposits, but are only preserved as scattered occurrences both in the outcrops and subsurface. (3) Ages of preserved chalk below Thanetian are older in the northern part and particularly on the Artois anticline (eastern prolon-gation of the Weald–Boulonnais anticline) suggesting more pronounced uplift where Thanetian sediments overlain Turo-nian chalk while CampaTuro-nian and Maastrichtian deposits are preserved in the Mons basin nearby.
The isopach map (Fig. 7a) and the map of basal ages (Fig. 7b) of the Thanetian suggests a completely different pattern: (1) a change in the subsidence distribution with two domains of sediments accumulations (along the France– Belgium borders to the north, and in the Soissons area to the south), and (2) onlaps with a similar spatial distribution as the depocentres. The Artois anticline (eastern prolongation of the Weald–Boulonnais anticline) is inverted: from an up-lifted domain before the Thanetian (Fig. 6) to a subsiding one during the Thanetian (Fig. 7a).
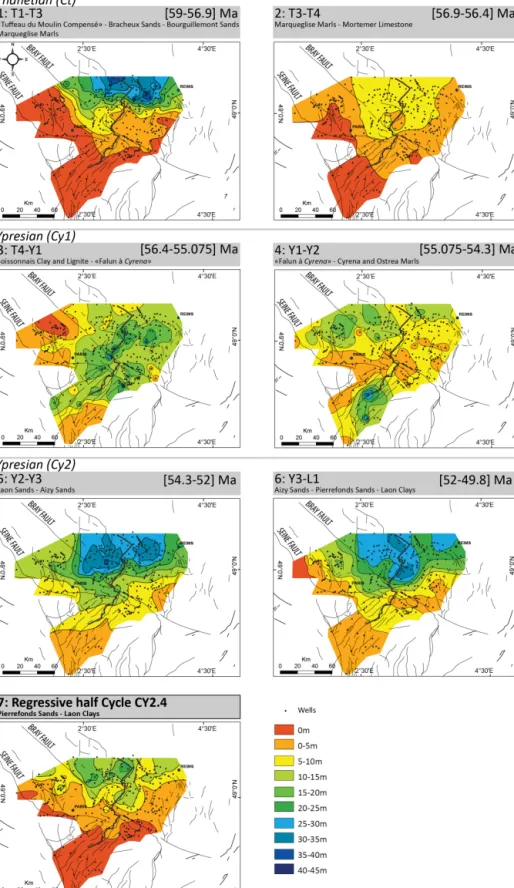
4.3.2 Late Palaeocene–early Eocene sediment thickness (isopach) maps, proxy of the accommodation space: 3-D evolution (Fig. 8)
Seven isopachs maps were drawn (Fig. 8), six for each half cycle of the three third-order cycles (Ct, Cy1, Cy2) and one for the last fourth-order cycle (Cy2.4) of the regressive trend of the second Ypresian cycle (Cy2), in order to discuss the erosion of the late Ypresian unconformity.
The Thanetian (Ct) third-order cycle has been subdivided into two time intervals (T1–T3 and T3–T4) that do not cor-respond to the hemicycles for a better understanding of the deformation. The first map shows the distribution of the first Thanetian deposits, following the pre-Thanetian deforma-tion. It reveals a flexure with a maximum thickness located to the north of the Bray Fault. The second map shows a more homogeneous subsidence pattern that accompanies the max-imum onlap.
The subsidence spatial distribution of the first Ypresian (Cy1) third-order cycle, characterized by low accommoda-tion space creaaccommoda-tion (around 10 m Ma−1), is much more
het-erogeneous, with several patchy domains with a wavelength of few tens of kilometres related to fault reactivation. The transgressive (T4–Y1) and regressive (Y1–Y2) trends are very different. From T4 to Y1, subsidence is at its maximum near the Belou and Bray Faults, especially along a NE–SW corridor situated in the prolongation of the Hurepoix Block bounded by the Seine–Valpuiseaux and Rambouillet faults
Figure 6. The uppermost Cretaceous–Palaeocene deformations of the Paris Basin. Geometrical relationship between Palaeocene–Lower
Eocene sediments and tilted Jurassic to late Cretaceous sedimentary rocks.
(Fig. 1). Conversely, during the regressive trend (Y1–Y2), the trend of the subsidence is inverted, meaning that the previous areas of maximum subsidence are now the areas of minimum subsidence. Maximum subsidence is observed south of the Hurepoix Block.
The second Ypresian (Cy2) third-order cycle displays a similar pattern as the Thanetian cycle with a large flexure and a maximum subsidence to the north in the Soissons area. Except for cycle Cy1, the Paris area between the Seine and Bray faults is subsiding, as well as in the Beauce area. The uppermost Ypresian unconformity can be documented on the isopach map of the preserved deposits of the fourth-order cy-cle Cy2.4: the major erosion (main uplift) is located south of the Bray Fault along an E–W trend.
4.3.3 Late Palaeocene–early Eocene
palaeogeographical maps: main changes in the sedimentary systems (Fig. 9)
Three facies maps (Fig. 9) were compiled along three MFS (T3, Y1, and Y3), based on the well-log electrofacies defined in Fig. S5.
The Thanetian fourth-order maximum flooding surface T3 (Marquéglise Marls Fm – 56.9 Ma) map is only made up of one facies, corresponding to protected marine deposits. This marine domain passed laterally to an area of no deposition (hiatus), probably with fluvial bypassing. This fourth-order MFS corresponds to the maximum marine flooding over the continent.
The third-order maximum flooding surface Y1 of the first Ypresian cycle (Cy1) is characterized by a large brackish do-main (“Falunà Cyrena” Fm – 55.1 Ma) passing upstream to a large carbonate lacustrine domain and then to classical flu-vial systems with flood plains to the west.
Figure 7. Upper Palaeocene sediment distribution in the Paris and
Belgium (Bruxelles) basins. (a) Isopach map of the Thanetian cy-cle (T1–T4; data from this study and geological maps of France at the 1 : 50000 scale). (b) Age of the Thanetian onlaps and Upper Cretaceous (chalk) sediments below the base of the Cenozoic and the location of the marine Danian sediments (data from geological maps of France at the 1 : 50000 scale).
The third-order maximum flooding surface Y3 of the sec-ond Ypresian cycle (Aizy Sands Fm – 52 Ma) correspsec-onds to a protected marine domain with bays and aprons confirming the wave-protected nature of this domain, except for more open marine environments along the Bray Fault. They pass southward to coastal and alluvial plains.
These three periods represent three different depositional profiles. The Thanetian (wave-dominated) and Ypresian pro-files (protected marine) are classical and extensively docu-mented in the literature. The basal Ypresian profile is more original and reflect flat profile, such as the current large coastal plain of Florida.
5 Discussion
5.1 Sea level variations during Palaeogene times and stratigraphic cycle controls
Several sea level curves have been published, which differ from one to the other: (1) Haq et al. (1987), (2) Miller et al. (2005), (3) Müller et al. (2008) (4) Cramer et al. (2011) and (5) Rowley (2013).
1. Haq’s data set was never published but, for the Ceno-zoic, it is based on European basins where long-wavelength deformation is quite significant.
2. The 1-D accommodation record filtered from the long-term subsidence, in a place (New Jersey) where the dy-namic topography due to the Pacific subduction is sig-nificant (Raymo et al., 2011), cannot be the record of eustasy.
The other types of curves – (3), (4) and (5) – agree for a mean sea level of approximately 50 m above the present-day sea level for the Palaeocene–early Eocene with: (1) few vari-ations at a timescale of few tens of millions years (× 10 Ma), and (2) an amplitude for the sea level variations of 20–30 m for a timescale of several 400 Kyrs (Cramer et al., 2011).
The only third-order cycle that could be enhanced by eu-stasy is the Sparnacian 1 (Cy1) cycle bounded by two MRS that correspond (Fig. 3) to cooler events on the isotopic curve of Cramer et al. (2009) and then to the beginning of the sea level rise after two significant peaks of sea level fall on the eustatic curve of Cramer et al. (2011). However, this view is not totally supported by the accommodation space rate (Fig. 5). The accommodation space is quite homogeneous along the S–N transect (except along the Bray–Belou Fault for the transgressive trend and southward of the Hurepoix Block for the regressive trend), with a few differences in the mean accommodation rate between the transgressive and re-gressive hemicycles that suggest sedimentary flux influence. possibly enhanced by strong climate variations.
Considering fourth-order cycles with characteristic dura-tion of 400 (or multiple of 400 Kyrs), we assume a dominant climato-eustatic control in agreement with the present-day
Figure 8. Isopach (sediment thickness) maps for each transgressive or regressive hemicycle of the three third-order cycles: Thanetian (Ct),
Ypresian 1 (Cy1), Ypresian 2 (Cy2), and for the last fourth-order cycle of the regressive trend of Cy2, illustrating the erosion during the late Ypresian unconformity.
Figure 9. Palaeogeographic (facies) maps for some maximum flooding surfaces of the Thanetian (T3) and Ypresian (Y1 and Y3).
knowledge of the importance of long-term eccentricity cy-cles on the stratigraphic record (Strasser et al., 2000; Boulila et al., 2011).
5.2 Meaning of the Paris Basin deformations at European scale
Three main periods of deformation were characterized from the 2-D accommodation measurement (Fig. 5) and the 3-D sediment thickness maps (Fig. 8):
– Intra-Maastrichtian–pre-Thanetian (T1, 59 Ma): This
deformation phase is probably composed of two super-imposed deformations: Maastrichtian–pre-middle Da-nian and Upper DaDa-nian–pre-Thanetian. These deforma-tions are difficult to decipher and restore, but result in a long-wavelength deformation with the formation of the present-day ring shape of the Paris Basin, its emer-sion, and a major change in the sedimentary systems (Fig. 10b).
– early Ypresian (T4–Y2, 56.4–54.3 Ma):
medium-wavelength inversion of the Hurepoix Block and, at 55. 1 Ma, initiation of the southward-migrating flexure.
– Uppermost Ypresian (L1–intra-NP 13, mean 49.8 Ma):
uplift of the Paris Basin at a long wavelength (× 100 km) corresponding to the emersion of the whole basin.
Microtectonic data measured in the Paris, Belgium, and Lon-don basins do not show evidence of stress changes around these periods. Depending on the area, the Palaeocene is either more compressional (Blés et al., 1989, northern French Mas-sif Central; Rocher et al., 2004; André et al., 2010, eastern Paris Basin) or transpressional (Vandycke, 2002, Belgium– northern Paris Basin). Except for Belgium, no age constraints are provided.
The best way to discuss the wavelength and then the spatial distribution of these deformations is to do a comparison with other basins of Western Europe (Fig. 10a) and to identify the tectonic-related unconformities of the same age.
The intra-Maastrichtian–pre-Thanetian deformation is a European-scale unconformity recording more or less signif-icant deformations (Fig. 10a). In the Aquitaine Basin (SW France), a flexure of the North Aquitaine platform is recorded during the Maastrichtian (Platel, 1996), In Provence (SE France), Pyreneo-Provençal deformations are sealed by
Da-Figure 10. Evolution of the deformation of the Paris Basin during Palaeocene–Lower Eocene times – comparison with the surrounding
domains: (a) Synthetic chart. (b) Deformation evolution along a N–S transect from the Ardennes Massif and the French Massif Central.
nian continental facies (Leleu, 2005). A second, more subtle deformation occurs in the southwestern part of the Aquitaine Basin (Serrano, 2001), during late Selandian times. In Bel-gium, Maastrichtian and Danian strike-slip movements have been evidenced in the Mons Basin (Vandycke et al., 1989; Vandycke and Bergerat, 2001). In the Roer Valley graben (NW Germany to The Netherlands and Belgium), the main deformation is around the Danian–Selandian stages (Deck-ers et al., 2014) with a major relative sea level fall and for-mation of a Danian lowstand wedge (Jacob and De Batist, 1996; Vandenberghe et al., 2004). In the Wessex–Hampshire basins, the uppermost Selandian sediments (Thanet Sands) rest unconformably over the deformed chalk (Aubry, 1986; Knox, 1996; Newell, 2001). The Palaeocene is a time of large exhumation in the British Isles with associated turbitic fans related to Iceland plumes (White and Lovell, 1997).
In western Europe, these intra-Maastrichtian–pre-Thanetian deformations, known as Laramide deformations (Ziegler, 1990), are related to either (1) the opening of the North Atlantic and the Faroe–Shetlands–Greenland volcanic trap (Iceland doming; Doré et al., 1999; Anell et al., 2009;
White and Lovell, 1997) or (2) a compressional event; the Africa, Iberia, Eurasia convergence (Ziegler, 1990). The purpose of this present work is not to discuss the relative importance of these two processes, which could only be a local record of a more Earth-scale plate (and then mantle circulation) reorganization. Irrespective of the mechanism, it is clear that compressive deformations affect southern France around the Cretaceous–Cenozoic boundary (before Danian) and that Palaeocene to early Eocene volcanism (Fig. 10a) is widespread in western Europe: the Faroe– Shetlands–Greenland flood basalts (Mussett et al., 1988; Knox, 1996), the French Massif Central (Bellon et al., 1974; Vincent et al., 1977), and the Rhenish Massif (Baranyi et al., 1976; Schmitt et al., 2007; Reischmann et al., 2011).
The early Ypresian deformation is located in northwest-ern Europe. It does not exist in the Aquitaine Basin, or in the Wessex–Hampshire basins. In Belgium, an uplift of the Bra-bant Massif is documented from the Thanetian to the early Ypresian (Vandenberghe et al., 2004). Graben inversions in the St George’s Channel (Anell et al., 2009) and of the West-ern Approaches (Le Roy et al., 2011) are reported in this time
interval and are probably related to the onset of the North At-lantic opening that takes place at this time (Fig. 10a). How-ever, the occurrence of this deformation only in northwestern Europe, as well as its timing and the direction of deformation, are congruent with inversions related to the North Atlantic opening.
The uppermost Ypresian deformation is again a West European-scale deformation (Fig. 10a). In the Aquitaine Basin, it corresponds to a major hiatus on the northern Aquitaine platform (Sztrakos et al., 2010), and the develop-ment of a flexural basin in the eastern Aquitaine Basin (Cor-bières, Christophoul et al., 2003). On the southwestern bor-der of the North Sea (Belgium), the main deformation oc-curred during the uppermost Ypresian (Vandenberghe et al., 1998, 2004), with an uplift of the southern part of the Brabant and the erosion of the incised valleys of the Bruxelles Sands Fm. In the Wessex–Hampshire basins, the overall prograda-tion of the London Clays Fm (King, 1981) is disrupted by a tectonic-induced unconformity (Newell, 2014) within the base of the Brackelsham Gp. This deformation is currently reported for the Africa–Eurasia convergence (Pyrenean com-pression). The timing and axis of the observed deformation are congruent with such a compressional deformation.
5.3 Control of inherited Variscan structures on Palaeogene deformations
Our study demonstrates a reactivation of crustal Variscan faults but with limited play, except for Sparnacian time (Cy-cle Cy1). Fault reactivation does not significantly affect the palaeogeography and thickness distribution. During long-wavelength deformations, crustal fault reactivation is not sig-nificant, but these deformations involve a larger thickness of the lithosphere.
In contrast, during Sparnacian times, Seine, Valpuiseaux, and Rambouillet faults are bounding the Hurepoix Block which is strongly reactivated. Sparnacian time is also the pe-riod during which maximum accommodation variations are measured over Bray and Belou faults. Interestingly, Sparna-cian deformations are of smaller (medium) wavelength, af-fecting a thinner part of the lithosphere and related to a dif-ferent geodynamic event.
During Thanetian (Ct cycle) and Ypresian (Cy2 cycle) times, depocentres were located north of the Bray Fault or on both sides of the same Bray Fault (Fig. 1). This subsiding do-main is limited toward the SE by the St Martin-de-Bossenay Fault (Fig. 1). Maximum subsidence areas are located along the Belou Fault.
This domain corresponds to the location of the remnant Variscan subducted slab (Averbuch and Piromallo, 2012), which could be the control of the long-term subsidence of the Paris Basin, rather than a Permo-Triassic extension that does not exist in this area (Delmas et al., 2002).
6 Conclusions
The objective of this study was to use high-resolution 3-D stratigraphic data to discuss the deformation of an intracra-tonic basin, the Paris Basin, at the time of a major change in subsidence occurring around the Cretaceous–Palaeogene boundary, from the subsiding Cretaceous time to a (very) low subsiding Palaeogene time with low sediment preservation.
– An age model integrating biostratigraphic uncertainties,
sequence stratigraphic surfaces, high-resolution oxygen isotope curves (Cramer et al., 2011), and Earth orbital solutions for long-term eccentricity (Laskar et al., 2011) was performed at a resolution of 100 Kyrs (Fig. 3 and Table 2).
– A 3-D stratigraphic database comprising more than 300
well-logs and eight time lines (depth, lithology facies) was built (Figs. 6, 7, 8, and 9).
– A 2-D accommodation space measurement was
per-formed along a significant S–N transect to constrain the nature of the deformation (Fig. 5).
– Two orders of sequences were identified: from 400 to
800 Kyrs and from 1 to 5 Ma. The first one is assumed to be controlled by eustasy and the second one by tec-tonic (Ct, Thanetian; Cy2, Ypresian) or enhanced by sedimentary flux (climatic ?; Cy1, Ypresian).
– The tectonic control is due to flexures initiated north of
the Bray Fault and progressively decreasing with spatial homogenization of the subsidence.
– Three phases of deformation were recognized:
a. Intra-Maastrichtian–pre-Thanetian (T1, 59 Ma) major long-wavelength deformations with for-mation of the present-day ring shape of the Paris Basin, its emersion and the major change in the sedimentary systems from open marine chalk to siliciclastic shore deposits (Fig. 10b). This European-scale deformation corresponds to the Laramide deformation (Ziegler, 1990) and is coeval with Upper Cretaceous pre-Danian com-pressive deformations linked to the Africa–Eurasia convergence, which is well recorded in southern France (Pyreneo-Provençal deformations) and with the paroxysm of a large volcanic province extending from the North Atlantic to the French Massif Central and the Rhenish Shield during the Palaeocene (Fig. 10a). Two stages of deformation – poorly dated – occurred during the uppermost Maastrichtian to pre-Thanetian.
b. Early Ypresian (T4–Y2, 56.4–54.3 Ma) minor medium-wavelength deformation with an inversion of one of the Variscan units in the Paris Basin – the