HAL Id: hal-03222781
https://hal.archives-ouvertes.fr/hal-03222781
Submitted on 10 May 2021
HAL is a multi-disciplinary open access
archive for the deposit and dissemination of
sci-entific research documents, whether they are
pub-lished or not. The documents may come from
teaching and research institutions in France or
abroad, or from public or private research centers.
L’archive ouverte pluridisciplinaire HAL, est
destinée au dépôt et à la diffusion de documents
scientifiques de niveau recherche, publiés ou non,
émanant des établissements d’enseignement et de
recherche français ou étrangers, des laboratoires
publics ou privés.
Distributed under a Creative Commons Attribution - NonCommercial| 4.0 International
License
development and validation of a model on surf beaches
of southwestern France
Eric Tellier, Bruno Simonnet, Cédric Gil-Jardiné, Marion Lerouge-Bailhache,
Bruno Castelle, Louis Rachid Salmi
To cite this version:
Eric Tellier, Bruno Simonnet, Cédric Gil-Jardiné, Marion Lerouge-Bailhache, Bruno Castelle, et
al.. Predicting drowning from sea and weather forecasts: development and validation of a model
on surf beaches of southwestern France.
Injury Prevention, BMJ Publishing Group, In press,
Predicting drowning from sea and weather forecasts:
development and validation of a model on surf
beaches of southwestern France
Éric Tellier ,
1,2Bruno Simonnet,
1Cédric Gil- Jardiné,
1,2Marion Lerouge- Bailhache,
2,3Bruno Castelle,
4,5Rachid Salmi
2,6To cite: Tellier É, Simonnet B,
Gil- Jardiné C, et al. Inj Prev Epub ahead of print: [please include Day Month Year]. doi:10.1136/
injuryprev-2020-044092 ► Additional material is published online only. To view please visit the journal online (http:// dx. doi. org/ 10. 1136/ injuryprev- 2020- 044092).
1Pôle Urgences adultes SAMU-
SMUR, CHU Bordeaux GH Pellegrin, Bordeaux, France
2Bordeaux Population Health,
Université de Bordeaux Collège Sciences de la Santé, Bordeaux, France
3Pôle de Pédiatrie, CHU
Bordeaux GH Pellegrin, Bordeaux, France
4UMR EPOC, CNRS, Pessac,
France
5UMR EPOC, Université
Bordeaux 1 UFR des Sciences de la Terre et de la Mer, Pessac, Aquitaine, France
6Pôle de santé publique,
Service d’information médicale, CHU Bordeaux GH Pellegrin, Bordeaux, France
Correspondence to
Dr Éric Tellier, Pôle Urgences adultes SAMU- SMUR, CHU Bordeaux GH Pellegrin, Bordeaux, France; eric. tellier@ u- bordeaux. fr
Received 18 November 2020 Revised 9 February 2021 Accepted 15 February 2021
© Author(s) (or their employer(s)) 2021. Re- use permitted under CC BY- NC. No commercial re- use. See rights and permissions. Published by BMJ.
ABSTRACT
Objective To predict the coast- wide risk of drowning along the surf beaches of Gironde, southwestern France. Methods Data on rescues and drownings were collected from the Medical Emergency Center of Gironde (SAMU 33). Seasonality, holidays, weekends, weather and metocean conditions were considered potentially predictive. Logistic regression models were fitted with data from 2011 to 2013 and used to predict 2015–2017 events employing weather and ocean forecasts.
Results Air temperature, wave parameters, seasonality and holidays were associated with drownings. Prospective validation was performed on 617 days, covering 232 events (rescues and drownings) reported on 104 different days. The area under the curve (AUC) of the daily risk prediction model (combined with 3- day forecasts) was 0.82 (95% CI 0.79 to 0.86). The AUC of the 3- hour step model was 0.85 (95% CI 0.81 to 0.88). Conclusions Drowning events along the Gironde surf coast can be anticipated up to 3 days in advance. Preventative messages and rescue preparations could be increased as the forecast risk increased, especially during the off- peak season, when the number of available rescuers is low.
INTRODUCTION
According to the 2017 Global Burden of Disease study, drowning is a major cause of non- intentional deaths from injury worldwide.1 In France, the
national public health agency (Santé Publique France) performs a national study every 3 years, registering all cases of drowning leading to hospital-isation or death between 1 June and 15 September of the studied year. In 2015, this study reported 1266 drownings, with 637 (50.3%) occurring along the seashore.2 In a previous study on the
surf beaches of Gironde, southwestern France, 576 people required rescue over 6 years; there were 24 fatalities due to drowning.3 In terms of the length of
the coastline, the annual mean was 3.3 deaths/100 km, a rate comparable to the highest recorded along the US coastline.4
The Gironde coast is a 126- km- long stretch of sandy beaches (figure 1) exposed to high- energy waves that drive intense, narrow seaward- flowing jets of water termed ‘rip currents’. A previous study showed5 that these currents cause 79% of
drown-ings. Rip currents are the leading causes of rescues and drownings off many surf coasts worldwide.4 6–9
Drowning is sudden; prevention is key when the aim is to reduce the incidence of drowning.10–12
Primary prevention may modify beachgoer behaviour13; lifeguards can impart preventative
messages,14 reducing the need for medical attention
and cardiopulmonary resuscitation of drowning victims.15 16 When a drowning occurs, a fast response
involving bystanders, lifeguards, paramedics and a medical team if necessary, is essential.17
Drowning prevention on the Gironde beaches features patrolled areas, signs at most beach entrances, and leaflets describing the rip current and shore- break hazards. However, the beaches are not patrolled during the entire bathing season, which extends from April to October. Most life-guard stations are open only in July and August; the locations most frequented by tourists are patrolled from mid- June to mid- September. On weekends in May and June, some areas are watched, depending on local authorities. The mayor is responsible for beach supervision, which is regionally coordi-nated by the departmental prefect in collaboration with the prehospital care department of Bordeaux University Hospital. During high season, rescue helicopters are on standby (figure 1). On low- season weekends, one helicopter may be on duty, depending on the regional authority.
Models predicting the coast- wide life- risk of drowning would be useful if they enhanced the preventative measures taken to reduce risk. Predic-tive models of rip currents have been implemented in Florida,18 Puerto Rico,19 Mexico,20 India8 and
Great Britain.21 These models were based on
physics, modelling the occurrence and the speed of rip currents flow. They have been evaluated both retrospectively and in the field using hindcasts. To the best of our knowledge, they have not been prospectively evaluated using forecasts, and model predictions have not been compared with actual drownings.
The number of people exposed to a rip hazard is directly related to the number of swimmers and other water users, and therefore linked to beach attendance. Attendance rises on holidays, week-ends, and with increased air temperature and less cloud cover; the number of bathers reflects air and water temperatures and (possibly) wind speed. As the risk of drowning is a combination of the hazard per se and exposure to it, and as the latter is poorly quantified, we created a model including parame-ters reflecting exposure to rip currents. We assessed
on May 10, 2021 by guest. Protected by copyright.
http://injuryprevention.bmj.com/
whether drownings off Gironde beaches could be anticipated using a coast- wide risk prediction model based on forecast metocean conditions.
MATERIALS AND METHODS Study setting
We performed an observational study along the French Atlantic coastline of Gironde (figure 1). The coast is meso- macrotidal, with spring tide range reaching 5 m. Summer- averaged signifi-cant wave height and peak period are approximately 1.3 m and 9 s, respectively.22 Deep rip channels incise the inner intertidal
bar, with an average spacing of c. 400 m, through which intense rip currents can flow. In typical summer wave conditions, rip current activity is maximised for long period waves and shore- normal incidence between low- tide and mid- tide.23 Even for
waves of approximately 1 m, mean rip current speed can reach 1 m/s.23
We first developed a model based on medical emergency calls from beaches, along with observed metocean conditions, in 2011, 2012 and 2013. We evaluated only the bathing season (April–October). We tested the model to assess whether it accu-rately predicted events that occurred from April to October in 2015, 2016 and 2017, using metocean forecasts. We used the RiGoR guidelines24 to address common sources of bias in risk-
prediction models, and we adhered to the Strengthening the Reporting of Observational Studies in Epidemiology statement for observational studies.25
Data sources
Medical emergency calls
In Gironde, medical emergency calls either from a bystander or a lifeguard are received by a single medical emergency call centre (Service d’Aide Médicale d’Urgence). During each call, a physi-cian records all information given by the caller, paramedics and (when applicable) prehospital care teams. All calls dealing with rescue from water or drowning were included in the data for this study; these were the events of interest. ‘Rescue’ refers to a need for evacuation from the water,11 and ‘drowning’ refers to
respiratory impairment caused by submersion or immersion, as
defined by the WHO.26 Both events were considered as adverse
water events. We excluded calls lacking victims, training calls and duplicates. As every instance of a need for medical advice or a prehospital care team triggered a call, we considered that all events of importance would be identified. Information on every call was carefully read to avoid errors. Intentional drownings and drownings associated with known diseases (eg, seizure) were excluded.
Environmental conditions
Hourly tidal data were modelled by the ‘Service Hydro-graphique et OcéanoHydro-graphique de la Marine’ (SHOM, authori-sation no. 296/2014) using the Lacanau shore as the reference. Lacanau is located in the approximate centre of the study area; according to the SHOM, the maximum tide phase lag over the entire study area is approximately 15 min. Wave conditions were measured every 30 min by the Centre d’Archivage National de Données de Houle In- Situ buoy27 located at 044°39.150′N and
001°26.800′W (figure 1). The wave propagation time from the buoy to the coast is about 1 hour. Observed and forecast meteorological and wave conditions were provided by Météo- France, the French national meteorological service. We used data from the Cap Ferret weather station; Météo- France claims that these well- represent the weather along the entire Gironde coast. Retrospectively, forecasts were not available and observed data were used for 2011–2013. Forecast data, collected prospectively, were available for up to 3 days and at 3 hour steps (7:00 am UTC ±00:00, 10:00 am, etc.). Weather and sea forecasts were Météo- France expert data based on the AROME and WW3 models, respectively. We recorded sea height, the wave height, period and direction. We also recorded wind speed and direction, air and water temperatures, and cloud cover. Other factors influ-encing beach attendance were the season and type of day. High season was defined as the period from 15 June to 15 September, when most lifeguard stations are open. We distinguished between weekdays, weekends and holidays.
Statistical methods
We fitted two logistic regression models: a ‘daily model’ predicting the overall coast- wide risk of at least one adverse water event on a given day, and a ‘3- h- step model’ predicting the risks at different times of the day (9:30 am−12:29 pm, 12:30−3:29 pm, 3:30−6:29 pm and 6:30-9:30 pm; all local times). Given above mentioned differences in the environmental data collection modes between the training and validation periods, we checked data consistency both visually and using the Wilcoxon- Mann- Whitney and Student’s t- tests.
Days for which metocean data were lacking were removed from the analysis. Prospective cohort data (including variable selection) were not used during model development. We trans-formed the wave parameters : the wave factor (Wf) is the product of significant wave height and peak wave period, and the wave incidence factor Df is defined by the equation (1), with θ the
mean wave direction (in degrees):
Df= cos4(θ− 278) (1)
278° is the mean angle of the normal to the coastline of the studied area. Therefore, Df range is 0–1 and is maximal when the wave direction is perpendicular to the coast. This transfor-mation emphasises on small variations around the shore normal and made Df log- linear. We categorised non- log- linear quan-titative variables (temperatures, wave factor and sea height); these were first divided into quantiles and then reduced using
Figure 1 Map of Gironde, France, with studied area for life- risk
prediction, location of air rescue bases used during high season, and hospitals. Observed data came from the Cap Ferret weather station and a buoy located offshore. Adapted from Tellier et al.3
on May 10, 2021 by guest. Protected by copyright.
the Akaike Information Criterion (AIC) in a multivariate context.28 Model selection used the AIC to perform
interac-tion checks; we tested all possible models.29 ORs with 95% CIs
were computed as bootstrap estimates. We checked that residual autocorrelation was absent. Goodness of fit was assessed using the Le Cessie- Van Houwelingen test.30 Calibration was assessed
graphically employing a locally weighted, least- square regression smoother31 and the Spiegelhalter Z- test. Discriminatory power
was assessed using receiver operator characteristic (ROC) curves based in data from each cohort. Fit and validation accuracies were assessed via Brier scoring. We measured the importance of the selected predictors by their partial Wald χ2 statistics minus
the predictors’ degree of freedom and their proportions.31 The
outcomes derived using 1, 2 and 3- day forecasts were compared by drawing ROC curves using the Delong and Venkatraman method for paired data32–34; we applied Holm- Bonferroni
corrections. We created a five- level risk scale using the quintiles of the fitted probabilities. All analyses employed R software35
running the RMS31 and pROC packages.33
RESULTS
Retrospective data were lacking for 77 days because of a buoy failure, and for 26 prospective days (21 because of data- link loss and 5 because of server unavailability). We analysed 563 days during 2011–2013; 242 adverse water events (136 rescues and 106 drownings) were reported on 108 different days. In 2015–2017, data were available for 612 days; there were 232 adverse water events (155 rescues and 77 drownings) on 104 different days (table 1). Demographics were similar between the two periods, with a sex ratio of 0.61 F/M, and a median age of 23 (quartiles (18–42)). All retrospective and prospective cohort data were consistent, except for wind speed, which differed significantly between prospective and retrospective data, and cloud cover, which was measured by different means over the retrospective and prospective periods. Both were excluded from prospective analyses.
The final, predictive, daily coast- wide life- risk model included wave and wave incidence factors, air temperature, type of day and season (table 2). Water temperature and tidal range were not retained in the model. The model predicting risk at 3- hour steps featured sea height, wave parameters, air temperature, time of day, type of day and season (see online supplemental appendix table A1). Variation in the daily model was attribut-able principally to air temperature (proportion of the overall χ2
value, 40.9%), wave factors (21.7%), and time of day (16.2%) (figure 2). The principal 3- hour- step model predictors were air temperature (28.9%), the time of day (17.8%), and wave factors (12.6%) (online supplemental appendix figure A1). The prob-ability of a daily drowning occurrence according to the final model is given by the equation (2), with Df the wave incidence factor, Wf the wave factor and Tair the air temperature.
ˆ
γ = −7.83 + 1.65[Tairϵ] + 2.91[Tair > 23.5]
+1.14[highseason] − 1.45[weekday]
+0.363[weekend] + 3.12 × Df+ 1.86[Wf≤ 9.2]
+1.96[Wf> 9.2]
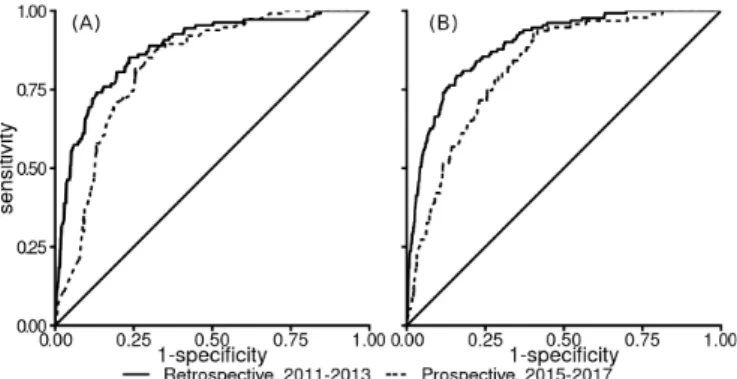
The daily model had areas under the curves (AUCs) of 0.88 (95% CI 0.84 to 0.91) for 2011–2013 and 0.82 (95% CI 0.78 to 0.86) for 2015–2017 (figure 3). The 3- hour risk model had AUCs of 0.89 (95% CI 0.87 to 0.92) for 2011–2013 and 0.85 (95% CI 0.81 to 0.88) for 2015–2017 (figure 3). Model outcomes did not differ when forecasts for 1, 2 and 3 days were used (p>0.05). Both models were well calibrated in terms of retrospective data (goodness- of- fit test p=0.20 for the daily model, p=0.53 for the 3- hour- step model). Both models exhibited significant p values on Spiegelhalter Z- testing of prospective data, evidencing a lack of calibration: the daily model tended to overpredict days with risks of drowning >0.5; the 3- hour step model overpredicted risks as low as 0.1.
Using prospective data with 3- day forecasts, we found that assessment of the coast- wide risk of water adverse event using the five- level scale missed 1 of 158 days featuring a rescue at
Table 1 Description of days without and with adverse water events
2011–2013 2015–2017
Days without events* (n=455) Days with events (n=108) Days without events (n=513) Days with events (n=104)
Wave factor†, m×s 11.3 5.6–14.6 10.3 6.5–12.9 11.3 5.4–14.4 14.5 8.0–18.0 Wave incidence factor‡ 0.80 0.69–0.99 0.89 0.85–0.99 0.80 0.74–0.97 0.88 0.83–0.97
Cloud cover (0–4)§ 2.8 2.0–3.7 2.4 1.5–3.0 − − Air temperature, °C 21.6 19.2–23.9 25.2 23.3–26.6 21.5 19.0–24.0 25.5 23.0–27.0 Water temperature, °C 19.0 17.6–20.9 21.3 20.3–22.5 18.0 16.0–20.0 20.3 20.0–21.0 Wind speed¶, m/s 7.0 5.3–8.2 6.6 5.3–7.3 4.9 2.7–5.5 4.2 2.7–5.5 Season**, n (%) High 187 (41.1) 90 (83.3) 199 (38.8) 79 (76.0) Low 268 (58.9) 18 (16.7) 314 (61.2) 25 (24.0) Type of day, n (%) Weekday 213 (46.8) 18 (16.7) 233 (45.4) 24 (23.1) Weekend 82 (18.0) 12 (11.1) 88 (17.2) 17 (16.3) Vacation 160 (35.1) 78 (72.2) 192 (37.4) 63 (60.6)
Meteorological and wave conditions (medians and quartiles) and the characteristics of days on which rescues and/or drownings occurred along the Gironde coast of southwestern France.
*Events include rescues and drownings.
†Wave factor: wave height (m) times wave period (s). ‡The wave incidence factor ranges from 0 to 1; see equation (1).
§Forecast values not shown because of differences in the modes of data measurement. ¶Significant differences between observed and forecast data.
**High season: 15 June to 15 September.
on May 10, 2021 by guest. Protected by copyright.
http://injuryprevention.bmj.com/
the lowest risk level (0.6%). The missed case was a rescued man who presented without a cough and was discharged on site. The prospective data predicted 45.8% of days with rescue events at the highest risk level (table 3). Few differences between forecasts according to their delay and the risk level were observed (see online supplemental material table A2). The 3- hour step model missed 2 of 481 rescues, one at the lowest level (0.4%) and one at the highest (15.7%).
Observed rescues and drownings by predicted risk level derived using regression models exploiting 3- day forecasts; Gironde, southwestern France.
The missed case at the lowest risk level in the retrospective cohort occurred during moderate wave conditions (wave factor ~8 m×s) and at low wave incidence factor (0.47), but the victim required only rescue, was asymptomatic on rescue, and was not evacuated. The second missed event occurred at the tip of the Cap Ferret sandspit, which lacks wave- driven rip currents. The
last missed event occurred at La Salie Nord, adjacent to (south of) the Arcachon inlet, under moderate wave conditions.
The 3- hour step model missed two events in the prospective cohort, both in September 2017, and both occurring under strong wave conditions (wave factor>15 m×s). One was a surfer; the activity pursued by the other victim was not recorded. Both cases were minor and were treated in the local hospital.
DISCUSSION
While previous studies examined the association of ocean drowning risk with weather conditions,36–39 our study is the first
to focus on the prediction of life- risk. Air temperature, wave
Table 2 Factors associated with daily adverse water events along the Gironde coast
Crude OR (95% CI) Adj. OR (95% CI) χ2
Wave factor*, m×s 22.8
<5.2 Ref. Ref.
5.2–9.2 3.89 (2.03 to 9.81) 6.41 (2.93 to 18.3)
>9.2 1.96 (1.01 to 4.50) 7.10 (3.09 to 22.7)
Wave incidence factor* 1.83 (1.40 to 2.62) 2.27 (1.58 to 3.70) 13.2
Cloud cover†‡ 0.52 (0.37 to 0.74) – Air temperature*, °C 43.0 ≤21 Ref. Ref. 21–23.5 6.58 (3.03 to 19.2) 4.79 (1.93 to 16.6) >23.5 19.10 (9.62 to 61.8) 12.20 (4.69 to 52.3) Water temperature*, °C ≤19.5 Ref. – 19.5–21.3 3.95 (2.13 to 9.14) >21.3 13.18 (7.60 to 27.0) Wind speed†, m/s ≤4.3 Ref. – 4.3–6.3 1.71 (1.00 to 3.14) >6.3 0.84 (0.45 to 1.66) Season 10.4
Low Ref. Ref.
High 7.17 (4.38 to 13.5) 3.98 (1.44 to 6.11)
Type of day 17.1
Weekday Ref. Ref.
Weekend 1.73 (0.71 to 3.62) 2.96 (1.06 to 7.98)
Holidays 5.77 (3.49 to 10.8) 4.25 (2.19 to 9.75)
Univariate and multivariate analyses performed with the aid of logistic regression models using retrospective data from 2011 to 2013. *Daily maximal value.
†Daily mean value.
‡Not incorporated into multivariate analyses because of differences in measurement modes.
Figure 2 Importance of predictors in daily coast- wide life- risk along
Gironde surf beaches. Importance of predictors is assessed using Wald statistics minus two df, with their 95% CI given by bootstrap estimations, multivariate logistic regression model.
Figure 3 Receiver operator characteristic curves of prediction models
of water adverse event along Gironde coast. (A) Prediction model using daily data: area under the curve (AUC) of 0.88 (95% CI 0.84 to 0.91) for 2011–2013 data and 0.82 (95% CI 0.78 to 0.86) for 2015–2017 data. (B) Model predicting coast- wide life- risk over 3- hour periods: AUC of 0.89 (95% CI 0.87 to 0.92) and 0.85 (95% CI 0.81 to 0.88).
on May 10, 2021 by guest. Protected by copyright.
direction and the wave factor were the primary environmental predictors; the type of day and the season were also significant, but less important, predictors. Given the availability of extensive metocean data used to infer rip current activity, we were able to build a tool that accurately predicted coast- wide life risk.
Warm weather increases sea exposure and therefore the risk of drowning, consistent with other studies.40 41 This finding,
associ-ated with the importance of the time of day, highlights the social dimension of the drowning risk. Actually, air temperature and time of the day may be the primary controls for the number of beach users and their behaviours.
Wave parameters influencing rip current flow velocity were significant predictors of drowning, consistent with the results of physical models.21 For instance, coast- wide life- risk was
increased for more shore- normally incident waves.42 Here, the
life- risk was found to systematically increase with the wave factor Wf, which is in line with Castelle et al, but contrast with Scott et al43 in UK where hazard was maximised for just below
average Wf. In a previous study,44 it was qualitatively shown
that the beach morphology, which has a profound impact on rip current hazard, was important to the number of drowning inci-dents. Given the low number of studied seasons and events, and the likely contrasting beachgoer profiles between seasons, it was not possible to robustly address the influence of the bathymetry. A beach bathymetry proxy could be added to the model via the integration of beach state estimation model based on the equi-librium concept.45
As the wind parameters differed between the retrospective and prospective periods, we could not use these parameters, although they might have further improved the models. Cloud cover was measured differently during the two periods and thus could not be incorporated into the models. Although univariate analysis showed that cloud cover was a significant predictor of drowning, it is strongly correlated with air temperature. Future models should integrate predicted rather than observed measures. Parameters such as cloud cover could be therefore studied.
Our models tend to overestimate the risk on days associated with moderate to high risks; some variables may thus be unknown, related to the beach morphology and the beach attendance. First, the summer beach morphology along the Gironde coast is very variable with rip channel exhibiting different morphologies from one summer to another,44 and even in space with more gently
sloping and less channelized beaches northwards. Given that, for
instance, the relative depth of the rip channels is critical to rip current flow speed,46 and thus physical hazard, and that beach
type also influence attendance47 consideration of a constant
beach morphology is limiting. Although the current version of our model does not account for beach attendance data, it can guide lifeguard/rescue decision makers who need to allocate resources. Moreover, drownings are certainly under- reported to the emergency call centre; reporting rates may vary over time. We could not directly estimate exposure, as beach attendance is not measured in Gironde. This findings might also be due to the consistency between the perception of the hazard by beach users and the computed risk.48 The timestamps for the calls are
provided automatically by the emergency call centre database. It may be delayed by a few minutes from the event.
Turning to the missed events, two occurred in sectors adjacent to the Arcachon lagoon inlet, where local, strong tide- driven currents develop at low tide, constituting a major hazard. We hypothesise that the missed events were attributable to these currents. This highlights the need to carefully target preventative messages; the primary hazards vary locally.
Use of the 1, 2 and 3- day forecasts yielded similar results; this will aid in the efficient deployment of lifeguards and rescue equipment. Accurate local forecasts more than 3 days ahead are not available.
How may our findings save lives? This work can be used in two ways: the first as a trigger for targeted preventative messages, and the second as a decision aid for rescue services.
The use of a binary scale would trigger many false alarms; thus, we considered that a five- level scale was more appropriate, as such scales are used to predict other risks posed by natural hazards (such as snow avalanches). Our scale should be improved using a risk utility function, which remains to be specifically determined. We concede that our present levels are arbitrary; we must still explore what beachgoers and decision- makers consider to be ‘low’, ‘moderate’ or ‘acceptable’ risks. The study of social factors influencing beach attendance and water use might still be important to study to formulate preventative messages. This will be the object of a future study.
Any message suggested by our models must be consistent with ‘messages’ imparted by beach flags. These flags can be ‘green’ (no or minor hazard, bathing supervised), ‘yellow’ (hazard, bathing supervised) or ‘red’ (major hazard, no bathing allowed). They are determined by lifeguards based on wave conditions, water temperature, and beach attendance, and may vary depending (for example) on lifeguard experience. Unpublished local reports indicate that green and red flags are rarely raised during the high season on the Gironde coast. The future integration of forecasts into drowning prevention strategies should therefore take into account the social dimension of rip current hazard.49
We are confident that our model can be adapted to similar beaches with rip currents, but complete generalisation of our findings is inappropriate in the absence of more data. Lifeguard knowledge and the physical parameters of natural hazards require attention: our model was built on lifeguard hypothesis for beach attendance and physics models of natural hazard. The next steps are forecast validation by lifeguards and automation of feed-back; these will allow the model to be continuously improved. As more data become available, other modelling strategies may be appropriate, such as Bayesian or neural networks. In such strategies, the importance of the exposure would be of interest to identify environmental conditions prone to risky behaviour.
Predicting the need for rescue from water in a hazardous envi-ronment is key to reducing the risk of drowning. Our predic-tive models can be used to efficiently deploy medical teams and
Table 3 Observed rescues versus predicted coast- wide risk of
adverse water event
Risk level
2011–2013 2015–2017
Events* Total % Events Total %
Daily model† 1 3 113 2.7 1 172 0.6 2 1 112 0.9 8 105 7.1 3 11 113 9.7 15 95 15.8 4 23 112 20.5 23 88 26.1 5 70 113 61.9 66 144 45.8
3- hour- step model‡
1 0 395 0.0 2 481 0.4
2 3 394 0.8 3 381 0.8
3 6 394 1.5 10 309 3.2
4 19 394 4.8 22 330 6.7
5 103 394 26.1 58 369 15.7
*Events: rescues and drownings.
†Goodness of fit: p=0.20, calibration test p<0.001. Brier scores: 0.10 for 2011–2013, 0.12 for 2015–2017. ‡Goodness of fit: p=0.53, calibration test p=0.10. Brier scores: 0.05 for 2011–2013, 0.05 for 2015–2017.
on May 10, 2021 by guest. Protected by copyright.
http://injuryprevention.bmj.com/
rescue helicopters. An interventional study (performed under real- world conditions) is planned. A utility function reflecting risk perception/acceptance is required. This would allow prior-itised preventative messages to be broadcast during high- risk periods. The strategy must employ behavioural change theory to reduce the risk to beachgoers. Evaluation requires reliable data from both lifeguard stations and emergency call centre files.
Contributors ÉT: conceptualisation, methodology, software, validation, formal
analysis, investigation, data curation, original draft preparation, review and editing. CG- J: methodology, original draft preparation, review. ML- B: methodology, original draft preparation, review. BC: conceptualisation, data curation, methodology, original draft preparation, review. BS: conceptualisation, methodology, data curation, investigation, review. RS: original draft preparation, review and editing.
Funding The authors have not declared a specific grant for this research from any
funding agency in the public, commercial or not- for- profit sectors.
Map disclaimer The depiction of boundaries on this map does not imply the
expression of any opinion whatsoever on the part of BMJ (or any member of its group) concerning the legal status of any country, territory, jurisdiction or area or of its authorities. This map is provided without any warranty of any kind, either express or implied.
Competing interests None declared. Patient consent for publication Not required.
Ethics approval Data collection was approved by the French national committee
protecting data privacy (Commission Nationale de l’Informatique et des Libertés, CNIL), provided that only compiled (anonymised) data would be published. French law states that a retrospective observational study does not require ethics committee authorisation.
Provenance and peer review Not commissioned; externally peer reviewed. Data availability statement Compiled data are available in a public, open access
repository. Detailed data may be obtained from a third party and are not publicly available. Therefore, daily model data are available on the OSF repository: https:// osf. io/ p9u8a/ and, due to data providers restrictions, 3- hour step model data are available upon request from the corresponding author ( eric. tellier@ chu- bordeaux. fr).
Supplemental material This content has been supplied by the author(s). It
has not been vetted by BMJ Publishing Group Limited (BMJ) and may not have been peer- reviewed. Any opinions or recommendations discussed are solely those of the author(s) and are not endorsed by BMJ. BMJ disclaims all liability and responsibility arising from any reliance placed on the content. Where the content includes any translated material, BMJ does not warrant the accuracy and reliability of the translations (including but not limited to local regulations, clinical guidelines, terminology, drug names and drug dosages), and is not responsible for any error and/or omissions arising from translation and adaptation or otherwise.
Open access This is an open access article distributed in accordance with the
Creative Commons Attribution Non Commercial (CC BY- NC 4.0) license, which permits others to distribute, remix, adapt, build upon this work non- commercially, and license their derivative works on different terms, provided the original work is
properly cited, appropriate credit is given, any changes made indicated, and the use is non- commercial. See: http:// creativecommons. org/ licenses/ by- nc/ 4. 0/.
ORCID iD
Éric Tellier http:// orcid. org/ 0000- 0002- 4627- 5435
REFERENCES
1 Franklin RC, Peden AE, Hamilton EB, et al. The burden of unintentional drowning: global, regional and national estimates of mortality from the global burden of disease 2017 study. Inj Prev 2020;26:i83–95.
2 Lasbeur L, Szego- Zguem E, Thélot B. Surveillance épidémiologique des noyades - Enquête NOYADES 2015, 1er juin - 30 septembre 2015. Saint- Maurice: Santé publique France, 2016. www. santepubliquefrance. fr
3 Tellier Éric, Simonnet B, Gil- Jardiné C, et al. Characteristics of drowning victims in a surf environment: a 6- year retrospective study in southwestern France. Inj Epidemiol
2019;6:17.
4 Gensini VA, Ashley WS. An examination of RIP current fatalities in the United States.
Nat Hazards 2010;54:159–75.
5 Castelle B, Brander R, Tellier E, et al. Surf zone hazards and injuries on beaches in SW France. Nat Hazards 2018;93:1317–35.
6 Morgan D, Ozanne- Smith J, Triggs T. Descriptive epidemiology of drowning deaths in a surf beach swimmer and surfer population. Inj Prev 2008;14:62–5.
7 Li Z. Rip current hazards in South China headland beaches. Ocean Coast Manag
2016;121:23–32.
8 Arun Kumar SVV, Prasad KVSR. Rip current- related fatalities in India: a new predictive risk scale for forecasting RIP currents. Nat Hazards 2014;70:313–35.
9 Sherker S, Williamson A, Hatfield J, et al. Beachgoers’ beliefs and behaviours in relation to beach flags and RIP currents. Accid Anal Prev 2010;42:1785–804. 10 Bierens J. Drowning. Springer. Berlin, Heidelberg: Springer, 2014.
11 Szpilman D, Bierens JJLM, Handley AJ, et al. Drowning. N Engl J Med
2012;366:2102–10.
12 Lunetta P, Modell JH, Sajantila A. What is the incidence and significance of "dry- lungs" in bodies found in water? Am J Forensic Med Pathol 2004;25:291–301. 13 Hatfield J, Williamson A, Sherker S, et al. Development and evaluation of an
intervention to reduce RIP current related beach drowning. Accid Anal Prev
2012;46:45–51.
14 Koon W, Rowhani- Rahbar A, Quan L. The ocean lifeguard drowning prevention paradigm: how and where do lifeguards intervene in the drowning process? Inj Prev
2018;24:296–9.
15 Szpilman D. Near- drowning and drowning classification: a proposal to stratify mortality based on the analysis of 1,831 cases. Chest 1997;112:660–5. 16 Venema AM, Groothoff JW, Bierens JJLM. The role of bystanders during rescue and
resuscitation of drowning victims. Resuscitation 2010;81:434–9. 17 Szpilman D, Webber J, Quan L, et al. Creating a drowning chain of survival.
Resuscitation 2014;85:1149–52.
18 Lushine JB. A study of RIP current drownings and weather related factors. Nat Weather Dig 1991;16:13–19.
19 Canals M, Morell J. A nearshore breaker prediction system for Puerto Rico and the United States virgin islands in support of beach safety and drowning prevention. OCEANS’15 MTS/IEEE, Washington, 2015:1–10.
20 Cervantes O, Verduzco- Zapata G, Botero C, et al. Determination of risk to users by the spatial and temporal variation of RIP currents on the beach of Santiago Bay, Manzanillo, Mexico: beach hazards and safety strategy as tool for coastal zone management. Ocean Coast Manag 2015;118:205–14.
21 Austin M, Scott T, Russell P. Rip current prediction: development, validation, and evaluation of an operational tool. J Coast Res 2013;29:283–300.
22 Castelle B, Bujan S, Ferreira S, et al. Foredune morphological changes and beach recovery from the extreme 2013/2014 winter at a high- energy sandy coast. Mar Geol
2017;385:41–55.
23 Bruneau N, Castelle B, Bonneton P, et al. Field observations of an evolving RIP current on a meso- macrotidal well- developed inner bar and RIP morphology. Cont Shelf Res
2009;29:1650–62.
24 Kerr KF, Meisner A, Thiessen- Philbrook H, et al. RiGoR: reporting guidelines to address common sources of bias in risk model development. Biomark Res 2015;3:2. 25 von Elm E, Altman DG, Egger M, et al. The strengthening the reporting of
observational studies in epidemiology (STROBE) statement: guidelines for reporting observational studies. J Clin Epidemiol 2008;61:344–9.
26 van Beeck EF, Branche CM, Szpilman D, et al. A new definition of drowning: towards documentation and prevention of a global public health problem. Bull World Health Organ 2005;83:801–80.
27 CEREMA Eau, mer et fleuves - ER/MMH. Candhis (Centre d’Archivage National de Données de Houle In- Situ), 2014. Available: http:// candhis. cetmef. developpement- durable. gouv. fr/
28 Mazumdar M, Smith A, Bacik J. Methods for categorizing a prognostic variable in a multivariable setting. Stat Med 2003;22:559–71.
29 Heinze G, Wallisch C, Dunkler D. Variable selection - A review and recommendations for the practicing statistician. Biom J 2018;60:431–49.
What is already known on the subject
► Drownings along surf beaches are mainly caused by rip
currents.
► Rip currents activity is controlled by wave and beach
morphology factors.
What this study adds
► Along surf beaches of south western France, drownings can
be anticipated using coast- wide wave and weather forecasts in combination with calendar factors.
► Such methods could be adapted to other places with similar
hazards.
on May 10, 2021 by guest. Protected by copyright.
30 Hosmer DW, Hosmer T, Le Cessie S, et al. A comparison of goodness- of- fit tests for the logistic regression model. Stat Med 1997;16:965–80.
31 Harrell F. Regression modeling strategies. Cham: Springer International Publishing, 2015. 32 Venkatraman ES. A permutation test to compare receiver operating characteristic
curves. Biometrics 2000;56:1134–8.
33 Robin X, Turck N, Hainard A, et al. pROC: an open- source package for R and S+ to analyze and compare ROC curves. BMC Bioinformatics 2011;12:77.
34 DeLong ER, DeLong DM, Clarke- Pearson DL. Comparing the areas under two or more correlated receiver operating characteristic curves: a nonparametric approach.
Biometrics 1988;44:837.
35 R Core Team. R: a language and environment for statistical computing. Vienna, Austria: R Foundation for Statistical Computing, 2017. https://www. R- project. org/ 36 Harada SY, Goto RS, Nathanson AT. Analysis of lifeguard- recorded data at Hanauma
Bay, Hawaii. Wilderness Environ Med 2011;22:72–6.
37 Morgan D, Ozanne- Smith J. Surf bather drowning risk and exposure- related factors identified by an expert panel. IJARE 2012;6:8.
38 Morgan D, Ozanne- Smith J. Surf lifeguard rescues. Wilderness Environ Med
2013;24:285–90.
39 Koon W, Rowhani- Rahbar A, Quan L. Do wave heights and water levels increase Ocean lifeguard rescues? Am J Emerg Med 2018;36:1195–201.
40 Fralick M, Denny CJ, Redelmeier DA. Drowning and the influence of hot weather. PLoS One 2013;8:e71689.
41 Clemens T, Tamim H, Rotondi M, et al. A population based study of drowning in Canada. BMC Public Health 2016;16:559.
42 MacMahan JH, Thornton EB, Stanton TP, et al. RIPEX: observations of a RIP current system. Mar Geol 2005;218:113–34.
43 Scott T, Masselink G, Austin MJ, et al. Controls on macrotidal RIP current circulation and hazard. Geomorphology2014;214:198–215.
44 Castelle B, Scott T, Brander R. Environmental controls on surf zone injuries on high- energy beaches. Nat Hazards Earth Syst Sci Discuss 2019:1–35.
45 Splinter KD, Turner IL, Davidson MA, et al. A generalized equilibrium model for predicting daily to interannual shoreline response. J Geophys Res
2014;119:1936–58.
46 MacMahan JH, Thornton EB, Reniers AJHM. Rip current review. Coastal Engineering
2006;53:191–208.
47 Stokes C, Masselink G, Revie M, et al. Application of multiple linear regression and Bayesian belief network approaches to model life risk to beach users in the UK. Ocean Coast Manag 2017;139:12–23.
48 Houser C, Lehner J, Cherry N, et al. Machine learning analysis of lifeguard FLAG decisions and recorded rescues. Nat. Hazards Earth Syst. Sci. 2019;19:2541–9. 49 Ménard AD, Houser C, Brander RW, et al. The psychology of beach users: importance
of confirmation bias, action, and intention to improving RIP current safety. Nat Hazards 2018;94:953–73.
on May 10, 2021 by guest. Protected by copyright.
http://injuryprevention.bmj.com/