HAL Id: hal-00299472
https://hal.archives-ouvertes.fr/hal-00299472
Submitted on 30 Nov 2007
HAL is a multi-disciplinary open access
archive for the deposit and dissemination of
sci-entific research documents, whether they are
pub-lished or not. The documents may come from
teaching and research institutions in France or
abroad, or from public or private research centers.
L’archive ouverte pluridisciplinaire HAL, est
destinée au dépôt et à la diffusion de documents
scientifiques de niveau recherche, publiés ou non,
émanant des établissements d’enseignement et de
recherche français ou étrangers, des laboratoires
publics ou privés.
Tidal triggering evidence of intermediate depth
earthquakes in the Vrancea zone (Romania)
N. Cadicheanu, M. van Ruymbeke, P. Zhu
To cite this version:
N. Cadicheanu, M. van Ruymbeke, P. Zhu. Tidal triggering evidence of intermediate depth earthquakes
in the Vrancea zone (Romania). Natural Hazards and Earth System Science, Copernicus Publications
on behalf of the European Geosciences Union, 2007, 7 (6), pp.733-740. �hal-00299472�
1Institute of Geodynamics of the Romanian Academy, 19-21, Jean-Louis Calderon St., Bucharest-37, 020032, Romania 2Royal Observatory of Belgium, 3, Avenue Circulaire, 1180- Brussels, Belgium
Received: 15 June 2007 – Revised: 19 June 2007 – Accepted: 19 June 2007 – Published: 30 November 2007
Abstract. Tidal triggering evidence of intermediate
earth-quakes in the Vrancea region (Romania) is investigated. The Vrancea seismic zone is located in the bend region of the South-Eastern Carpathians (45◦–46◦N, 25.5◦–27.5◦E) and is known as one of the most active seismic zones in Eu-rope. We selected earthquakes occurred between 1981 and 2005 from the RomPlus catalog provided by the Institute of Earth Physics of Bucharest with Mw≥2.5 and focal depths between 60 and 300 Km.
We assigned a tidal component phase angle for each event which is computed from the earthquake occurrence time. Then the phase angle distribution was obtained by stacking every angle value in a 360 degree coordinate. Main lunar and solar semidiurnal tidal components M2 and S2 are consid-ered. The phase angle distributions are tested by Permutation test which are introduced for the first time to a tidal trigger-ing study. We compared results with classical Schuster’s test. Both tests produce one value, pp for Permutation test and ps for Schuster’s test, which represent the significance level for rejecting the null hypothesis that earthquakes occur ran-domly irrespective of tidal activities M2 and S2 phase distri-bution are random for the complete data set. However, when we set up a one year window and slide it by 30 d step, signifi-cant correlations were found in some windows. As a result of the sliding window, data set systematic temporal patterns re-lated to the decrease of the ppand ps values seem to precede the occurrence of larger earthquakes.
Correspondence to: N. Cadicheanu
(cadichian [email protected])
1 Introduction
Although the amplitude of the tidal stress change is two or three orders smaller than the stress drop of earthquakes, the tidal stress rate could be comparable to the tectonic stress rate and generally larger than this. It is reasonable to expect tidal triggering of an earthquake when the stress in the focal area is near the critical level (Tanaka et al., 2006).
At the intermediate seismic focal depth levels (60 km<focal depth<300 km), the gravitational force is the main outside force which could affect the dynamic process of the inner Earth. Its systematic variations are controlled by the lunar-solar attraction forces on each terrestrial point. It can be calculated through the precisely defined periods of the earth tides that vary from few hours (e.g. diurnal and semi-diurnal waves) to years (Melchior, 1978). Earth tides are deeply modulated signals which depend on the Sun and Moon’s orbital parameters. For the main position on orbits, declination, ellipticity, and positions of the nodes, each is related to the absolute sidereal reference. Local and regional heterogeneities lead to a different response from one zone to another in accordance with the geological and tectonic background and it could also be influenced by the regional characteristics of the mantle-crust interface with a viscous coupling mechanism.
In summary, the response of a seismic zone to tidal pe-riodicities depends on its specific geology, tectonic history and stress accumulation mechanisms in this region. The tidal modulation tendencies in seismic activity could help explain some aspects of the physical mechanism of rupture forming. A remarkable number of studies have been devoted to the possibility of triggering of earthquakes by earth tides. Most have reported negative conclusions about the correlation be-tween the earth tide and earthquake occurrence (Schuster, 1897; Knopoff, 1964; Simpson, 1967; Shudde and Barr, 1977; Heaton, 1982; Curchin and Pennington, 1987; Ry-delek et al., 1992; Vidale et al., 1998). However, many
734 N. Cadicheanu et al.: Tidal triggering evidence
Fig. 1. Time series partition into selected time period T . An event Ei occurring at time tiwill defined by an angle αi.
Table 1. Earth tide components and their periodicities.
Earth tide Doodson Angular Periodicity Amplitude component argument frequency (◦/h) (h) (microgal) S2 273.555 30.000000 12.000000 42.286 M2 255.555 28.984104 12.421000 90.812
recent papers have indicated positive correlations (Enescu and Enescu, 1999; Stavinschi and Souchay, 2003; Stroup, 2007; Tsuruoka et al., 1995; Tolstoy et al., 2002; Tanaka et al., 2002, 2006; Zugravescu et al., 1985, Zugravescu et al., 1989; Wilcock, 2001). Based on the recent positive studies by Tanaka et al. (2002, 2006) we reinvestigated the role of the earth tides on triggering earthquakes in Vrancea area , one of the most active seismic zones in Europe (Knapp et al., 2005). In this paper, we statistically test the significance level of the effect of the two semidiurnal components on in-termediate depth earthquakes in Vrancea (Table 1).
We applied the same Schuster’s statistical test which has been widely used in tidal triggering studies (Tanaka et al., 2002, 2006). A different approach based on the Permutation test was also introduced. It could extend statistical studies where Schuster’s test is not adequate. Validation of the con-clusions becomes more robust if both tests show similarities.
2 Method of analysis
A stacking analysis method named HiCum (Histogram Cu-mulating) (van Ruymbeke et al., 2003, 2007, Cadicheanu et al., 2006), is applied to compute the tidal potential phase angles of earthquakes. First, time based events are divided into a series of intervals with a priori selected constant riods T which could be any tidal component. This time pe-riod T is represented by an interval 1◦–360◦. Then the time base for each period is normalized as shown in Fig. 1. For
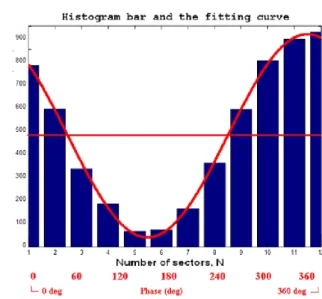
Fig. 2. A histogram bar model with 12 sectors, representing the
dis-tribution of the seismic activity or the average value of the parameter for each sector and the corresponding sinusoidal fitting curve.
each component, the original phase is fixed from astronomi-cal data. The event Ei occurred at time ti was characterized by the phase αi. For the selected tidal period T a histogram of events is established as a function of the αi. We divide histogram into S sectors with length equal to 360◦/S. The value of S is selected when a significant number of events in each sector could be obtained.
We modelled the interactions of tidal components and earthquake with a cosine function adjusted to the histogram. The amplitude and phase of the cosine show the links, in terms of modulation, between the stacked events and the cho-sen tidal components (Fig. 2). Two main tidal components were selected for this research: the solar semidiurnal wave S2 and the lunar semidiurnal wave M2.
3 Statistical tests
3.1 Schuster’s test
To begin, we statistically investigate the correlation be-tween the tidal components and earthquake occurrences us-ing Schuster’s test. This test is a classical approach, which has been applied in past (Heaton, 1975, 1982; Tsuruoka et al., 1995; Tanaka et al, 2002, 2006).
In Schuster’s test, each earthquake is represented by a unit length vector in the direction defined by its tidal phase angle αi which was introduced in the Fig. 1.
The vectorial sum D is defined as: D2=( N X i=1 cos αi)2+( N X i=1 sin αi)2, (1)
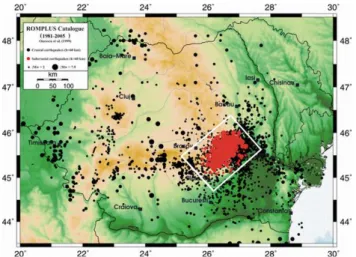
Fig. 3. The Vrancea earthquakes epicentres distribution (1981–
2005) from RomPlus Catalog provided by Institute of the Earth Physics of Bucharest.
Fig. 4. Vrancea intermediate-depth seismic activity from 1981 to
2005 (a 3-D view of the hypocenter distribution).
where N is the number of earthquakes. When the αi is dis-tributed randomly, the probability that the length of a vecto-rial sum is equal to or larger than D is given by Eq. (2):
ps=exp −D
2
N !
(2)
Thus, ps<5% represents the significance level at which the null hypothesis that the earthquakes occurred randomly with respect to the tidal phase is rejected.
To avoid the risk of spurious conclusions, which Schus-ter’s test could induce, we must confirm the conclusions’ ro-bustness by a different approach. Thus, we introduce another statistical test.
Fig. 5. Gravity theoretical values, (a) and (b), and the number of
earthquakes distributions, (c) and (d), as a function of M2 phase angle (black curves). The presence of aftershocks is tacked in ac-count only in (a) and (c) cases. The fitting curves corresponding to each distribution are in red colour.
Fig. 6. Gravity theoretical values, (a) and (b), and the number of
earthquakes distributions, (c) and (d), as a function of S2 phase an-gle (black curves). The presence of aftershocks is tacked in account only in (a) and (c) cases. The fitting curves corresponding to each distribution are in red colour.
3.2 Permutation tests
We choose the permutation test which is well-known among biologists and geneticists because it is always free to choose the statistic which best discriminates between hypothesis and alternative. Permutation tests also allow for calculating the probability (pp) of the significance level to reject the null hypothesis in which the distribution is random.
It is also called a randomization test, re-randomization test, or an exact test; it is one type of statistical signifi-cance test in which a reference distribution is obtained by
736 N. Cadicheanu et al.: Tidal triggering evidence
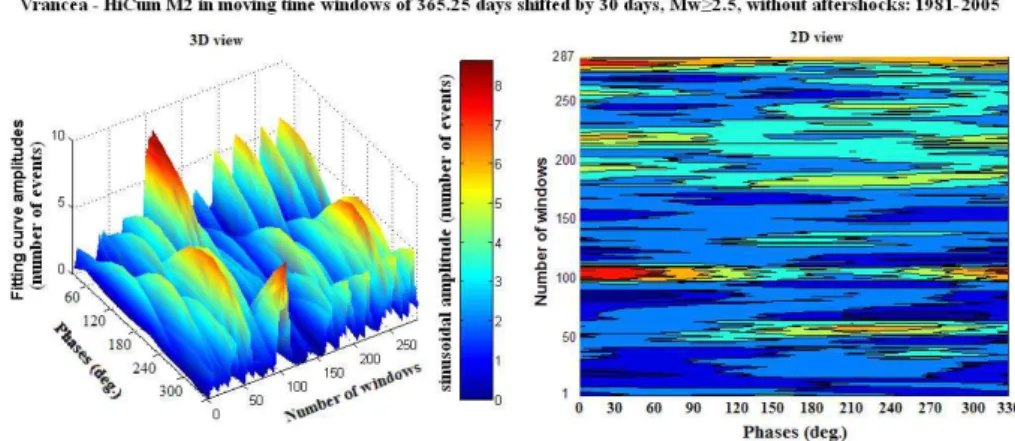
Fig. 7. The 3-D distribution of the HiCum fitting curves amplitudes expressed as the number of seismic events, and their corresponding 2-D
view. For the HiCum analysis the M2 wave period in sliding windows of one year, shifted by 30 days.
Fig. 8. The 3-D distribution of the HiCum fitting curves amplitudes expressed as the number of seismic events, and their corresponding 2-D
view. For the HiCum analysis the M2 wave period was used in sliding windows of one year, shifted by 30 days.
calculating all possible values by rearranging the labels on the observed data points.
In other words, the method is allocated to subjects in an experimental design that is mirrored in the analysis of that design. If the labels are exchangeable under the null hypoth-esis, then the resulting tests yield the exact significance lev-els. Then confidence intervals can be derived from the tests. The theory has evolved from the work of R. A. Fisher and E. J. G. Pitman (R. A. Fisher, 1935; E. J. G. Pitman, 1938). Permutation distribution is given by Eq. (3):
pp=( m X
l=0
Al)/r (3)
Amplitude A0 was obtained by a co-sinusoidal function
which was fit to the distribution of HiCum stacking results after we produce r random permutations distributions. We apply the HiCum on each permutation distribution and se-lect only those that are significant according to amplitudes Ai>A0(i=0, 1, 2. . . .m where m≤r).
If pp<5%, it represents the significance level at which re-ject the null hypothesis, i.e. that the earthquakes occur ran-domly with respect to the tidal phase angle.
Both tests are applied on the entire earthquake catalogue and on the one year windowed data (sliding by one month) from 1981 to 2005. The ps and pp–values are evaluated and compared.
4 Vrancea seismic zone
Earthquakes used in this study were selected from the RomPlus catalogue provided by the National Institute of Earth Physics, Bucharest. It contains nearly 3000 intermediate-depth earthquakes (Mw≥2.5) since 1981 to 2005 (Oncescu et al., 1999) (Fig. 3).
All epicentres are mainly located in a very narrow zone in the South-Eastern Carpathians (45◦–46◦N, 25.5◦–27.5◦E) at the intra-continental collision between the East European plate, Intra-alpine, and Moesian micro-plates (Ardeleanu,
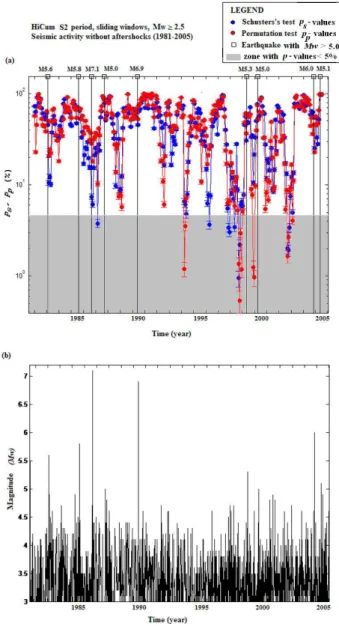
Fig. 9. (a) Temporal variation of the ps–value (blue) and pp–
value (red) in every sliding window for HiCum with an M2 pe-riod. The vertical bar represents the standard deviation of the ps
and pp–values. (b) Magnitude–time plot of the earthquake
occur-rences (Mw≥3.0). The aftershocks sequence was eliminated using the Kossobokov-Romashkova method.
1999). It is characterized by a prevailing intermediate depth seismicity which is in distinct confined volume (Bazacliu et al., 1999) (Fig. 4).
Important historical earthquakes happened on 10 Novem-ber 1940 (h=150 km, Mw=7.7), 4 March 1977 (h=94 km, Mw=7.4), 30 August 1986 (h=131 km, Mw=7.1), and 30 May 1990 (h=91 Km, Mw=6.9). These earthquakes reflect a predominantly compressive stress regime at this subcrustal range. The compressive tendency is becoming stronger with depth (Bala et al., 2003).
Earthquakes with Mw ≥5.0 from 1981 to 2005 are given
Fig. 10. (a) Temporal variation of the ps–value (blue) and pp–value
(red) in every sliding window for HiCum with S2 period. The ver-tical bar represents the standard deviation of the psand pp–values.
(b) Magnitude –time plot of the earthquake occurrences (Mw≥3.0).
The aftershocks sequence was eliminated using the Kossobokov-Romashkova method.
in Table 2. The aftershocks sequence was eliminated by the Kossobokov-Romashkova method1This method proposed a new way to characterize aftershocks according to a system-atic analysis of the earthquakes. It defined all quakes, which occurred in the following 2 d as aftershocks after an earth-quake with Mw from 2.5 to 5.0, 4 d for Mw from 5.0 to 5.5,
1Kossobokov, V. and Romashkova, L.: Re-establishing intermediate-term real-time prediction of strong earthquakes in the Vrancea region, CE-Project, Extreme Events: Causes and Conse-quences, Perugia 2–6 September, 2006.
738 N. Cadicheanu et al.: Tidal triggering evidence
Table 2. Intermediate–depth earthquakes in the Vrancea zone with Mw≥5.0 (1981–2005).
Year Month Day Hour Min Sec Lat.(deg) Long. (deg) Depth (km) Mag.(Mw) 1981 7 18 0 2 59 45.69 26.42 166.1 5.5 1983 1 25 7 34 50 45.75 26.64 149.8 5.6 1985 8 1 11 17 36 45.79 26.77 118.6 5.2 1985 8 1 14 35 4 45.73 26.62 93.5 5.8 1986 8 30 21 28 37 45.52 26.49 131.4 7.1 1987 9 4 1 40 30 45.68 26.43 160.2 5.0 1990 5 30 10 40 6 45.83 26.89 90.9 6.9 1990 5 31 0 17 48 45.85 26.91 86.9 6.4 1999 4 28 8 47 56 45.49 26.27 151.1 5.3 2000 4 6 0 10 39 45.75 26.64 143.4 5.0 2004 10 27 20 34 36 45.78 26.73 98.6 6.0 2005 5 14 1 53 22 45.68 26.54 148.3 5.1
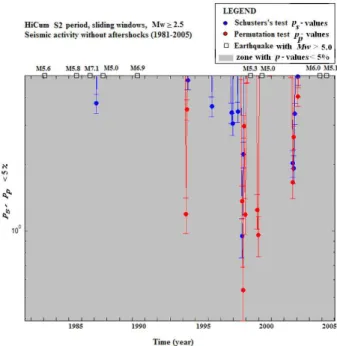
Fig. 11. HiCum M2 period: sliding windows in which psand pp–
values are 5% (18 values for pp coefficient and 20 values for ps
coefficient).
8 days for Mw from 5.5 to 6.0, 16 d for Mw from 6.0 to 6.5, 32 d for Mw from 6.5 to 7.0 and 64 d from 7.0 to 9.0.
After we analyzed the semidiurnal tidal effect on both cases with aftershocks (N =2992) and without aftershocks (2242), we found some larger aftershocks series could in-duce bias peaks in the distribution. To avoid this, we decided to consider the cases without aftershocks.
Fig. 12. HiCum S2 period: sliding windows in which psand pp–
values are <5% (11 values for ppcoefficient and 12 values for ps
coefficient).
5 Application and results
We studied mainly the semidiurnal tidal components because the gravitational tidal forcing is a force, which could affect the dynamic processing at such depths. In the tidal potential, M2 is the lunar principal wave with 12.42 h period and its amplitude is two times larger than the S2 which is the solar principal wave having a 12 h period.
We computed the M2 and S2 tidal phase angle of each earthquake (Mw≥2.5, focal depth >60 km) and attribute gravity values at the moment of earthquake occurrence which
gle. The dynamic patterns of tidal components were com-pared with the tendency of earthquake occurrence.
The same tendencies in the two cases are observed even if the aftershocks change the phase and the amplitude of the fitting curves (Figs. 5 and 6). This also changes the results of the two significance tests for a threshold at 5% (Table 3). There is one exception (S2 wave with aftershocks not elim-inated), the ps and pp–values are much greater than 5%. In these cases, the event distributions should be considered as random. It means that the processes induced by tidal trigger-ing have a non repetitive long term pattern. In order to evalu-ate the possible correlations between earthquake occurrence and the semidiurnal tidal wave in a shorter time interval, a sliding window algorithm was developed. We calculate the distribution of all events in the M2 and S2 cycles for a series of sliding windows with one year length where the sliding step is 30 d. There are 287 set distributions (Figs. 7 and 8) covering the entire sets of data (1981 to 2005).
Each distribution was evaluated by Shuster’s and Permu-tation tests. Figure 9 and Fig. 10 show that the ps and pp value for the two test results are very similar. The hypoth-esis becomes more convincing because the same conclusion is confirmed by two independent statistical methods.
When the ps and pp values are plotted in real time, a spatial pattern could be found both at the M2 and S2 cycle (Figs. 11 and 12), but obvious in M2 cycle (Fig. 11). The ps and ppvalues are decreasing until a large earthquake occurs. After that, the values go up, and then decrease before another large event happens. Similar phenomena were also reported in the study of the Tokai region earthquakes (Tanaka et al., 2006).
Future studies should focus on p value criteria, on the re-lation between spatial and magnitude patterns and the quake occurrence. It could be useful for detecting potential precur-sors for earthquake forecasting.
6 Conclusions
We analyzed the correlation between the main semidiurnal tidal waves and the earthquake occurrence. Two different statistical tests were applied on the M2 and S2 tidal phase an-gles’ distribution calculated from each event. The conclusion
sidered as a kind of precursor. The possible physical conse-quences of the tidal effect could constrain the research on the seismic source characteristics and their dynamical patterns.
We could imagine that for seismic zones, tidal modulation of fluid pressure is acting before the rupture process. Acknowledgements. We thank M. Radulian and M. Popa, the
National Institute for Earth Physics for providing the ROMPLUS catalogue. We are very grateful P. Hodor for the very useful discus-sions on the permutation test and on the software implementation. We would like to thank to the bilateral cooperation between Royal Observatory of Belgium and the Institute of Geodynamics of the Romania Academy for allowing us to optimize the conditions in which we could finalize our work. Thanks a lot to all the colleagues for their kind support to our project. We are grateful for the anony-mous reviewers for helpful comments, and English improvement by T. van Dam. Thanks M. Everaerts for his contributions.
Edited by: : M. Contadakis
Reviewed by: two anonymous referees
References
Ardeleanu, L.: Statistical Models of the Seismicity of the Vrancea Region, Romania, Natural Hazards, 19, 151–164, 1999. Bala, A., Radulian, M., and Popescu, E.: Earthquakes distribution
and their focal mechanism in correlation with the active tectonic zones of Romania, J. Geodyn., 36, 129–145, 2003.
Bazacliu, O. and Radulian, M.: Seismicity Variations in Depth and Time in the Vrancea (Romania) Subcrustal Region, Natural Haz-ards, 19, 165–177, 1999.
Cadicheanu, N., van Ruymbeke, M., Zugravescu, D., Everaerts, M. and Howard, R.: Periodical tendencies in Vrancea seismic activ-ity detected by the Hi-Cum stacking method, Rev. Roum. Geo-physique, 50, 31–57, 2006.
Curchin, J. M. and Pennington, W. D.: Tidal triggering of interme-diate and deep focus earthquakes, J. Geophys. Res. 92, 13 957– 13 967, 1987.
Enescu, D. and Enescu, B. D.: Possible cause – effect relationships between Vrancea (Romania) earthquakes and some global geo-physical phenomena, Natural Hazards, Kluwwer Academic Pub-lishers, 19, 233–245, 1999.
Fisher, R. A.: The Design of Experiment, New York: Hafner, 1935. Heaton, T. H.: Tidal triggering of earthquakes, Geophys. J. R.
740 N. Cadicheanu et al.: Tidal triggering evidence
Heaton, T. H.: Tidal triggering of earthquakes, Bull. Seismol.Soc. Am., 72, 2181–2200, 1982.
Knapp, H. J., Knapp, C., Raileanu, V., Matenco, L., Mocanu, V. and Dinu, C.: Crustal constraints on the origin of mantle seismicity in the Vrancea Zone, Romania: The case for active continental lithospheric delamination, Tectonophysics, 410, 311–323, 2005. Knopoff, L.: Earth tides as a triggering mechanism for earthquakes,
Bull. Seismol. Soc. Am., 54, 1865–1870, 1964.
Melchior, P.: The Tides of the Planet Earth, Pergamon Press, New York, 1978.
Oncescu, M. C., Marza, V. I., Rizescu, M., and Popa, M.: The Romanian Earthquake Catalogue between 984–1999, in Vrancea Earthquakes: Tectonics, Hazard and Risk Mitigation, edited by: Wenzel, F. and Lungu, D., and Novak, O., 43–47, Kluwer Aca-demic Publishers, Dordrecht, Netherlands, 1999 (Catalogue un-der continuous update).
Fisher, R. A.: The Design of Experiment, New York: Hafner, 1935. Pitman, E. J. G.: Significance tests which may be applied to sam-ples from any population, Part III: The analysis of variance test, Biometrika, 29, 322–335, 1938.
Rydelek, P. A., Sacks, I. S., and Scarpa, R.: On tidal triggering of earthquakes at Campi Flegrei, Italy. Geophys. J. Int., 109, 125– 137, 1992.
Shudde, R. H. and Barr, D. R.: An analysis of earthquake frequency data, Bull. Seismol. Soc. Am., 67, 1379–1386, 1977.
Schuster, A.: On lunar and solar periodicities of earthquakes, Proc. R. Soc. Lond., 61, 455–465, 1897.
Simpson, J. F.: Earth tides as a triggering mechanism for earth-quakes, Earth Planet. Sci. Lett., 2, 473–478, 1967.
Stavinschi, M. and Souchay, J.: Some correlations between Earth-quakes and Earth Tides, Acta Geod. Geoph. Hung., 38(1), 77–92, 2003.
Stroup, D. F.: Pulse of the seafloor: Tidal triggering of mi-croearthquakes at 9◦50′N East Pacific Rise, Geophys. Res. Lett.,
34(15), 2007.
Tanaka, S., Ohtake, M., and Sato, H.: Evidence for tidal triggering of earthquakes as revealed from statistical analy-sis of global data, J. Geophys. Res., 107(5B10), 2211, doi: 10.1029/2001JB001577, 2002.
Tanaka, S., Sato, H., Matsumura, S., and Ohtake, M.: Tidal trigger-ing of earthquakes in the subducttrigger-ing Philippine Sea plate beneath the locked zone of the plate interface in the Tokai region, Japan, Tectonophysics, 417, 69–80, 2006.
Tolstoy, M., Vernon, F. L., Orcutt, J. A., and Wyatt, F. K.: Breath-ing of the seafloor: tidal correlations of seismicity at Axial vol-cano,Geology, 30, 503–506, 2002.
Tsuruoka, H., Ohtake, M., and Sato, H.: Statistical test of the tidal triggering of earthquakes: contribution of the ocean tide loading effect, Geophys. J. Int., 122, 183–194, 1995.
van Camp, M. and Vauterin, P.: Tsoft: graphical and interactive software for the analysis of time series and Earth tides, Comput-ers in Geosciences, 31(5) 631–640, 2005.
van Ruymbeke, M., Zhu, P., Cadicheanu, N., and Naslin, S.: Very Weak Signals (VWS) detected by stacking method according to different astronomical periodicities (HiCum), Nat. Hazards Earth Syst. Sci., 7, 651–656, 2007,
http://www.nat-hazards-earth-syst-sci.net/7/651/2007/.
van Ruymbeke, M., Howard, R., P¨utz, P., Beauducel, F., Somer-hausen, A. and Barriot, J-P.: An Introduction to the use of HICUM for signal analysis, BIM 138, 10 955–10 966, 2003. Vidale, J. E., Agnew, D. C., Johnston, M. J. S., Oppenheimer, D.
H.: Absence of earthquake correlation with earth tides: an indi-cation of high preseismic fault stress rate, J. Geophys. Res., 103, 24 567–24 572, 1998.
Zugravescu, D., Enescu, D., Delion, D., Fatulescu, I., and Dorobantu, R.: Some correlations between the mechanism of Vrancea earthquakes occurrence and Earth tides, Rev. Roum. Geophys., 29, 1–34, 1985.
Zugravescu, D., Fatulescu, I., Enescu, D., Danchiv, D., and Haradja, O.: Peculiarities of the correlation between gravity and earth-quakes, Rev. Roum. Geophys., 33, 3–10, 1989.
Wilcock, W. S. D.: Tidal triggering of microearthquakes on the Juan de Fuca Ridge, Geophys. Res. Lett., 28, 3999–4002, 2001.