HAL Id: hal-00299118
https://hal.archives-ouvertes.fr/hal-00299118
Submitted on 16 Apr 2004
HAL is a multi-disciplinary open access
archive for the deposit and dissemination of
sci-entific research documents, whether they are
pub-lished or not. The documents may come from
teaching and research institutions in France or
abroad, or from public or private research centers.
L’archive ouverte pluridisciplinaire HAL, est
destinée au dépôt et à la diffusion de documents
scientifiques de niveau recherche, publiés ou non,
émanant des établissements d’enseignement et de
recherche français ou étrangers, des laboratoires
publics ou privés.
H. Apel, A. H. Thieken, B. Merz, G. Blöschl
To cite this version:
H. Apel, A. H. Thieken, B. Merz, G. Blöschl. Flood risk assessment and associated uncertainty.
Natu-ral Hazards and Earth System Science, Copernicus Publications on behalf of the European Geosciences
Union, 2004, 4 (2), pp.295-308. �hal-00299118�
SRef-ID: 1684-9981/nhess/2004-4-295
© European Geosciences Union 2004
and Earth
System Sciences
Flood risk assessment and associated uncertainty
H. Apel1, A. H. Thieken1, B. Merz1, and G. Bl¨oschl2
1GeoForschungsZentrum Potsdam (GFZ), Section 5.4 Engineering Hydrology, Telegrafenberg, 14473 Potsdam, Germany 2Institute of Hydraulics, Hydrology and Water Resources Management, Vienna University of Technology, Karlsplatz 13,
A–1040 Wien, Austria
Received: 30 September 2003 – Revised: 12 February 2004 – Accepted: 3 March 2004 – Published: 16 April 2004 Part of Special Issue “Multidisciplinary approaches in natural hazards”
Abstract. Flood disaster mitigation strategies should be
based on a comprehensive assessment of the flood risk com-bined with a thorough investigation of the uncertainties asso-ciated with the risk assessment procedure. Within the “Ger-man Research Network of Natural Disasters” (DFNK) the working group “Flood Risk Analysis” investigated the flood process chain from precipitation, runoff generation and con-centration in the catchment, flood routing in the river net-work, possible failure of flood protection measures, inunda-tion to economic damage. The working group represented each of these processes by deterministic, spatially distributed models at different scales. While these models provide the necessary understanding of the flood process chain, they are not suitable for risk and uncertainty analyses due to their complex nature and high CPU-time demand. We have there-fore developed a stochastic flood risk model consisting of simplified model components associated with the compo-nents of the process chain. We parameterised these model components based on the results of the complex determinis-tic models and used them for the risk and uncertainty analysis in a Monte Carlo framework. The Monte Carlo framework is hierarchically structured in two layers representing two different sources of uncertainty, aleatory uncertainty (due to natural and anthropogenic variability) and epistemic uncer-tainty (due to incomplete knowledge of the system). The model allows us to calculate probabilities of occurrence for events of different magnitudes along with the expected eco-nomic damage in a target area in the first layer of the Monte Carlo framework, i.e. to assess the economic risks, and to de-rive uncertainty bounds associated with these risks in the sec-ond layer. It is also possible to identify the contributions of individual sources of uncertainty to the overall uncertainty. It could be shown that the uncertainty caused by epistemic sources significantly alters the results obtained with aleatory uncertainty alone. The model was applied to reaches of the river Rhine downstream of Cologne.
Correspondence to: H. Apel
(hapel@gfz-potsdam.de)
1 Introduction
Flood defence systems are usually designed by specifying an exceedance probability and by demonstrating that the flood defence system prevents damage from events corresponding to this exceedance probability. This concept is limited by a number of assumptions and many researchers have called for more comprehensive design procedures (Plate, 1992; Bowles et al., 1996; Berga, 1998; Vrijling, 2001). The most complete approach is the risk-based design approach which balances benefits and costs of the design in an explicit manner (Stew-art and Melchers, 1997). In the context of risk-based design, the flood risk consists of the flood hazard (i.e. extreme events and associated probability) and the consequences of flooding (i.e. property damages). Ideally, a flood risk analysis should take into account all relevant flooding scenarios, their associ-ated probabilities and possible damages as well as a thorough investigation of the uncertainties associated with the risk ana-lysis. Thus, a flood risk analysis should finally yield a risk curve, i.e. the full distribution function of the flood damages in the area under consideration, ideally accompanied by un-certainty bounds.
Following these concepts the working group “Flood Risk Analysis” of the German Research Network on Natural dis-asters (DFNK) investigated the complete flood disaster chain from the triggering event to its consequences: “hydrolog-ical load – flood routing – potential failure of flood pro-tection structures – inundation – property damage”. For each element, complex, spatially distributed models were applied, representing the meteorological, hydrological, hy-draulic, geo-technical, and socio-economic processes (Men-zel et al., 2004; Disse et al., 2004; Holz and Merting, 2004; Grothmann and Reusswig, 2004). These complex models were complemented by a simple stochastic model consist-ing of modules each representconsist-ing one process of the flood disaster chain. Each module is a simple parameterisation of the corresponding more complex deterministic model, where the parameterisations and parameters are calibrated against the data and results of the corresponding complex models.
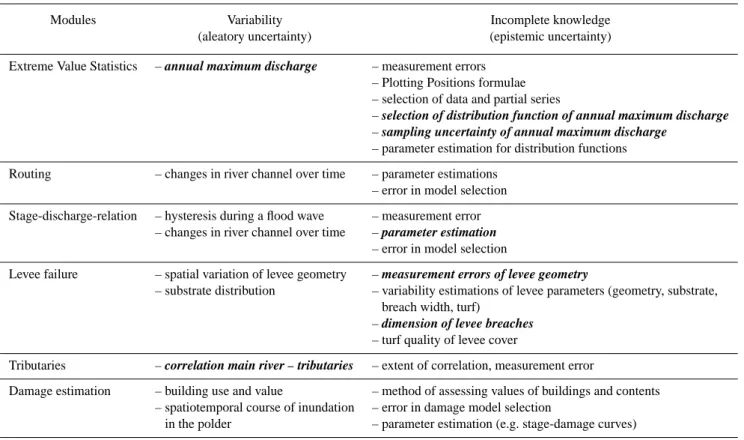
Table 1. Sources of uncertainty in the model system separated into aleatory and epistemic uncertainty. Sources printed in plain bold face
are considered in the Monte-Carlo-Framework for the risk and uncertainty analysis. Sources in italic bold face are considered in scenario calculations.
Modules Variability Incomplete knowledge
(aleatory uncertainty) (epistemic uncertainty) Extreme Value Statistics – annual maximum discharge – measurement errors
– Plotting Positions formulae – selection of data and partial series
– selection of distribution function of annual maximum discharge – sampling uncertainty of annual maximum discharge
– parameter estimation for distribution functions Routing – changes in river channel over time – parameter estimations
– error in model selection Stage-discharge-relation – hysteresis during a flood wave – measurement error
– changes in river channel over time – parameter estimation – error in model selection
Levee failure – spatial variation of levee geometry – measurement errors of levee geometry
– substrate distribution – variability estimations of levee parameters (geometry, substrate, breach width, turf)
– dimension of levee breaches – turf quality of levee cover
Tributaries – correlation main river – tributaries – extent of correlation, measurement error
Damage estimation – building use and value – method of assessing values of buildings and contents – spatiotemporal course of inundation – error in damage model selection
in the polder – parameter estimation (e.g. stage-damage curves)
This ensures that the two approaches (simple probabilistic and complex deterministic) are compatible at all steps of the process chain.
The advantages of the simple approach are numerous. First, significantly less CPU time is needed which allows ap-plication of the approach in Monte Carlo simulations. Sec-ond, the simple approach involves fewer parameters, so pa-rameter estimation is more straightforward and robust. Third, the simpler model structure makes it easier for the analyst to understand the main controls of the systems. However, these advantages come at the expense of omitting some of the sub-tleties of the flood disaster chain.
The simple stochastic model represents two fundamentally different types of uncertainty, aleatory and epistemic uncer-tainty. Aleatory uncertainty refers to quantities that are inher-ently variable over time, space, or populations of individuals or objects. According to Hall (2003) it can be operationally defined as being a feature of populations of measurements that conform well to a probabilistic model. Epistemic un-certainty results from incomplete knowledge of the object of investigation and is related to our ability to understand, measure, and describe the system under study. Aleatory uncertainty has also been termed variability, objective un-certainty, stochastic unun-certainty, stochastic variability, inher-ent variability, randomness and type-A uncertainty. Terms for epistemic uncertainty are subjective uncertainty,
lack-of-knowledge or limited knowledge uncertainty, ignorance, specification error and type-B uncertainty (Morgan and Hen-rion, 1990; Plate, 1992, 1993a; Hoffmann and Hammonds, 1994; NRC, 1995, 2000; Ferson and Ginzburg, 1996; Zio and Apostolakis, 1996; Haimes, 1998; Cullen and Frey, 1999; van Asselt and Rotmans, 2002).
The simple stochastic model allows the risk and uncer-tainty analysis through a Monte Carlo framework. In line with the distinction of aleatory and epistemic uncertainties, the Monte Carlo framework has been hierarchically struc-tured, with each of the two layers representing one of the two types of uncertainties (two-dimensional or second-order Monte Carlo simulation, Cullen and Frey, 1999). The first layer represents aleatory uncertainty and assumes that the variability of the system is perfectly known and correctly quantified, e.g. by known parameter distributions. The result of this first layer of Monte Carlo simulation is a risk curve for the target area. The second layer of Monte Carlo simulations represents the uncertainty caused by our incomplete knowl-edge of the system. The extent of the knowlknowl-edge may range from some knowledge about the type of variability where ab-solute figures are unknown, to a complete lack of knowledge on parts of the system.
This distinction into the two uncertainty classes has important implication for the results of the risk assessment. The uncertainty bounds derived by this method cannot be
interpreted as steady-state and may narrow down as more knowledge about the processes and parameters under of the model is obtained. This is because epistemic uncertainty can certainly be decreased by an increase in knowledge, while aleatory uncertainty is inherent to the system and cannot be reduced by more detailed information (Ferson and Ginzberg, 1996).
However, the feasibility of separating aleatory and epis-temic uncertainty and the use of second-order Monte Carlo-simulations are subject of an ongoing debate within the sci-entific community. While there are several risk analysis stud-ies using or recommending it (Hoffmann and Helton, 1994; Cohen et al., 1996; USEPA, 1997; Cullen and Frey, 1999), others challenge the suitability of probability theory for deal-ing with epistemic uncertainty (Ferson and Ginzburg, 1996; Hall et al., 1998; Hall, 2003). They argue that evidence the-ory (Shafer, 1987) provides a more adequate approach. (A good review of these two types of uncertainty and of mathe-matical treatment is given in the special issue of the Journal of Reliability Engineering and Systems Safety, Helton and Burmaster, 1996).
Identifying the uncertainty sources and assigning them to the two classes may be difficult as in some cases a clear dis-tinction between natural variability and lack-of-knowledge is unclear because of our incomplete understanding of the sys-tem. Table 1 lists the uncertainty sources we deemed rele-vant for our proposed risk assessment methodology. How-ever, in this case study we incorporated only some uncer-tainty sources to exemplify the approach. As other studies indicate, the major uncertainty source in flood risk assess-ment has to be expected in the extreme value statistics (Merz et al., 2002). Consequently the uncertainty analysis has its main focus on this part of the modelling system. Further considered uncertainty sources are those associated with the levee failure module, the correlation of the main river and tributaries, the damage estimation and the stage-discharge-relation (rating curve). They are printed in bold in Table 1. The other listed sources of uncertainty are excluded in this study.
However, because of the dominance of the extreme value statistics in the uncertainty analysis the exclusion of most of these sources is justifiable, i.e. they are of low importance as opposed to the large uncertainties caused by the extreme value statistics (see Sect. 5). Also, the uncertainties that may result from the use of the simple statistical models instead of the complex models are not considered. Due to the fact that the simple models are calibrated against the complex model results the errors are minimised and hence neglectable. Disse et al. (2004) illustrate the calibration and the model deviation in case of polder inundation and outflow through the levee breach.
In this paper, the feasibility of this modelling approach combined with the hierarchical uncertainty analysis is illus-trated for a reach of the river Rhine in Germany.
Lippe
R
hin
e
Ruhr
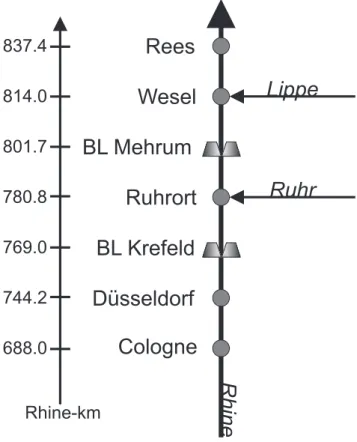
Fig. 1. Schematic layout of the reaches of the Rhine investigated in
this paper.
1.1 Investigation area
As a target area, the reach of the Rhine between Cologne and Rees was selected with a focus on the polder at Mehrum (Fig. 1). The polder at Mehrum is a confined rural area of 12.5 km2, which is only inundated if the protecting levee sys-tem fails.
The model considers the following elements of the flood disaster chain: hydrological load, flood routing between the gauges Cologne and Rees, tributary inflow from the rivers Ruhr and Lippe, levee performance at two locations (Krefeld, Mehrum) and damage in the flooded areas of the polder Mehrum (Fig. 1).
The two levee breach locations selected for the simulation differ significantly in their storing capacity. At Krefeld the large unbounded hinterland provides a retention basin with a practically infinite retention capacity whereas the polder at Mehrum is strictly confined to a comparatively small vol-ume. The levees at the two breach locations are similar, but at Mehrum the levee crest is higher, i.e. larger flood waves are required to overtop the levee at Mehrum as compared to Krefeld.
2 Modules
The risk analysis for the flood disaster chain is based on the following modules:
100 101 102 0 0.2 0.4 0.6 0.8 1 1.2 1.4 1.6 1.8 2x 10 4 T [a] Q [m 3/s] Plotting Positions Gumbel LogNorm Weibull Pearson3 composite
Fig. 2. Different distribution functions fitted to the annual
maxi-mum flood series 1961–1995 of the gauge Cologne/Rhine.
• Hydrological load
• Flood routing
• Levee failure and outflow through levee breach
• Damage estimation
Both for the risk and the uncertainty analyses, these mod-ules are embedded in a Monte Carlo framework (MC-framework). The following sections describe the modules briefly, followed by an extensive description of the MC-framework in Sect. 3. More details are given in Apel et al. (2004).
2.1 Hydrological load
The hydrological load was derived from the flood frequency curve of the gauge Cologne/Rhine based on the annual max-imum series from 1961 to 1995 (AMS 1961–1995). Four distribution functions were fitted to the AMS 1961–1995: Gumbel, Lognormal, Weibull and the Pearson-III distribu-tion. The four distribution functions were weighted by a Maximum Likelihood method to construct a composite prob-ability distribution function f (Wood and Rodr´ıguez-Iturbe, 1975):
This method gave the following weights θi for the individual
distributions and AMS 1961–1995: Gumbel: θ1=0.0743
Lognormal: θ2=0.1525
Weibull: θ3=0.3270
Pearson III: θ4=0.4462
Figure 2 shows the four individual distributions and the composite distribution as well as their agreement with the empirical exceedance probabilities of the observed data (AMS 1961–1995) which were estimated by Weibull plotting positions. For extreme discharges the composite distribution function approximates a mean function of all distributions.
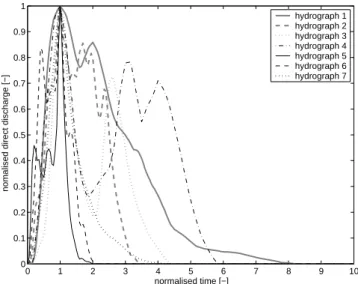
0 1 2 3 4 5 6 7 8 9 10 0 0.1 0.2 0.3 0.4 0.5 0.6 0.7 0.8 0.9 1 normalised time [−]
nomalised direct discharge [−]
hydrograph 1 hydrograph 2 hydrograph 3 hydrograph 4 hydrograph 5 hydrograph 6 hydrograph 7
Fig. 3. Non-dimensional clustered hydrographs of direct runoff
from 35 annual maximum events at the gauge Cologne (Rhine) (AMS 1961–1995).
In order to determine the occurrence of the levee breaches and the inundation levels of the polders it was necessary to generate flood hydrographs in addition to the maximum dis-charge. Hence typical flood hydrographs were generated for the gauge Cologne based on non-dimensional hydrographs in combination with cluster analysis. For each flood event of the series AMS 1961–1995 a non-dimensional hydrograph representing direct runoff was calculated as follows (Dyck and Peschke, 1995):
– Baseflow QB was separated from total observed runoff
Qassuming a linear baseflow hydrograph between the beginning and the end of direct runoff.
– The direct peak flow QDmaxand the time to peak tQDmax were determined.
– The hydrograph of the direct runoff QD was normalised
by
QDnorm=QD/QDmax (direct runoff) (1)
tnorm=t /tQDmax (time) (2)
so that the scaled direct peak flow is unity at time 1. The non-dimensional hydrographs of direct runoff of the AMS 1961–1995 were finally scaled to a consistent duration of tnorm=10 and then clustered using the “Average Linkage
between Groups” algorithm and Euclidian distances. The results of this cluster analysis are seven types of typ-ical, realistic hydrographs: single peaked hydrographs and various multiple peaked hydrographs (Fig. 3). Table 2 sum-marises the characteristics of these hydrographs, which are the mean values from the rescaled dimensional hydrographs belonging to each cluster. Within the Monte Carlo frame-work (see Sect. 3) the non-dimensional hydrographs were
Table 2. Mean parameters (peak flow, time to peak, baseflow) of direct runoff hydrographs for each cluster at stream gauge Cologne (Rhine).
Hydrograph Probability Peak flow Time to peak Flood duration Initial baseflow Final baseflow
QDmax tQDmax t QBi QBf ( ) (m3/s) (h) (h) (m3/s) (m3/s) 1 0.086 4750.0 152 864 1399 2100 2 0.057 5730.0 324 1044 1535 2150 3 0.028 7600.0 192 840 1270 1990 4 0.028 7290.0 144 840 2480 2680 5 0.200 7190.0 716 1145 1492 2163 6 0.086 7063.3 512 992 1997 2590 7 0.515 6420.6 257 726 1649 2072
rescaled using the flood frequency statistics at Cologne and the parameters in Table 2.
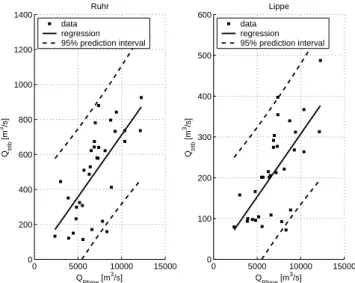
Since the major tributaries of the selected reach, Lippe and Ruhr, were also considered in the model, their maximum dis-charges and the shape of their hydrographs had to be deter-mined, too. The peak discharges in the main river (gauge Cologne, Rhine) and the discharges of the corresponding events in the tributaries (gauge Schermbeck I (Lippe) and gauge Hattingen (Ruhr)) in the AMS 1961–1995 are corre-lated and their relationship is approximately linear (Fig. 4). Therefore, peak discharges at the tributaries were gener-ated based on linear regressions and the correlations between main river and tributaries (cf. Sect. 3). The mean shapes of the hydrographs in the tributaries were determined for each cluster in Table 2, i.e. the hydrographs of the tributaries cor-responding to those at the main river were identified. This means that the time lags between the peak discharges of the tributaries and the main river are fixed for each correspond-ing hydrographs.
2.2 Flood routing
The second module of the flood disaster chain is a routing module consisting of the Muskingum routing method for flood waves in river channels (Maidment, 1992). The re-quired parameters, travel time K and shape parameter m, were estimated for the defined river reaches from the 35 flood events of the years 1961–1995, which were simulated using a 1-dimensional, non-stationary hydrodynamic model SOBEK (Disse et al., 2004). The travel times for the reaches were calculated as the mean travel times K of the peak discharges between the gauging stations, whereas the form parameter m was estimated from the complete flood waves using the Least Squares method.
2.3 Levee failure
In this case study we defined two levee breach locations and derived probabilities of breaches for these two points. Hence the failure probabilities are estimates of levee failure at a
cer-tain point, representing the measurement error of the levee geometry. The spatial variability of the levee geometry and the length effect of different long river stretches on the failure probability are not considered in this study.
For the calculation of the (point-)failure probability of a levee, a general engineering technique was applied in which a breach condition is defined as the exceedance of a load fac-tor over a resistance facfac-tor. This concept was applied to levee failures caused by overtopping of the levee crest which is the most common failure mechanism of modern zonated levees. The breach criterion was defined as the difference qD(m3/s)
between the actual overflow qa(m3/s) (the load factor) and
the critical overflow qcrit(m3/s) (the resistance factor):
if qa> qcrit →breach (3)
or
if qD>0 → breach
For the calculation of qa and qcrit the approaches of
Ko-rtenhaus and Oumeraci (2002) and Vrijling (2000) were used, respectively. These are based on overtopping height
dhand overflowing time teas independent variables and on
the geometry of the levees. The only non-geometric param-eter used in this formulae is the turf-quality paramparam-eter f g (Vrijling 2002), which is of subjective nature and hence was given particular attention in the uncertainty calculations (cf. Sect. 3).
From this intermediate complex deterministic model a probabilistic model representing the conditional failure prob-ability depending on overtopping height and time was de-rived. In order to calculate the failure probability, the con-ditional levee failure curves method (USACE, 1999) was ex-tended in this paper. Since the definition of the failure crite-rion in Eq. (3) contains two independent variables, dh and te,
it was necessary to construct a conditional failure probabil-ity surface instead of a one-dimensional failure curve. The derivation of the conditional failure surface for each breach location comprises the following steps:
– Describe the epistemic uncertainty of the parameters
0 5000 10000 15000 0 200 400 600 800 1000 1200 1400 QRhine [m3/s] Qtr ib [m 3/s] Ruhr 0 5000 10000 15000 0 100 200 300 400 500 600 QRhine [m3/s] Qtr ib [m 3/s] Lippe data regression 95% prediction interval data regression 95% prediction interval
Fig. 4. Linear regressions between maximum discharge of the Rhine (gauge Cologne) and maximum discharge of the tributaries Ruhr (gauge Hattingen) and Lippe (gauge Schermbeck I) of the corresponding events plotted along with the 95% prediction inter-vals for annual maximum series AMS 1961–1995 of the Rhine at gauge Cologne.
qa−qcrit, i.e. estimates of mean values, standard
devi-ations or coefficients of variation and distribution types. Estimates of these moments can be found in Vrijling (2000) and were used here.
– Perform a Monte Carlo simulation using a fixed pair of
(dh, te) to calculate the failure criterion. In this step,
104MC-samples per pair of independent variables were simulated.
– Calculate the moments of the distribution of the levee
failure criterion for the fixed pair of (dh, te) estimated
by the MC-simulation and identify an appropriate dis-tribution type.
– Read the probability of exceedance of the breach
crite-rion qa−qcrit=0 from the cumulative distribution of
the MC-simulation result. This is the failure probability of the levee for a given overflow height dh after a given duration te.
– Repeat the procedure for other pairs of (dh, te)
– Construct the failure surface from the failure
probabili-ties of the (dh, te)–tuples.
Figure 5 shows the resulting failure probability surface for the breach location Krefeld as an example. Because of a lack of information about the mean, variability and distribution of the turf quality parameter f g the failure surfaces were calcu-lated for different fixed values of f g according to the scenar-ios defined in Sect. 3.
The outflow through a levee breach is calculated from an empirical outflow formula presented in Disse et al. (2004).
2 4 6 8 10 0 0.05 0.1 0.15 0.2 0 0.2 0.4 0.6 0.8 1 dh [m] te [h] P [ ]
Fig. 5. Levee failure probability surface for breach location Krefeld
with turf quality parameter f g = 1.05.
This formula is based on the standard weir formula of Poleni using empirical relationships between the weir co-efficient and geometric and hydromechanic parameters of the levee and the river. These relationships were calibrated for the Lower Rhine at the selected breach locations, using the 2-dimensional breach outflow simulations performed by Holz and Merting (2004). From this formula it was possible to calculate the outflow through a levee breach as a function of the water levels of river and polder as well as the breach dimensions. However, for the temporal and spatial breach development at the two breach locations no functional re-lationship could be found due to the very complex breach mechanism and the high variability in the factors influencing the breach development (Singh, 1996). We therefore treated the breach dimension as an uncertainty source in the uncer-tainty analysis.
2.4 Damage estimation
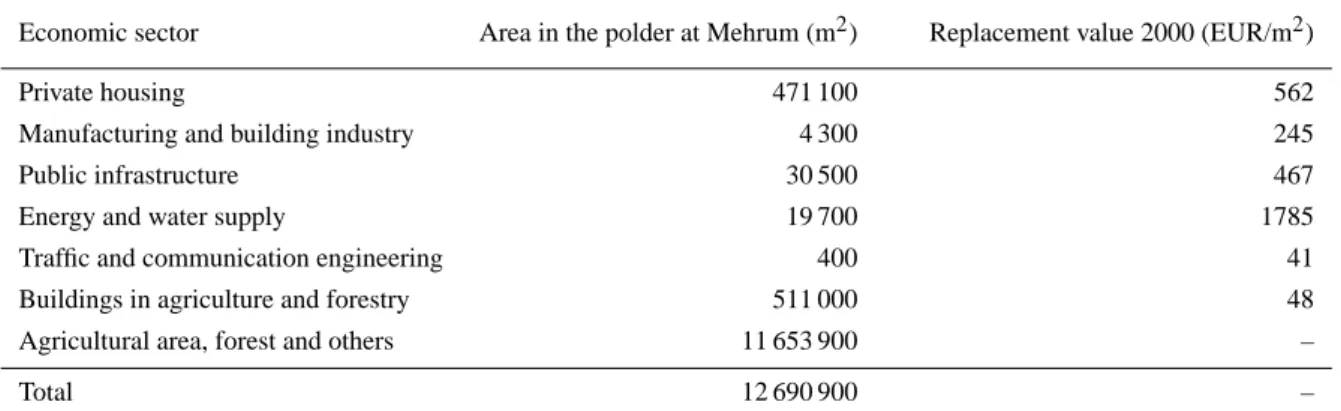
The last module estimates direct monetary losses within the polder at Mehrum. Flood damage can only occur if the levee system at Mehrum fails. Since the size and location of the in-undated areas are not estimated directly by the simple model presented here, a damage function that relates the damage in the inundated areas of the polder at Mehrum to the inflow of water volume after/during a levee failure had to be deter-mined. This was done by assuming the filling of the polder in 0.5 m steps up to the levee crest and intersecting each undation layer with the land use map. The damage of the in-undated land use types was estimated by combining assessed replacement values and stage-damage curves:
Dsec=AI Nsec·dsec(h) · V (4)
where:
Dsec: total direct property damage per economic
Table 3. Spatial extent and economic value per sector in the polder at Mehrum.
Economic sector Area in the polder at Mehrum (m2) Replacement value 2000 (EUR/m2)
Private housing 471 100 562
Manufacturing and building industry 4 300 245
Public infrastructure 30 500 467
Energy and water supply 19 700 1785
Traffic and communication engineering 400 41
Buildings in agriculture and forestry 511 000 48
Agricultural area, forest and others 11 653 900 –
Total 12 690 900 –
AI Nsec: inundated area per economic sector (m2),
dsec(h): average property damage per economic sector as a
function of the inundation depth (–),
vsec: sector-specific replacement value (EUR/m2)
For all sectors, with the exception of private housing, sector-specific replacement values were determined from the eco-nomic statistics of North Rhine-Westphalia from 1997 (data of the gross stock of fixed assets according to the sys-tem of national accounts from 1958 and land use informa-tion from the statistical regional authorities in North Rhine-Westphalia). The replacement values were scaled to the year 2000 by data on the development of gross stock of fixed assets in North Rhine-Westphalia (1995: 100; 1997: 102.8; 2000: 108.2) and adjusted to Mehrum by comparing the gross value added per employee in that region with that of en-tire North Rhine-Westphalia. Values in the sector of private housing were assessed by the number of buildings, house-holds and cars in the target area and their respective average insured capital in 2000. Appropriate data were provided by the German Insurance Association. All replacement values for Mehrum are summarized in Table 3.
The distribution of the economic sectors (industry, pri-vate housing, infrastructure etc.) within the polder at Mehrum was given by a land register – the German official topographic-cartographic information system ATKIS (Ta-ble 3). This analysis yields a total value of 340×106EUR for the assets (buildings and contents) in the polder at Mehrum.
The average property damages per economic sector
dsec(h)depend on the inundation depth. Stage-damage
func-tions were derived in accordance with MURL (2000). Dam-age was determined per inundated grid cell using Eq. (4). The total damage of a scenario amounts to the sum of the damages of all grid cells. The resulting relationship between inflow volume and property damage in the polder at Mehrum based on a step-by-step replenishment of the polder is shown in Fig. 6. With the used stage-damage curves a maximum damage of 120×106EUR may occur which amounts to 35%
of the estimated values.
0 20 40 60 80 100 120 140 0 20 40 60 80 100 120 Inflow volume [m ] T o ta l property damage [ ]
horizontal replenishment of the polder, 0.5 m steps spatiotemporal inundation simulations of Disse et al. (2004)
x 106
x 106
Fig. 6. Direct property damage within the polder at Mehrum as a
function of the inflow volume after/during a levee failure.
The curves so estimated were compared to damage es-timates based on space-time patterns of inundation after a levee failure at Mehrum simulated by Disse et al. (2004). Figure 6 shows that our results are very similar to those of the more detailed analysis of Disse et al. (2004).
3 Risk and uncertainty calculation
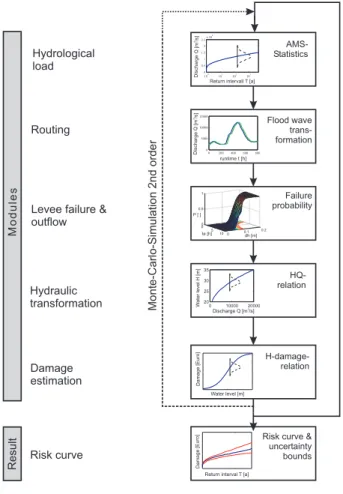
For the risk and uncertainty analysis a hierarchical Monte Carlo framework was developed. In the first level of the analysis the Monte Carlo simulations represent the variabil-ity of the system, i.e. the aleatory uncertainty. This results in frequency distributions of floods at the outlet of the investi-gation area and risk curves for the target area, the polder at Mehrum. We randomised the following variables in the first level:
– the annual maximum discharge of the Rhine,
– the correlation of the maximum discharge of the Rhine
with the tributaries Ruhr and Lippe and
The second level of Monte Carlo simulations represents the uncertainty associated with the results of the first level. In
AMS-Statistics
Return intervall T [a]
Discharge Q [m /s] 3 100 101 102 103 0 0.5 1 1.5 2 2.5x 10 4 runtime t [h] Discharge Q [m /s] 3 Flood wave trans-formation Failure probability HQ-relation 0 10000 20000 20 25 30 35 W ater level H [m] Discharge Q [m /s]3 H-damage-relation Water level [m] Damage [Euro]
Return interval T [a]
Damage
[Euro]
Risk curve & uncertainty bounds Modules Result M o n te -C a rlo -S im u la tio n 1 st o rd e r M o n te -C a rl o -S im u la ti o n 2 n d o rd e r 0 200 400 600 800 0 5000 10000 15000 Hydrological load Routing
Levee failure & outflow Hydraulic transformation Damage estimation Risk curve 0 5 100 0.1 0.2 0 0.5 1 P [ ] te [h] dh [m]
Fig. 7. Schematic of the risk and uncertainty calculations.
this level, uncertainty distributions of the flood frequency distributions and risk curves were calculated and used to con-struct the confidence bounds.
However, it was not possible to include all uncertainty sources as for some of them not sufficient information was available to formulate them in a realistic way. These uncer-tainty sources include the width of a levee breach after a levee failure and the turf quality parameter involved in the calcula-tion of the probability of failure. In these two cases statistics such as mean values, coefficients of variation and distribu-tion types were not available. Because of this, the width of the breach and the turf parameter were not incorporated in the MC-framework but examined in scenario calculations. The scenarios apply to both levels of MC-simulations.
3.1 Risk analysis
The 1st level of the MC-simulation was conducted in the fol-lowing steps: First, a discharge value was randomly chosen from the composite flood frequency curve at Cologne. Next, the flood type was randomly chosen according to the like-lihood of the flood types identified by the cluster analysis (cf. Table 2). From discharge and flood type, a flood wave was constructed and then routed to the final gauge at Rees, with tests for levee breaches at Krefeld and Mehrum. The discharge was increased by discharges from the tributaries
Ruhr and Lippe, which were calculated on the basis of the main river – tributary regressions shown in Fig. 5. In order to simulate the correlations between the main and tributary discharges, the tributary discharge was randomised for any given main river discharge assuming a normal distribution with mean values calculated from the regression equations and standard deviations calculated from Eq. (5):
σt rib cor =σt rib
q
1 − ρ2i (Cullen and Frey, 1999) (5) where ρi denotes the correlation coefficients. The
ran-domised tributary discharges were adjusted to base flow in case the randomised discharges were smaller than base flow. Using this procedure it was possible to represent both the functional relationships between main and tributary dis-charges as expressed in the regression equation and the vari-ability in the relationship as expressed in the correlation co-efficients. By this procedure the exposure of the polder Mehrum to flooding was quantified.
In a next step the vulnerability of the target area as ex-pressed by the damage curve (Fig. 6) was combined with the exposure in order to assess the flood risk. By this pro-cedure floods with an associated probability of occurrence were transformed into direct property damage. By repeat-ing this procedure 105times, the distribution function of in-put discharge at Cologne was transformed into a distribution function of property damage at the polder at Mehrum. This distribution was plotted as a risk curve which represents the exceedance probability of events expressed in return intervals associated with a damage exceeding a given level. Figure 7 gives a schematic of the procedure.
3.2 Uncertainty analysis
To account for the uncertainties of the spatial breach de-velopment (Sect. 2.3), the procedure described above was performed for four different breach width scenarios termed K100, K200, K300 and K400 with breach widths of 100 to 400 m at Krefeld, combined with three scenarios setting the turf quality parameter f g to 0.7, 1.05 and 1.4, respectively. The breach width scenarios are defined in accordance of ex-pert knowledge of the governmental authorities responsible for the construction and care of the levee systems. Accord-ing to their assessment 100 to 400 m is the range of widths to be expected in case of levee breaches at the lower Rhine. The range of f g is consistent with that given in Vrijling (2000), who quantified “poor” turf quality with 0.7 and “good” with 1.4. The quantification is based on studies of Hewlett et al. (1987). In addition to the breach scenarios, a scenario without a breach at Krefeld, K0, was defined in order to fully assess the effect of upstream breaches on the risk at Mehrum. For all scenarios, the same set of randomised maximum dis-charges and flood types for the main river Rhine and the trib-utaries was used in order to isolate the effect of breach widths at Krefeld on the failure probabilities at Mehrum.
In each scenario we estimated uncertainty distributions for selected return intervals by a 2nd level of Monte Carlo
1.1 5 20 100 500 2000 10000 0.5 1 1.5 2 2.5 3 x 10⁴ 0 0.05 0.1 0.15 0.2 0.25 Q [m3/s] T [a] P [ ]
Fig. 8. Empirical uncertainty distributions of discharge for different
return intervals T as used in the uncertainty analysis.
simulations, randomising the discharge given by the four dis-tribution functions for the defined return intervals, the stage discharge relationship at the potential levee failure sites and using the conditional levee failure probabilities derived in Sect. 2.3 (cf. Table 1). For randomising the discharge given by the four distributions the following procedure was used:
1. First, confidence intervals for each of the distribution functions were calculated from which standard devi-ations were derived for each selected return interval (Maidment, 1992; Plate, 1993b).
2. A set of 104 discharge values were randomly chosen from the distributions for every selected return interval
T assuming a standard distribution with values of the composite distribution as mean and standard deviations as calculated in point 1. The number of samples per dis-tribution were set according to the disdis-tribution weights (cf. Sect. 2.1).
3. From this set of discharges empirical cumulated proba-bilities were calculated.
4. Based on the empirical cumulated probabilities of dis-charges for each return interval T the samples for the uncertainty distributions were drawn.
Figure 8 shows the empirical distributions derived by this method for different return intervals T . The figure clearly shows that at large return intervals the spread of the uncer-tainty distribution is large indicating that the four distribu-tion funcdistribu-tions of the AMS give markedly different values (cf. Fig. 2).
The procedure for the stage-discharge-relationship was similar. First, confidence intervals for the three parameter estimates of the polynomial function representing the stage-discharge-relationship were calculated. For the randomisa-tion a normal distriburandomisa-tion was assumed with the mean equal
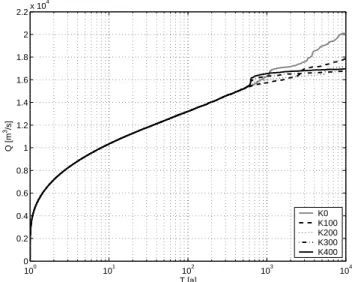
100 101 102 103 104 0 0.2 0.4 0.6 0.8 1 1.2 1.4 1.6 1.8 2 2.2x 10 4 T [a] Q [m 3/s] K0 K100 K200 K300 K400
Fig. 9. Frequency curves at the outlet of the investigation area (Rees
at the Rhine): scenarios of different breach widths, f g = 1.05.
to that of the parameter estimates and the variance taken from the confidence intervals.
In order to reduce CPU-time, a Latin Hypercube sampling scheme with 40 equally spaced intervals and median interval selection was applied for every selected return interval T in this calculation. From the uncertainty distributions, a 95% confidence interval was calculated for every T .
4 Results
4.1 Risk analysis
The results of the 1st level of Monte Carlo simulations for the 12 scenarios are summarised in Table 4. Without any upstream breaches (K0), the levee at Mehrum failed up to 99 times (failure rate 0.99‰) in the Monte Carlo simula-tions. When breaches at Krefeld were allowed, this figure was significantly reduced to only one failure of the levee at Mehrum in the case of a breach width of 400 m at Krefeld irrespective of the value of the turf parameter f g (Table 4). In addition to the breach width at Krefeld, the turf quality has an important effect on the number of breaches. The lower is the turf quality the higher is the number of breaches at both locations.
The flood frequency curve at Rees, the most downstream gauging station of the reach examined here (Fig. 1), is also influenced by the number of upstream levee breaches and the breach width at Krefeld. Figure 9 shows the flood fre-quency curves at Rees derived from the output of the routing module for a fixed turf quality and varying breach widths at Krefeld. The return intervals associated with discharges larger than the critical discharge required for levee breaches change as a function of the breach width. Overall, the ex-ceedance probabilities of extreme events are reduced by up-stream levee breaches while the exceedance probabilities of
Table 4. Number of levee breaches in 105simulations for the 12 breach width – turf quality scenario combinations. The left value for each scenario gives the number of model runs with breaches, the right values give the breaches at Krefeld (top) and Mehrum (bottom), respectively.
Scenario K0 K100 K200 K300 K400
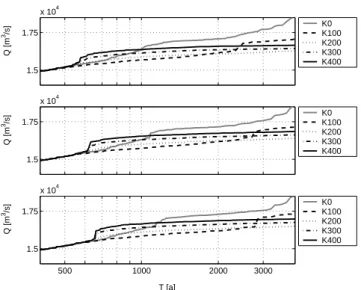
Breach width at Krefeld (m) No breach 100 200 300 400 Turf 0.7 99 — 173 173 173 173 174 174 174 174 parameter 99 41 19 7 1 f g 1.05 92 — 160 160 160 160 160 160 161 161 92 36 18 6 1 1.4 87 — 151 151 150 150 152 152 151 151 87 35 15 6 1 1.5 1.75 x 10⁴ Q [m 3/s] 1.5 1.75 x 10⁴ Q [m 3/s] 500 1000 2000 3000 1.5 1.75 x 10⁴ T [a] Q [m 3/s] K0 K100 K200 K300 K400 K0 K100 K200 K300 K400 K0 K100 K200 K300 K400
Fig. 10. Effect of varying the turf parameter, f g, on the flood
fre-quency curve at Rees for the 4 breach scenarios. From top to bottom
f gwas set to 0.7, 1.05 and 1.4.
discharges at the critical levels are increased. This effect is caused by the reduction of the peak flows of a number of floods that overtop the levee to discharges below the critical overflowing discharge. The effect is more pronounced the wider the breach at Krefeld is assumed.
The variation of the turf quality changes the shape of the frequency curves in a different way. Varying the turf pa-rameters changes the critical discharge required for levee breaches which in turn changes the return intervals for dis-charges larger than the critical discharge. The effect is appar-ent in Fig. 10. This figure indicates that the return interval of the critical discharge for levee breaches at Krefeld varies be-tween T =550 years to T =650 years within the turf quality scenarios.
The risk curve for Mehrum was constructed from the cal-culated inflow volume of the polder for the different scenar-ios. The expected damage for each breach event was calcu-lated from the damage curve (Fig. 6) and the maximum in-flow volume of the breach events. By this procedure, the risk
100 101 102 103 104 0 20 40 60 80 100 120 T [a]
Damage [Mio. Euro]
K0 K100 K200 K300 K400
Fig. 11. Risk curves for the polder Mehrum, scenarios with different
breach widths; f g=1.05.
curves for the polder at Mehrum shown in Fig. 11 were de-rived. The step-like trajectories of the risk curves are a result of the presence of the flood protection system as the dam-ages only occur for discharges equal to or in excess of dis-charges causing levee failure. For breach widths at Krefeld larger than 300 m, the risk of damage at Mehrum is zero up to a return interval of 104years which is a result of the high retention capacity of the upstream polder. This, again, em-phasises the key role of upstream levee failures for the flood risk downstream.
4.2 Uncertainty analysis
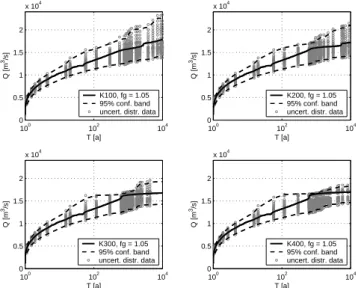
The uncertainty analysis performed by the 2nd level of Monte Carlo simulations yielded confidence bounds for each scenario. As an example, the annual maximum discharge frequency curve at Rees for the breach scenarios with f g set to 1.05 are shown in Fig. 12. All sources of epistemic un-certainty as shown in bold in Table 1 are included, the type
100 102 104 0 0.5 1 1.5 2 x 10⁴ T [a] Q [m 3/s] 100 102 104 0 0.5 1 1.5 2 x 10⁴ T [a] Q [m 3/s] 100 102 104 0 0.5 1 1.5 2 x 10⁴ T [a] Q [m 3/s] 100 102 104 0 0.5 1 1.5 2 x 10⁴ T [a] Q [m 3/s] K400, fg = 1.05 95% conf. band uncert. distr. data K300, fg = 1.05
95% conf. band uncert. distr. data
K200, fg = 1.05 95% conf. band uncert. distr. data K100, fg = 1.05
95% conf. band uncert. distr. data
Fig. 12. Uncertainty in the exceedance probability of annual
max-imum discharges at Rees caused by the distribution function type and the stage-discharge-relationship for the 4 breach scenarios. f g was set to 1.05.
of the extreme value distribution functions, the parameter estimates for the stage-discharge-relationship and the levee geometry error. Figure 12 suggests that, for large events, the uncertainty decreases with the width of the breach at Krefeld. This is due to the large breach outflow combined with the almost infinite retention capacity of the polder at Krefeld. Most of the randomised discharges of the uncertainty distri-butions that produce a levee breach are reduced to the level of the levee base in the case of a 400 m breach, resulting in the upper confidence bound approaching the frequency curve (Fig. 12) at the level of the critical breach discharge.
The risk curves associated with the flood frequency curves in Fig. 12 are shown in Fig. 13. It shows that the uncertainty in damage is hardly reduced by the breach width which is in contrast to the results of the flood frequency curve. The uncertainty bounds (dashed lines in Fig. 13) cover a wide range from zero damage to almost maximum damage above return intervals larger than about 200 years.
In Fig. 14 two epistemic uncertainty sources are examined independently. It shows that the uncertainty introduced by the parameter estimation of the stage-discharge-relationship is rather small in comparison with as compared to the over-all uncertainty. The uncertainty caused by the type of the distribution function alone is almost identical to the over-all uncertainty. If the two sources are combined, the un-certainty caused by the stage-discharge-relationship is com-pletely clouded by the uncertainty caused by the distribution function type. In line with this result, the uncertainty in the stage-discharge-relationship has almost no effect on the risk curves at Mehrum (not shown here).
The presented results indicate that the uncertainty of the risk assessment is enormous. This is caused by two facts:
Fig. 13. Exceedance probability of damage at the polder at Mehrum
(solid lines) and associated uncertainty (dashed lines) caused by distribution function type and stage-discharge-relationship for the K100 and K200 breach scenarios. f g was set to 1.05. The points show the Monte Carlo realisations.
1. the large magnitude and duration of floods required to cause levee failures,
2. the comparatively large uncertainty in the extreme value statistics for the annual maximum discharges with re-turn intervals > 200 years (cf. Fig. 2).
The combination of these two facts results in uncertainty dis-tributions that are almost binary. For floods associated with return intervals > 200 years either levee failures producing very high damages can occur, or if the levees happen to re-sist the flood, the polder is protected from any damage (see plot of uncertainty distribution points in Fig. 13). The con-fidence intervals calculated from these uncertainty distribu-tions are consequently enormous. For return intervals as high as 104years it is possible that the levee resists the flood and protects the polder or it fails and causes disastrous damages. This enormous uncertainty is only attributed to the uncer-tainty in the annual maximum discharge.
100 101 102 103 104 0 0.2 0.4 0.6 0.8 1 1.2 1.4 1.6 1.8 2x 10 4 T [a] Q [m 3/s] K300, fg = 1.05 CI all sources CI distributions CI HQ−relation
Fig. 14. Flood frequency curve for Rees showing the effect of the
two epistemic uncertainty sources extreme value statistics distribu-tion type and stage-discharge-reladistribu-tion (H Q−reladistribu-tion) for scenario K300. f g was set to 1.05.
5 Discussion and conclusion
The proposed model allows us to perform a quantitative flood risk analysis including the effect of levee failures along with the associated uncertainty. Because of the simple struc-ture of the model proposed here, a large number of Monte Carlo-simulations can be performed in a reasonable time which cover a wide variety of flood events. The approach is therefore very well suited to integrated flood risk assessment. Risk assessment (aleatory uncertainty)
The results obtained here suggest that, in the study reach, upstream levee failures significantly affect the failure probability downstream and, hence the risk curve of the target area. The simulations also illustrate the effect of the retention volume of a polder. Because of the very large retention capacity of the hinterland at Krefeld, the levee failure probability at Mehrum is significantly reduced and the flood frequency curve at Rees is attenuated if levee failures at Krefeld are allowed. The size of the polder at Mehrum controls the shape of the flood risk curve. The step-like shape of the risk curve results from the small volume of the polder at Mehrum and the high magnitude of the events overtopping the levee. However, in case of upstream breach widths larger than 300 m at Krefeld the risk equals zero for return intervals up to 104years. Taking the zero breach scenario at Krefeld as the worst case scenario for the target area, the results indicate that the flood protection structures at Mehrum are sufficient to resist floods up to return intervals of >1000 years, if the uncertainty of the results is neglected.
Uncertainty analysis (epistemic uncertainty)
The model also allows the analysis of various sources of epistemic uncertainty including the flood frequency statistics (annual maximum series) and the spatial breach development. By applying 2nd-order Monte Carlo sim-ulations, confidence bounds were derived for the flood frequency curves at the outlet of the study reach as well as for the risk curves of the polder at Mehrum. Due to the large uncertainty caused by the epistemic uncertainty sources the statement that the flood protection structures at Mehrum are sufficient to protect the area from a 1000-year flood has to be corrected. From the uncertainty bounds of the zero breach scenario, being he worst case for the polder Mehrum, and the 100 and 200 m breach width scenarios shown in Fig. 13 it can be concluded that the flood protection structures are likely to protect from floods with return intervals of less than 200 years. For larger floods, the uncertainty is mainly attributed to the extreme value statistics of the annual maximum discharge and yields that both complete failure and no failure may occur producing a range of possible damage from zero to maximum damage.
We also examined the sources of epistemic uncertainty in-dividually. The results suggest that a more reliable extreme value statistics is crucially important for reducing the uncer-tainty of the risk assessment. A major prerequisite for that are longer time series of annual maximum discharges. The used series of 35 years is clearly too short to obtain reliable risk assessments of events with associated return intervals of more the 200 years. In contrast to the extreme value statistics the stage-discharge-relationships proved to be relatively less important in the uncertainty analysis. From this finding it can be reasoned that the neglected uncertainty sources of Ta-ble 1 have also little influence on the uncertainty analysis as long as the uncertainty caused by the extreme value statistics cannot be reduced significantly. Uncertainties of the rout-ing module or the H Q−relation simply cannot cause such a variation in the modelling results, especially not at a rather uniform low-land stream the the Lower Rhine. Solely the uncertainties in the damage estimation are expected to cause a significant change in the risk curve. However, being the last module of the modelling system, which doesn’t influence the probability of flooding, it would only alter the maximum damage caused by floods. The characteristic shape of the risk curves and the associated return intervals remain unchanged. In contrast to this the uncertainties associated with the breach module still remain large. Better knowledge about the breach development and the distribution of the turf quality on natural levee systems would most likely reduce this unknown component of uncertainty in the risk assessment. A study in-vestigating the levee breaches during the August 2002 flood of the Elbe adressing this issue has been started. With these data we hope to extend the levee failure module from re-cently built levees to older flood defence structures and to get more information of spatial breach development. The un-certainty of damage estimation will also be refined by using
data gathered in the aftermath of the August 2002 flood. Ad-ditionally, a continuous test for levee breaches along the river course should be incorporated in the system in order to gener-ate more realistic estimgener-ates of the influence of levee breaches on flood risks.
Due to its modular structure and the universal nature of the methods used here, the proposed model system should be transferable to other river systems provided the required data sets are available. In addition, single parts of the model system may be applied independently, e.g. to investigate the probability of levee failure at a given location. It is therefore believed that the system may be profitably used for a number of additional purposes, e.g. as a tool for cost-benefit analy-sis of flood protection measures, and as a decision support system for operational flood control. Another possible appli-cation is the flood management and control during a severe flood for which estimates of the effects of upstream levee breaches on the shape and propagation of the flood wave and thus on inundation risks at the reaches downstream may be useful. Real time simulations of such scenarios could facil-itate the emergency management and enhance the efficiency of planned levee failures or weir openings. However, a pre-requisite for these applications is an accurate calibration of the model system to a given reach. Clearly, this needs to be done prior to a severe flood event. This implies that, ideally, the flood management system should be applicable to both long-term planning tasks and operational decision support. Acknowledgements. This study was prepared in the frame of the research project German Research Network Natural Disasters (DFNK) funded by the German Ministry for Education and Research (project number 01SFR9969/5). Data provision from the German Federal Institute of Hydrology, Koblenz, the German Insurance Association (GDV), Berlin and ProAqua, Aachen are gratefully acknowledged.
Edited by: T. Glade
Reviewed by: J. Hall and another referee
References
Apel, H., Thieken, A. H., Merz, B., and Bl¨oschl, G.: A probabilis-tic modelling system for assessing flood risks, Natural Hazards, Special Issue “German Research Network Natural Disasters”, in press, 2004.
Berga, L.: New trends in hydrological safety, in: Dam safety, edited by Berga, L., A.A. Balkema, Rotterdam, 1099–1106, 1998. Bowles, D. S., Anderson, L. R., and Glover, T. F.: Risk assessment
approach to dam safety criteria, Uncertainty in the Geologic En-vironment: From Theory to Practice, Geotechn. Spec. Publ., 58, ASCE., 451–473, 1996.
Cohen, J. T., Lampson, M. A., and Bowers, T. S.: The use of two-stage Monte Carlo simulation techniques to characterize variabil-ity and uncertainty in risk analysis, Human and Ecological Risk Assessment, 2(4), 939–971, 1996.
Cullen, A. C. and Frey, H. C.: Probabilistic techniques in exposure assessment – A handbook for dealing with variability and uncer-tainty in models and inputs, Plenum Press, New York, 335, 1999.
Disse, M., Kamrath, P., Hammer, M. and K¨ongeter, J.: Simulation of flood wave propagation and inundation areas by considering dike break scenarios, Natural Hazards, Special Issue “German Research Network Natural Disasters”, in press, 2004.
Dyck, S. and Peschke, G.: Grundlagen der Hydrologie, Verlag f¨ur Bauwesen, Berlin, 536, 1995.
Ferson, S. and Ginzburg, L. R.: Different methods are needed to propagate ignorance and variability, Reliability Eng. and Syst. Safety, 54, 133–144, 1996.
Grothmann, T. and Reusswig, F.: Coping with Floods: Risk Per-ception and Self-protective Behaviour of Households and Or-ganizations, Natural Hazards, Special Issue “German Research Network Natural Disasters”, in press, 2004.
Haimes, Y. Y.: Risk modeling, assessment, and management, Wiley Series in Systems Engineering, John Wiley & Sons, Inc., 726, 1998.
Hall, J. W.: Handling uncertainty in the hydroinformatic process, J. of Hydroinformatics, 05.4, 215–232, 2003.
Hall, J. W., Blockley, D. I., and Davis, J. P.: Non-additive prob-abilities for representing uncertain knowledge: theoretical and practical implications, in: Hydroinformatics ’98, edited by Babovic, V. M. and Larsen, L. C., A.A. Balkema, Rotterdam, 1101–1108, 1998.
Helton, J. C. and Burmaster, D. E.: Treatment of aleatory and epis-temic uncertainty in performance assessments for complex sys-tems, Reliability Engineering and Systems Safety, 54, 91–258, 1996.
Hewlett, H. W. M., Boorman, L. A., and Bramley, M. E.: Design of reinforced grass waterways, Construction Industry Research and Information Association (CIRIA), CIRIA Report 116, London, 95, 1987.
Hoffman, F. O. and Hammonds, J. S.: Propagation of uncertainty in risk assessments: The need to distinguish between uncertainty due to lack of knowledge and uncertainty due to variability, Risk Analysis, 14(5), 707–712, 1994.
Holz, K.-P. and Merting, F.: Concept for a web-based information system on flood measurement, Natural Hazards, Special Issue “German Research Network Natural Disasters”, in press, 2004. Kortenhaus, A. and Oumeraci, H.: Probabilistische
Be-messungsmethoden f¨ur Seedeiche (ProDeich), Bericht No. 877, Leichtweiss-Institut f¨ur Wasserwirtschaft, TU Braun-schweig, 205 (http://www.tu-bs.de/institute/lwi/hyku/german/ Berichte/LWI\ 877.pdf), 2002.
Maidment, D. R.: Handbook of Hydrology, McGraw-Hill, New York, 1000, 1992.
Menzel, L., Thieken, A. H., Schwandt, D., and B¨urger, G.: Impact of climate change on regional hydrology – scenario-based mod-elling studies in the German Rhine catchment, Natural Hazards, Special Issue “German Research Network Natural Disasters”, in press, 2004.
Merz, B., Thieken, A. H., and Bl¨oschl, G.: Uncertainty analysis for Flood Risk Estima-tion, in: International Conference on Flood Estimation, edited by Spreafico, M. and Weingartner, R., CHR Report II-17, 577–585, 2002.
Morgan, M. G. and Henrion, M.: Uncertainty: A guide to dealing with uncertainty in quantitative risk and policy analysis, Cam-bridge University Press, CamCam-bridge, England, 332, 1990. NRC (National Research Council): Flood Risk Management and
the American River Basin, An Evaluation, National Research Council, National Academy Press, Washington D.C., 235, 1995. NRC (National Research Council): Risk analysis and uncertainty in flood damage reduction studies, National Academy Press,
Wash-ington D.C., 202, 2000.
Plate, E. J.: Some remarks on the use of reliability analysis in hydraulic engineering applications, in: Reliability and uncer-tainty analysis in hydraulic design, edited by Yen, B. C. and Tung, Y.-K., American Society of Civil Engineers, New York, 5–15, 1993a.
Plate, E. J.: Statistik und angewandte Wahrscheinlichkeitslehre f¨ur Bauingenieure, Ernst & Sohn, Berlin, 685, 1993b.
Plate, E. J.: Stochastic design in hydraulics: concepts for a broader application, Proc. Sixth IAHR Intern. Symposium on Stochastic Hydraulics, Taipei, 1–15, 1992.
MURL (Ministerium f¨ur Umwelt, Raumordnung und Land-wirtschaft des Landes Nordrhein-Westfalen), Potentielle Hochwassersch¨aden am Rhein in Nordrhein-Westfalen, (unpub-lished report), 87, 2000.
Singh, V. P.: Dam Breach Modeling Technology, Kluwer Academic Publishers, Dordrecht, 242, 1996.
Stewart, M. G. and Melchers, R. E.: Probabilistic risk assessment of engineering systems, Chapman and Hall, London, 274, 1997.
USACE (U.S. Army Corps of Engineers): Risk-based analysis in geotechnical engineering for support of planning studies, Engi-neer Technical Letter (ETL) 1110–2–556, Washington D.C., 166, 1999.
USEPA (U.S. Environmental Protection Agency): Guiding princi-ples for Monte Carlo Analysis, EPA/630/R-97/001, Risk Assess-ment Forum, Washington D.C., 35, 1997.
Van Asselt, M. B. A. and Rotmans, J.: Uncertainty in Integrated Assessment Modelling, Climatic Change 54(1), 75–105, 2002. Vrijling, J. K.: Probabilistic Design – Lecture Notes, IHE Delft,
145, 2000.
Vrijling, J. K.: Probabilistic design of water defense systems in The Netherlands, Reliability Engineering and System Safety, 74, 337–344, 2001.
Wood, E. F. and Rodriguez-Iturbe, I.: A Baysian approach to an-alyzing uncertainty among flood frequency models, Water Re-sources Research, 11(6), 839–843, 1975.
Zio, E. and Apostolakis, G. E.: Two methods for the structured as-sessment of model uncertainty by experts in performance assess-ments of radioactive waste repositories, Reliability Engineering and System Safety, 54, 225–241, 1996.