HAL Id: hal-00297690
https://hal.archives-ouvertes.fr/hal-00297690
Submitted on 6 May 2008
HAL is a multi-disciplinary open access
archive for the deposit and dissemination of
sci-entific research documents, whether they are
pub-lished or not. The documents may come from
teaching and research institutions in France or
abroad, or from public or private research centers.
L’archive ouverte pluridisciplinaire HAL, est
destinée au dépôt et à la diffusion de documents
scientifiques de niveau recherche, publiés ou non,
émanant des établissements d’enseignement et de
recherche français ou étrangers, des laboratoires
publics ou privés.
and of glucose for bacteria at different pCO2 levels in a
mesocosm study
T. Tanaka, T. F. Thingstad, T. Løvdal, H.-P. Grossart, A. Larsen, M.
Allgaier, M. Meyerhöfer, K. G. Schulz, J. Wohlers, E. Zöllner, et al.
To cite this version:
T. Tanaka, T. F. Thingstad, T. Løvdal, H.-P. Grossart, A. Larsen, et al.. Availability of phosphate for
phytoplankton and bacteria and of glucose for bacteria at different pCO2 levels in a mesocosm study.
Biogeosciences, European Geosciences Union, 2008, 5 (3), pp.669-678. �hal-00297690�
Biogeosciences, 5, 669–678, 2008 www.biogeosciences.net/5/669/2008/
© Author(s) 2008. This work is distributed under the Creative Commons Attribution 3.0 License.
Biogeosciences
Availability of phosphate for phytoplankton and bacteria and of
glucose for bacteria at different pCO
2
levels in a mesocosm study
T. Tanaka1, T. F. Thingstad1, T. Løvdal1,*, H.-P. Grossart2, A. Larsen1, M. Allgaier2, M. Meyerh¨ofer3, K. G. Schulz3, J. Wohlers3, E. Z¨ollner3, and U. Riebesell31Marine Microbiology Research Group (MMRG), Department of Biology, University of Bergen, Bergen, Norway
2Leibniz Institute for Freshwater Ecology and Inland Fisheries (IGB-Neuglobsow), Department of Limnology of Stratified
Lakes, Alte Fischerhuette 2, D-16775 Stechlin, Germany
3Leibniz Institute of Marine Sciences (IFM-GEOMAR), D¨usternbrooker Weg 20, 24105 Kiel, Germany
*present address: Faculty of Science and Technology, Department of Mathematics and Natural Sciences, University of
Stavanger, N-4036 Stavanger, Norway
Received: 17 October 2007 – Published in Biogeosciences Discuss.: 5 November 2007 Revised: 17 April 2008 – Accepted: 17 April 2008 – Published: 6 May 2008
Abstract. Availability of phosphate for phytoplankton and
bacteria and of glucose for bacteria at different pCO2levels
were studied in a mesocosm experiment (PeECE III). Using nutrient-depleted SW Norwegian fjord waters, three differ-ent levels of pCO2(350 µatm: 1×CO2; 700 µatm: 2×CO2;
1050 µatm: 3×CO2)were set up, and nitrate and phosphate
were added at the start of the experiment in order to induce a phytoplankton bloom. Despite similar responses of total particulate P concentration and phosphate turnover time at the three different pCO2levels, the size distribution of
par-ticulate P and33PO4uptake suggested that phosphate
trans-ferred to the >10 µm fraction was greater in the 3×CO2
mesocosm during the first 6–10 days when phosphate con-centration was high. During the period of phosphate deple-tion (after Day 12), specific phosphate affinity and specific alkaline phosphatase activity (APA) suggested a P-deficiency (i.e. suboptimal phosphate supply) rather than a P-limitation for the phytoplankton and bacterial community at the three different pCO2levels. Specific phosphate affinity and
spe-cific APA tended to be higher in the 3×CO2 than in the
2×CO2and 1×CO2mesocosms during the phosphate
deple-tion period, although no statistical differences were found. Glucose turnover time was correlated significantly and neg-atively with bacterial abundance and production but not with the bulk DOC concentration. This suggests that even though constituting a small fraction of the bulk DOC, glucose was an important component of labile DOC for bacteria. Specific
Correspondence to: T. Tanaka
glucose affinity of bacteria behaved similarly at the three dif-ferent pCO2levels with measured specific glucose affinities
being consistently much lower than the theoretical maximum predicted from the diffusion-limited model. This suggests that bacterial growth was not severely limited by the glucose availability. Hence, it seems that the lower availability of in-organic nutrients after the phytoplankton bloom reduced the bacterial capacity to consume labile DOC in the upper mixed layer of the stratified mesocosms.
1 Introduction
Rising atmospheric CO2concentration changes seawater
car-bonate chemistry by lowering seawater pH, carcar-bonate ion concentration and carbonate saturation state, and increas-ing the dissolved CO2concentration (reviewed by Riebesell,
2004). If global CO2emissions continue to rise on current
trends (business as usual), the world oceans will suffer an es-timated pH drop of about 0.5 units, which is equivalent to a 3 fold increase in the concentration of hydrogen ions, by the year 2100 (Wolf-Gladrow, et al., 1999; Caldeira and Wick-ett, 2003). While the magnitude of ocean acidification can be predicted with a high level of confidence, its impact on marine organisms, their activities, and biogeochemical role are largely unknown.
Studies dealing with biological responses to increasing CO2partial pressure (pCO2)and related changes in
carbon-ate chemistry range from a single-species level in labora-tory cultures up to a semi-natural community level in out-door mesocosms. Some of these studies show that increasing
pCO2 can enhance primary production (Zondervan, et al.,
2001; Leonardos and Geider, 2005), release of dissolved car-bohydrates by phytoplankton (Engel, et al., 2004), and also modify phytoplankton species composition and succession (Tortell, et al., 2002). Such pCO2 dependent changes in
phytoplankton parameters further enhance growth rate and production as well as α- and β-glucosidase activity of het-erotrophic bacteria, especially of particle-attached bacteria (Grossart, et al., 2006a). It should be noted, however, that other studies have reported that increased pCO2gives no
sig-nificant increase in primary production (Tortell, et al., 2002; Sciandra, et al., 2003; Delille, et al., 2005). In addition, even within the same experiments (i.e., Tortell, et al., 2002; Engel, et al., 2004; Grossart, et al., 2006a), no significant increase in total phytoplankton biomass (Tortell, et al., 2002) and total bacterial biomass (Rochelle-Newall, et al., 2004; Grossart, et al., 2006a) at increasing pCO2levels have been detected. It
thus seems that pCO2dependent changes in phytoplankton
and bacterial parameters are not necessarily consistent. The elemental composition (e.g. C, N, P) in living organ-isms is to a certain extent constrained by the necessity to maintain their metabolism (homeostasis) as compared to the rest of the material world (reviewed by Sterner and Elser, 2002). Changes in pCO2dependent carbon production by
phytoplankton and bacteria (see above) may alter their nu-trient demands. On a global scale, such pCO2 dependent
changes will greatly influence carbon and nutrient cycling in the ocean. Significant changes in the consumption ratio of various inorganic nutrients due to increasing pCO2levels
have been found in one study (Tortell, et al., 2002) but not in another one (Engel, et al., 2005). In this context, changes in nutrient availability for phytoplankton and bacteria at dif-ferent pCO2levels seem to be unclear and thus need to be
investigated in greater detail.
Nutrient availability (e.g. deficiency, limitation) is not nec-essarily readily examined, especially for natural communi-ties of phytoplankton and bacteria. The specific affinity for a substrate is the slope of the specific uptake rate versus a substrate concentration curve, and is analogous to a spe-cific clearance rate, the volume cleared for food (substrate) per unit biomass and unit time (Thingstad and Rassoulzade-gan, 1999). Under P-depletion, bacteria and phytoplank-ton are known to produce alkaline phophatase (AP) which can split phosphate-monoester bonds of organic phosphorus complexes and release phosphate. The presence of AP ac-tivity (APA) can therefore be used as a convenient molecular indicator of P-deficiency (reviewed by Cembella, et al., 1984; Jansson, et al., 1988; Hoppe, 2003). A recent study suggests that the specific affinity for phosphate uptake and the specific APA are useful tools for examining phosphate availability in natural phytoplankton and bacterial communities in different P starved aquatic systems (Tanaka, et al., 2006). Similarly, the specific affinity for glucose is expected to be useful for examining the glucose availability for bacteria (e.g., Koch, 1971; Button, 1994).
The objective of the present study is to examine how the availability of phosphate for phytoplankton and bacteria and of glucose for bacteria, is affected by different pCO2levels
during a mesocosm experiment. Particulate P concentrations, turnover times of phosphate and glucose, and APA were measured together with a variety of other parameters during the experiment. By combining these results with biomass measurements of phytoplankton and bacteria (Paulino, et al., 2007; Schulz, et al., 2007), we have analyzed the specific phosphate affinity, specific APA, and specific glucose affin-ity.
2 Materials and methods
2.1 Experimental setup and sampling
The mesocosm experiment was carried out at the Espegrend Marine Biological Station (University of Bergen, Norway) from 15 May to 9 June 2005 (see Riebesell, et al., 2007; Schulz, et al., 2007 for details). Briefly, nine mesocosms (polyethylene, ca. 25 m3, 9.5 m water depth) were filled with unfiltered, nutrient-poor, post-bloom fjord water, and were covered by gas-tight tents (ETFE foil). Three different CO2
concentrations, 350 µatm (1×CO2), 700 µatm (2×CO2),
and 1050 µatm (3×CO2), were set up in triplicates by CO2
aeration (see Engel, et al., 2005 for details). To induce the development of a phytoplankton bloom, nitrate and phos-phate were added before the start of the experiment (Day – 1) to obtain initial concentrations of 14 µmol L−1NO3and
0.7 µmol L−1PO
4. Depth-integrated water samples (0–5 m)
were taken at 10h00 by using a tube sampler (5 m long, 10 cm diameter). Samples for dissolved and particulate nutrients, chlorophyll-a (Chl-a), and bacterial abundance and produc-tion were collected from all nine mesocosms (Paulino, et al., 2007; Schulz, et al., 2007; Allgaier, et al., 2008), while those for particulate P, turnover times of glucose and phosphate, and APA were taken from one mesocosm of each pCO2level
(M2: 1×CO2, M5: 2×CO2, and M8: 3×CO2)because of
logistic constraints. During this study, no significant differ-ences in the temporal changes of dissolved and particulate nutrients, biomass and production of phytoplankton and bac-teria were found between the triplicate mesocosms of each
pCO2 level (ANCOVA test, P>0.05: Egge, et al., 2007;
Paulino, et al., 2007; Schulz, et al., 2007; Allgaier, et al., 2008). Therefore, we assume that the three mesocosms (M2, M5, and M8) selected in this study were representative for each pCO2level.
2.2 Dissolved and particulate nutrients
Samples for dissolved and particulate nutrients were col-lected every day or every second day (see Riebesell, et al., 2007; Schulz, et al., 2007 for details). Concentrations of ni-trate, nitrite, soluble reactive phosphorus (SRP), and silicate were measured with an autoanalyzer (AA II) (Hansen and
T. Tanaka et al.: Availability of phosphate and labile organic carbon 671 Koroleff, 1999). Concentrations of dissolved organic
car-bon (DOC) were measured with a Shimadzu TOC-VCSN
an-alyzer (Qian and Mopper, 1996). POC were collected on pre-combusted (450◦C, 5 h) glass fiber filters (Whatman GF/F), fumed overnight with saturated HCl, dried, and measured with an elemental analyzer (EuroEA 3000, EuroVector).
Size-fractionated particulate P was measured within 2–6 days intervals. Samples were size-fractionated in triplicates on polycarbonate filters (47 mm diameter) with 10, 5, 1, and 0.2 µm pore sizes, respectively. After oxidization of particu-late P, liberated P was measured spectrophotometrically (Ko-roleff, 1983). The mean coefficient of variation was 14% for the >10 µm fraction, 10% for the >5 µm fraction, 11% for the >1 µm and >0.2 µm fractions (n=24 for each fraction). Only the mean concentrations are given for simplicity. 2.3 Biomass of phytoplankton and bacteria, and bacterial
production
Chla concentration and bacterial abundance were measured every day or every second day (see Paulino, et al., 2007; Schulz, et al., 2007 for details). Water samples for Chla mea-surements were filtered onto 25 mm Whatman GF/F filters. Chla was extracted in 100% acetone and then determined by a reverse-phase high-performance liquid chromatography (HPLC) (Barlow, et al., 1997). Samples for enumeration of bacteria were fixed with glutaraldehyde (0.5% final concen-tration), stained with SYBR Green I (Molecular Probes Inc., Eugene, OR), and counted by a flow cytometer (FACSCal-ibur, Becton Dickinson, Franklin Lakes, NJ) equipped with an air-cooled laser providing 15 mW at 488 nm and with standard filter set-up (Marie, et al., 1999).
Bacterial abundance and Chl-a were converted to C-biomass under the assumption that bacterial carbon content is 20 fg C cell−1(Lee and Fuhrman, 1987) and C: Chl-a is 30
(w:w), respectively. The P-biomass of bacteria and phyto-plankton was calculated from the C-biomass of bacteria us-ing a C:P molar ratio of 50 (Fagerbakke, et al., 1996) and from the C-biomass of phytoplankton using a C:P molar ra-tio of 106 (Redfield, et al., 1963), respectively. Although C:P ratios are variable for both phytoplankton and bacteria (e.g. Fagerbakke, et al., 1996; Geider and La Roche, 2002), we applied the average C:P ratios for phytoplankton and bac-teria. This is because a direct measurement of P biomass of osmotrophs was not done in this study (see Results and dis-cussion for potential biases by these fixed ratios).
Bacterial production was measured on Day 0 and there-after every second day between Days 6–24 (Allgaier, et al., 2008). Triplicates and a formalin-killed control were incu-bated with14C-leucine (Amersham, 1.15×10¹⁰Bq mmol−1)
at a final concentration of 50 nmol L−1 (Simon and Azam, 1989) in the dark at in situ temperature for 1 h. After fix-ation with 2% formalin, samples were filtered onto 0.2 µm nitrocellulose filters (Sartorius) and extracted with ice-cold 5% trichloroacetic acid (TCA). Thereafter, filters were rinsed
twice with ice-cold 5% TCA, dissolved with ethyl acetate, and radio-assayed. The amount of incorporated14C-leucine was converted to bacterial production by using an intracellu-lar isotope dilution factor of 2. A conversion factor of 0.86 was used to convert the protein produced into carbon (Simon and Azam, 1989).
2.4 Uptake of33PO4and14C-glucose
Uptake rate of orthophosphate was measured every day or every second day using 33P-orthophosphate (Thingstad, et al., 1993). Carrier-free 33P-orthophosphate (Amersham, 370 MBq ml−1)was added to samples at a final concentration of 125 pmol L−1. Samples for the subtraction of the back-ground and abiotic adsorption were fixed with 100% TCA before isotope addition. Samples were incubated under sub-dued (laboratory) illumination at in situ temperature. The incubation time varied between 5 min and 4 h: short enough to assure a linear relationship between the fraction of iso-tope adsorbed vs. the incubation time but it was long enough to reliably detect isotope uptake above background levels. Incubation was stopped by a cold chase of 100 mmol L−1 KH2PO4(final conc. 1 mmol L−1). Subsamples were filtered
in parallel onto 25 mm polycarbonate filters with 10, 5, 1, and 0.2 µm pore sizes, which were placed on a Millipore 12 place manifold with Whatman (GF/C) glass fiber filters saturated with 100 mmol L−1KH2PO4as support. After
fil-tration, filters were placed in polyethylene scintillation vials with Ultima Gold (Packard), and radio-assayed. After the ra-dioactivities of the filter were corrected for those of the blank filter obtained from fixed samples, T[P O4](h) was calculated
as T[P O4]=–t /ln(1-f ) where f is the fraction (no dimension)
of added isotope collected on the 0.2 µm filter after the incu-bation time (t:h).
Uptake rate of glucose, as an important labile DOC com-pound, was measured every day or every second day us-ing 14C-glucose (Hobbie and Crawford, 1969 modified by Havskum, et al., 2003). D-[U-14C]-glucose (Amersham, 7.4 MBq ml−1)was added to samples at a final concentration of 100 nmol L−1. After 1 h of incubation under subdued (lab-oratory) illumination at in situ temperature, the sample was split into two. Particulate14C (>0.2 µm) uptake was mea-sured on 10 ml samples filtered on 0.2 µm pore size cellulose nitrate filters, and14C-CO2 was absorbed on 25 mm
What-man (GF/F) glass fiber filters with 250 µl phenetylamine fixed inside the cap of 20 ml polyethylene scintillation vials containing 10 ml. Filters were placed in polyethylene scin-tillation vials with Ultima Gold (Packard) and radio-assayed. Turnover time of glucose was calculated as the inverse of the fraction of added isotope consumed per hour. The measure-ment could not be done between Days 0–3 due to a technical problem.
The specific affinity for phosphate uptake was calculated by normalizing phosphate uptake rates (inverse of phosphate turnover times) to the summed P-biomass of phytoplankton
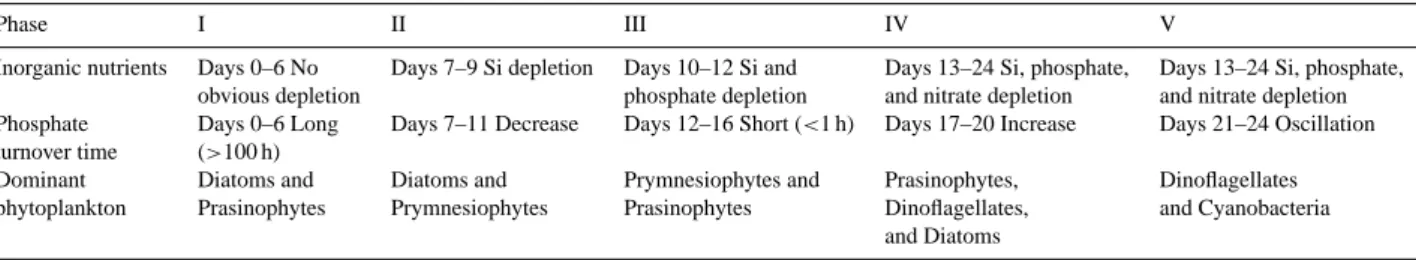
Table 1. Summary of temporal variations of inorganic nutrients and dominant phytoplankton groups (Schulz, et al., 2007) and phosphate
turnover time (this study). Phytoplankton groups are based on HPLC pigment analysis. Dominant groups are shown for each phase of phosphate turnover time.
Phase I II III IV V
Inorganic nutrients Days 0–6 No Days 7–9 Si depletion Days 10–12 Si and Days 13–24 Si, phosphate, Days 13–24 Si, phosphate,
obvious depletion phosphate depletion and nitrate depletion and nitrate depletion
Phosphate Days 0–6 Long Days 7–11 Decrease Days 12–16 Short (<1 h) Days 17–20 Increase Days 21–24 Oscillation
turnover time (>100 h)
Dominant Diatoms and Diatoms and Prymnesiophytes and Prasinophytes, Dinoflagellates
phytoplankton Prasinophytes Prymnesiophytes Prasinophytes Dinoflagellates, and Cyanobacteria
and Diatoms
Fig. 1. Temporal development of particulate P concentration
(µmol L−1)for different size-fractions.
and bacteria (Tanaka, et al., 2006). Similarly, the specific affinity for glucose uptake was calculated by normalizing glucose uptake rates (inverse of glucose turnover times) to the bacterial C-biomass.
2.5 Alkaline phosphatase activity (APA)
APA was measured fluorometrically using 3-0-methylfluorescein-phosphate as substrate (Perry, 1972). Samples were collected every day or every second day for the period with low concentrations of SRP (Days 10–25: Schulz, et al., 2007). Fluorescence mixed in the samples (final concentration 0.1 µmol L−1)was measured just after the addition of the substrate solution and at two or three subsequent times according to the fluorescence increase. After correcting fluorescence values of samples to those of autoclaved samples, APA (nmol-P L−1h−1)was calculated by using a linear regression of fluorescence values versus incubation time. As APA is derepressed when cellular P falls below a certain threshold level (e.g. Fitzgerald and Nelson, 1966, Rhee, 1973, Myklestad and Sakshaug, 1983) and biomass of phytoplankton and bacteria were variable with time and between mesocosms, biomass-specific APA (h−1)
was calculated by dividing APA by the estimated P biomass of osmotrophs (nmol-P L−1). Measurements of APA and phytoplankton biomass were not always synchronized due to logistic constraint. To calculate specific APA, Chl-a values
on Days 19, 21, and 23 (Data from Schulz, et al., 2007) and APA values on Day 24 were linearly interpolated.
2.6 Statistical analysis
The analysis of covariance (ANCOVA) was done using the R software (http://www.r-project.org/) with log-transformation of all data. Experimental day was used as the covariate and
pCO2was used as the nominal predictor. Correlation
analy-sis was used for a comparison of parameters (turnover times of phosphate and glucose, APA, concentrations of SRP and DOC, and bacterial abundance and production). As the tem-poral variations of these parameters were similar between the three mesocosms (see Results and discussion), all parameters were pooled for the correlation analysis.
3 Results and discussion
POC concentration and phytoplankton biomass increased from the start of the experiment, peaked around Day 10, and decreased onward in all mesocosms, while Si, SRP, and ni-trate concentrations changed from replete to deplete during the phytoplankton bloom (Riebesell, et al., 2007; Schulz, et al., 2007). These nutrient dynamics can be summarized as follows: (1) no obvious nutrient depletions between Days 0–6, (2) only Si depleted between Days 7–9, (3) Si and phos-phate depleted between Days 10–12, (4) Si, phosphos-phate, and nitrate depleted from Day 13 onward (Table 1).
Total particulate P (>0.2 µm) ranged from 0.28 to 0.97 µmol L−1 (Fig. 1). The increase of total particulate P between Days 0–10 was driven by an increase of par-ticulate P in the >10 µm fraction in all three mesocosms. This corresponded to an initial dominance of diatoms dur-ing the phytoplankton bloom (Riebesell, et al., 2007). The particulate P concentration in the >10 µm fraction peaked on Day 10 in all mesocosms, and was significantly higher in 3×CO2(0.61 µmol L−1)than in 1×CO2(0.44 µmol L−1)
(t-test, P<0.05). The highest proportion of the >10 µm frac-tion in 2×CO2and 1×CO2was observed on Day 6 (60% and
T. Tanaka et al.: Availability of phosphate and labile organic carbon 673
Fig. 2. Temporal changes of phosphate turnover time (h) (top) and
size-fraction (%) of33PO4uptake (bottom).
in the >10 µm fraction was significantly higher in 3×CO2
(0.46 µmol L−1) than in 2×CO2 (0.29 µmol L−1) (t-test,
P<0.005), and marginally higher in 3×CO2than in 1×CO2
(0.38 µmol L−1) (t-test, P=0.053). This suggests that P transferred to the >10 µm fraction was greater in 3×CO2
during this period. Since particulate P concentrations in the 0.2–1 µm fraction varied little between Days 0–10 except on Day 6 in 3×CO2, the proportion of the 0.2–1 µm fraction
to total particulate P decreased to 13–26% on Day 10. Af-ter Day 10, the proportion of the >10 µm fraction decreased to 33–43%, while that of the 1–10 µm fraction and of the 0.2–1 µm fraction increased to 30–45% and 25–50%, respec-tively, in all three mesocosms.
Temporal variations in the substrate turnover time reflect either those of substrate concentration or those of substrate flux through this pool or both. An overall significant pos-itive correlation between phosphate turnover time and SRP concentration (r=0.926, P<0.0001, n=48) suggests that tem-poral variations of phosphate turnover time reflected those of phosphate concentration. When SRP concentrations were lower than 0.1 µmol L−1, the relationship was still signifi-cant but with a reduced coefficient of correlation (r=0.646, P<0.0001, n=33). This suggests either an increased effect of background compounds such as acid labile DOP and arse-nate (e.g., Murphy and Riley, 1962) or a reduced analytical precision with decrease of SRP concentrations. Phosphate turnover time varied by a factor of ca. 1500 with a range of 0.4 to 625 h (Fig. 2, top). During the first 6 days when SRP concentrations were high (ca. 0.4–0.8 µmol L−1: Schulz, et al., 2007), phosphate turnover time was longest (in the or-der of 100 h). It rapidly decreased between Days 7–12 and remained shorter than 1 h between Days 12–16. Thereafter, turnover time increased between Days 17–20 and oscillated
Days
0 2 4 6 8 10 12 14 16 18 20 22 24A
P
A
(nm
ol
-P
L
-1h
-1)
0 5 10 15 20 25 30 3xCO2 (M2) 2xCO2 (M5) 1xCO2 (M8)Fig. 3. Temporal changes of alkaline phosphatase activity (APA:
nmol-P L−1h−1).
in a range of 0.5–21 h onward. Interestingly, these dynamics of phosphate turnover time corresponded approximately to those of the inorganic nutrients (Table 1). By using the five phases defined by the dynamics of phosphate turnover time, the succession of dominant phytoplankton groups based on HPLC pigment analysis (Schulz, et al., 2007) can be sum-marized as follows (Table 1): Diatoms and Prasinophytes in Phase I, Diatoms and Prymnesiophytes in Phase II, Prym-nesiophytes and Prasinophytes in Phase III, Prasinophytes, Dinoflagellates, and Diatoms in Phase IV, and Dinoflagel-lates and Cyanobacteria in Phase V. These results suggest that temporal changes in the availability of inorganic nutri-ents influenced those of phytoplankton biomass and succes-sion during the experiment.
When phosphate turnover time was shorter, more phos-phate was taken up by the smaller fraction and vice versa (Fig. 2, bottom). During the initial period (Days 0–6) with turnover time >100 h, 33PO4 uptake by the >10 µm
frac-tion increased up to 70% in 3×CO2, but only up to 50% in
both 2×CO2and 1×CO2. This also indicates that the
con-centration of particulate P in the >10 µm fraction was high-est in 3×CO2during the phytoplankton bloom (Fig. 1). The
mean uptake, however, was highest (47–53%) by the 0.2– 1 µm fraction and smallest (8–11%) by the 5–10 µm fraction during the experiment.
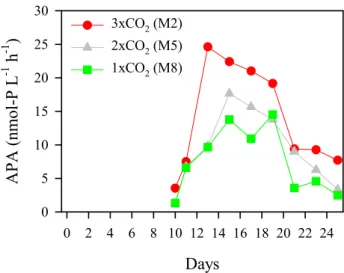
APA ranged from 1.3 to 24.6 nmol-P L−1h−1(Fig. 3).
Af-ter SRP depletion around Day 10 (Schulz, et al., 2007), APA increased towards Days 13–15, and the fastest and highest increase in APA was observed in 3×CO2. This suggests that
the available phosphate pool in 3×CO2was smallest during
this period. Thereafter, APA decreased in all three meso-cosms. A significant correlation was found between APA and phosphate turnover time (r=–0.689, P<0.005, n=15), but not between APA and SRP (r=0.414, P>0.1, n=15). This can
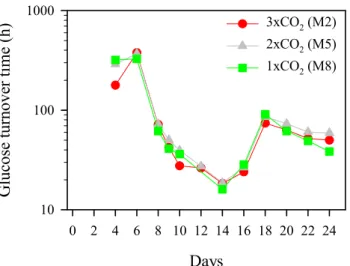
Days
0 2 4 6 8 10 12 14 16 18 20 22 24G
luc
os
e t
urnove
r t
im
e (h)
10 100 1000 3xCO2 (M2) 2xCO2 (M5) 1xCO2 (M8)Fig. 4. Temporal changes of glucose turnover time (h).
be explained by the fact that APA was measured only for the SRP depletion period, when the SRP concentration appeared to correspond to a lesser degree to the phosphate pool, as suggested by the reduced coefficient of correlation between phosphate turnover time and SRP concentration (see above). The glucose turnover time was long (>100 h) between Days 4–6, and rapidly decreased to ca. 16 h on Day 14 (Fig. 4). Thereafter, it rapidly increased towards Day 18 (74–91 h) and fluctuated between 39–73 h onward. No significant correlation was found between glucose turnover time and bulk DOC concentration (r=–0.282, P>0.1, n=26), suggesting the glucose pool being a small fraction in the bulk DOC pool. Glucose is the most common monomer of neutral sugar polymers and hence it may account for a substantial fraction of the labile DOC pool. In this study, the phytoplankton bloom resulted in an increase in bulk DOC of 25–30 µmol L−1 (Schulz, et al., 2007), which to a large degree can be composed of glucose-rich exudates (Grossart, et al., 2006b). Glucose turnover time was sig-nificantly and negatively correlated with bacterial abundance (r=–0.645, P<0.0001, n=26) and bacterial production (r=– 0.889, P<0.0001, n=20). This suggests that glucose was an important component of labile DOC for bacteria. Since the14C-glucose concentration (100 nmol L−1)might not al-ways have been at tracer level in this experiment, this could to some extent have caused an overestimation of glucose turnover time. Unfortunately, we did not measure glucose concentration in this study.
With regard to temporal changes of the parameters pre-sented in Figs. 1–4, no significant time-effects caused by the different pCO2treatments were detected during the
experi-ment (ANCOVA, P>0.05).
Specific phosphate affinity, which was calculated for the period of low SRP concentrations (Days 10–24: Table 1), ranged from 4.0×10⁻⁴ to 1.3×10⁻²L nmol-P−1h−1 in all three mesocosms (Fig. 5). As the temporal variations of
Specific PO4 affinity (L nmol-P -1 h-1 ) Days 0 2 4 6 8 10 12 14 16 18 20 22 24 0.0001 0.001 0.01 0.1 Specific APA (h -1 ) Days 0 2 4 6 8 10 12 14 16 18 20 22 24 0.001 0.01 0.1 3xCO2xCO2 (M2) 2 (M5) 1xCO2 (M8)
Fig. 5. Temporal changes of specific phosphate affinity (L
nmol-P−1h−1)(left) and specific APA (h−1)(right).
phosphate turnover time were much greater than those of phytoplankton and bacterial biomass (Paulino, et al., 2007; Schulz, et al., 2007; Fig. 2, top), temporal variations of spe-cific phosphate affinity mirrored those of phosphate turnover time. After SRP depletion, specific phosphate affinity in-creased towards Days 12–16, dein-creased between Days 16– 20, and showed short-term oscillations and tended to be higher in 3×CO2than in 2×CO2and 1×CO2between Days
20–24. Specific APA ranged from 0.003 to 0.141 h−1 and peaked with a delay of 4–6 days (Day 19) compared to APA (Figs. 3 and 5). This was because the temporal changes of the summed biomass of phytoplankton and bacteria were greater than those of the APA between Days 13–19 (Paulino, et al., 2007; Schulz, et al., 2007). However, no significant time-effects caused by the different pCO2 treatments were
detected in specific phosphate affinity and specific APA be-tween Days 10–24 or 25 (ANCOVA, P>0.05).
Tanaka et al. (2006) recently propose that a specific phos-phate affinity >0.02 L nmol-P−1h−1 and/or a specific APA
>0.2 h−1indicate P limitation, i.e. the growth rate of the ex-isting organisms is reduced due to the reduced P availabil-ity. They also suggest that a specific phosphate affinity in the order of 0.001 L nmol-P−1h−1and/or a specific APA in the order of 0.01 h−1indicate a situation that is less strict than limitation, i.e. P deficiency or suboptimal P supply for the phytoplankton and bacterial communities. According to this, the specific phosphate affinity and specific APA suggested a P-deficiency of the phytoplankton and bacterial commu-nities in all three mesocosms between Days 11–24, except for 2×CO2and 1×CO2on Days 20 and 24 (Fig. 5). We are
aware of the fact that the P biomass estimate, which was used to determine specific phosphate affinity and specific APA, in-cludes elements of uncertainty (see Materials and methods). However, the estimated P biomass never exceeded the chem-ically measured particulate P (>0.2 µm) (range: 14–60%,
n=36). The ratios of POC to particulate P were similar for all mesocosms and slightly higher (mean±SD: 129±28, n=38) than the Redfield ratio of 106 (see Schulz, et al., 2007 for POC data). If the specific phosphate affinity is recalculated by correcting the assumed C:P ratios by the POC to partic-ulate P ratios, only at one occasion (3×CO2on Day 23) we
T. Tanaka et al.: Availability of phosphate and labile organic carbon 675 found limitation whereas all other data points indicated
P-deficiency. We did not measure the active phytoplankton and bacteria in terms of phosphate uptake in this study, and an overestimation of active fraction in the phytoplankton and bacteria community (here assumed to be 100%) would lead to underestimation of the specific phosphate affinity. The osmotroph biomass was dominated by bacteria between the Phases III-V (mean±SD:67±12%, n=30), and thus effect of the active phytoplankton fraction on the specific phosphate affinity would not be significant. Under the assumption that the fraction of active bacteria was similar at the different
pCO2, an active fraction down to 54% indicated P-deficiency
at all data points between Days 10–24. By decreasing the ac-tive fraction to 5%, P-limitation occurred at 12 occasions out of 36. We therefore believe that the uncertainties in the P biomass estimation and the active fraction of bacteria do not significantly change our conclusions concerning phosphate availability: A P-deficiency (i.e. suboptimal phosphate sup-ply) rather than a P-limitation for the phytoplankton and bac-terial community. During the P-deficient period, viral abun-dance was high in all three mesocosms (Larsen, et al., 2007), suggesting viral lysis of bacterial and phytoplankton cells to be one of the major sources for the increase in DOM. How-ever, DOP concentrations increased gradually and slightly throughout the experiment (Schulz, et al., 2007). This can be explained by the fact that DOP produced via viral ly-sis is rather labile, and thus was rapidly degraded by DOP hydrolyzing enzymes such as APA (Berman, 1969) and 5’-nucleotidase (Ammerman and Azam, 1985). Both enzymes are essential for phosphate uptake from organic compounds via osmotrophs when the phosphorus demand exceeds the available phosphate pool.
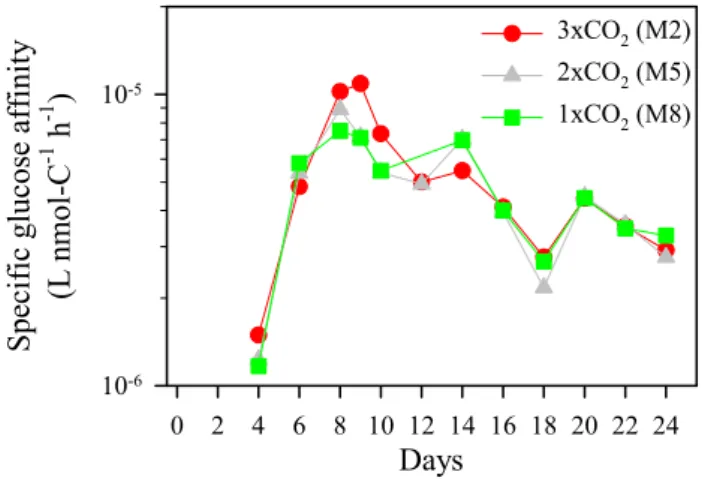
Specific glucose affinity varied similarly in the three mesocosms with a range of 1.2×10⁻⁶to 1.1×10⁻⁵L nmol-C−1h−1 (Fig. 6). It increased towards Day 9 and gradu-ally decreased onward. Differences in temporal variations between turnover time and specific affinity were due to the large temporal variations in bacterial biomass (Paulino, et al., 2007; Fig. 4). As discussed above, the significant neg-ative correlation between glucose turnover time and bacte-rial abundance/production suggests that glucose was an im-portant component of labile DOC for bacteria, although glu-cose being a small fraction of the bulk DOC. A significant negative correlation between specific glucose affinity and bulk DOC concentration (r=–0.625, P<0.001, n=26) sug-gests that temporal changes of bulk DOC concentration were largely related to those of the glucose pool available for bac-teria. This can be explained by increased production of labile DOC through phytoplankton DIC over-consumption (Togg-weiler, 1993; Riebesell, et al., 2007), which to a large de-gree can be composed of glucose-rich exudates (Grossart, et al., 2006b). In order to examine the substrate availability for osmotrophs, the experimentally determined specific affinity (αe)can be compared with the theoretical maximum (αmax). A theoretical expression for the maximum specific affinity
Days
0 2 4 6 8 10 12 14 16 18 20 22 24S
p
ec
ifi
c gl
uc
os
e a
ffi
ni
ty
(L
nm
ol
-C
-1h
-1)
10-6 10-5 3xCO2 (M2) 2xCO2 (M5) 1xCO2 (M8)Fig. 6. Temporal changes of specific glucose affinity (L nmol-C−1
h−1).
for a spherical cell of radius r can be derived (Thingstad, et al., 2005):
αmax= 4π Dr
m (1)
where D is the diffusion constant for the substrate molecules, and m is the amount of the limiting element quired to produce a new cell. For carbon, the amount re-quired for a cell is determined by both cell quota and respi-ration. Taking the respiration coefficient (R) into account for cell quota (Q) in unit of C, m is described as 1−RQ . If we assume that bacterial cells have a density of 1.2 g cm−3, 50% dry weight of wet weight, 50% carbon of dry weight, a cell radius of 0.25 µm, and a respiration coefficient of 0.5 and that the diffusion constant for glucose is 6×10⁻⁶cm2s−1 (e.g. Koch, 1971), the maximum specific affinity given by the diffusion limitation of substrate transport is calculated to be 2.1×10⁻³L nmol-C−1h−1. This theoretical maximum is 2– 3 orders of magnitude higher than the specific glucose affini-ties in all mesocosms (mostly in the order of 10−6L nmol-C−1h−1, Fig. 6). This suggests that bacterial growth was not severely limited by the glucose availability during the study period. An overestimation of the active bacteria (here as-sumed to be 100%) would lead the specific glucose affinity being underestimated. If the active fraction were 1%, the spe-cific glucose affinity might have been close to the theoretical maximum. However, if only this active fraction contributed to bacterial carbon production, generation time of the active bacteria must have been as short as 1 min between Days 10– 24 (data not shown). Such a generation time seems to be too short. Thus, we believe that the uncertainties in the active fraction of bacteria do not significantly change our conclu-sions concerning the glucose availability for bacteria.
Riebesell et al. (2007) report that enhanced DIC over-consumption was observed at higher pCO2 levels towards
the peak of phytoplankton bloom (Day 12), but the ratio of
POC to PON remained very close to the Redfield ratio at the three pCO2 levels. This deviation between DIC/NO3
drawdown and POC/PON build-up was attributed to an en-hanced DOC production at higher pCO2levels and a higher
loss of organic C from the upper mixed layer at higher pCO2
levels due to an enhanced export of POC including carbon-rich transparent exopolymer particles (TEP) originated from DOC (Riebesell, et al., 2007). This difference was mainly due to an enhanced organic14C production in the 0.2–1 µm fraction in higher pCO2 levels, a fraction overlapping TEP
size (Egge, et al., 2007), although the contribution of pi-cophytoplankton to total phytoplankton biomass was rela-tively small in all mesocosms (Paulino, et al., 2007; Riebe-sell, et al., 2007). Small and intermediate sized phytoplank-ton groups increased their importance relative to diatoms towards the end of the experiment (Paulino, et al., 2007; Schulz, et al., 2007). This size shift of the phytoplankton community should have reduced vertical sinking flux, but the loss of organic C from the upper mixed layer continued to-wards the end of the experiment and was consistently higher at higher pCO2levels (Riebesell, et al., 2007). These results
indicate that nutrient depletion (e.g. P-deficiency, Fig. 5) re-duced the bacterial capacity to degrade organic C despite in-creased concentrations of DOC at higher pCO2levels,
sug-gesting that DOC or small C-rich organic particles, such as TEP, formed sinking particles.
In summary, none of the parameters measured in the cur-rent study showed statistically significant time-effects among the three mesocosms, and thus were apparently indepen-dent of pCO2. This may be partly due to the lack of
par-allel measurements (one mesocosm for each pCO2 level).
Such small differences could be explained by the variance between “parallel treatments” rather than “different treat-ments” (Mart´ınez-Mart´ınez, et al., 2006). This implies that the plankton food webs can buffer to a large extent the ef-fects of increased pCO2and the related changes in carbon
chemistry during a short time frame (ca. 1 month). Such small differences were however in contrast to clear differ-ences in DIC/NO3uptake (Bellerby, et al., 2007; Riebesell, et
al., 2007) and the emission and/or uptake of volatile organic compounds (Sinha, et al., 2007) between the different pCO2
levels in the same experiment. In the other accompanying studies, effects of increased pCO2levels were, if found,
rel-atively small and appeared towards the end of the experiment (Egge, et al., 2007; Paulino, et al., 2007; Schulz, et al., 2007; Allgaier, et al., 2008). The specific phosphate affinity sug-gested a P-deficiency in the three mesocosms with a compar-atively lower phosphate availability in the 3×CO2mesocosm
towards the end of the experiment. On the other hand, the specific glucose affinity suggested no bacterial growth lim-itation by the glucose availability in the three mesocosms. These results suggested that a higher loss of organic car-bon from the surface mixed layer with increasing pCO2was
likely because a smaller pool of available inorganic nutrients limited the bacterial capacity to degrade labile DOC in the
upper mixed layer of the stratified mesocosms.
Acknowledgements. The authors thank the staff at the Marine
Biological Station, University of Bergen, Norway, in particular Tomas Sørlie and Agnes Aadnesen, and the Bergen Marine Research infrastructure (RI) for support in mesocosm logistics, all participants of PeECE III mesocosm experiment for valuable technical support and scientific exchange, and D. N´erini for sta-tistical analysis with the software R. The comments by J. K. Egge improved the earlier version of the manuscript. Two anonymous reviewers provided useful comments. This work was supported by the Norwegian Research Council (to T. F. Thingstad), the Leibniz foundation (to H.-P. Grossart), the Japanese Society for Promoting Science (to T. Tanaka).
Edited by: A. Boetius
References
Allgaier, M., Riebesell, U., and Grossart, H.-P.: Microbial response
to enrichment in pCO2and subsequent changes in
phytoplank-ton and nutrient dynamics, Biogeosciences Discuss., 5, 317–359, 2008,
http://www.biogeosciences-discuss.net/5/317/2008/.
Ammerman, J. W., and Azam, F.: Bacterial 5’-nucleotidase in aquatic ecosystems: a novel mechanism of phosphorus regen-eration, Science, 227, 1338–1340, 1985.
Barlow, R. G., Cummings, D. G., and Gibb, S. W.: Improved res-olution of mono- and divinyl chlorophylls a and b and zeaxan-thin and lutein in phytoplankton extracts using reverse phase C-8 HPLC, Mar. Ecol. Prog. Ser., 161, 303–307, 1997.
Bellerby, R. G. J., Schulz, K. G., Riebesell, U., Neill, C., Nondal, G., Johannessen, T., and Brown, K. R.: Marine ecosystem com-munity carbon and nutrient uptake stoichiometry under varing ocean acidification during the PeECE III experiment, Biogeo-sciences Discuss., 4, 4631–4652, 2007,
http://www.biogeosciences-discuss.net/4/4631/2007/.
Berman, T.: Phosphatase release of inorganic phosphorus in Lake Kinneret, Nature, 224, 1231–1232, 1969.
Button, D. K.: The physical base of marine bacterial ecology, Mi-crob. Ecol., 28, 273–285, 1994.
Caldeira, K. and Wickett, M. E.: Anthropogenic carbon and ocean pH, Nature, 425, 365, 2003.
Cembella, A. D., Anita, N. J., and Harrison, P. J.: The utilization of inorganic and organic phosphorus compounds as nutrients by eu-caryotic microalgae: a multidiciplinary perspective: part 1, CRC Crit. Rev. Microbiol., 10, 317–391, 1984.
Delille, B., Harlay, J., Zondervan, I., Jacquet, S., Chou, L., Wollast, R., Bellerby, R. G. J., Frankignoulle, M., Borges, A. V., Riebe-sell, U., and Gattuso, J. P.: Response of primary production and
calcification to changes of pCO2 during experimental blooms
of the coccolithophorid Emiliania huxleyi, Global Biogeochem. Cycles, 19, GB2023, doi:10.1029/2004GB002318, 2005. Egge, J. K., Thingstad, T. F., Engel, A., Bellerby, R. G. J.,
and Riebesell, U.: Primary production during nutrient-induced
blooms at elevated CO2 concentrations, Biogeosciences
Dis-cuss., 4, 4385–4410, 2007,
T. Tanaka et al.: Availability of phosphate and labile organic carbon 677 Engel, A., Delille, B., Jacquet, S., Riebesell, U., Rochelle-Newall,
E., Terbr¨uggen, A., and Zondervan, I.: Transparent exopolymer particles and dissolved organic carbon production by Emiliania
huxleyi exposed to different CO2 concentrations: a mesocosm
experiment, Aquat. Microb. Ecol., 34, 93–104, 2004.
Engel, A., Zondervan, I., Aerts, K., Beaufort, L., Benthien, A., Chou, L., Delille, B., Gattuso, J.-P., Harlay, J., Heemann, C., Hoffmann, L., Jacquet, S., Nejstgaard, J., Pizay, M.-D., Rochelle-Newall, E., Schneider, U., Terbrueggen, A., and
Riebe-sell, U.: Testing the direct effect of CO2 concentration on a
bloom of the coccolithophorid Emiliania huxleyi in mesocosm experiments, Limnol. Oceanogr., 50, 493–507, 2005.
Fagerbakke, K. M., Heldal, M., and Norland, S.: Content of carbon, nitrogen, oxygen, sulfur and phosphorus in native aquatic and cultured bacteria, Aquat. Microb. Ecol., 10, 15–27, 1996. Fitzgerald, G. P. and Nelson, T. G.: Extractive and enzymatic
anal-yses for limiting or surplus phosphorus in algae, J. Phycol., 2, 32–37, 1966.
Geider, R. J. and La Roche, J.: Redfield revisited: variability of C:N:P in marine microalgae and its biochemical basis, Eur. J. Phycol., 37, 1–17, 2002.
Grossart, H.-P., Allgaier, M., Passow, U., and Riebesell, U.: Test-ing the effect of CO2 concentration on the dynamics of ma-rine heterotrophic bacterioplankton, Limnol. Oceanogr., 51, 1– 11, 2006a.
Grossart, H. P., Czub, G., and Simon, M.: Algae-bacteria interac-tions and their effects on aggregation and organic matter flux in the sea, Environ. Microbiol., 8, 1074–1084, 2006b.
Hansen, H. P., and Koroleff, F.: Determination of nutrients. in: Methods of seawater analysis, edited by: Grasshoff, K., Krem-ling, K., and Ehrhardt, M., 3rd edition, Wiley VCH, Weinheim, Germany, 159–228, 1999.
Havskum, H., Thingstad, T. F., Scharek, R., Peters, F., Berdalet, E., Sala, M. M., Alcaraz, M., Bangsholt, J. C., Zweifel, U. L.,
Hagstr¨om, ˚A., Perez, M., and Dolan, J. R.: Silicate and labile
DOC interfere in structuring the microbial food web via algal-bacterial competition for mineral nutrients: Results of a meso-cosm experiment, Limnol. Oceanogr., 48, 129–140, 2003. Hobbie, J. E. and Crawford, C. C.: Respiration corrections for
bac-terial uptake of dissolved organic compounds in natural waters, Limnol. Oceanogr., 14, 528–532, 1969.
Hoppe, H.-G.: Phosphatase activity in the sea, Hydrobiol., 493, 187–200, 2003.
Jansson, M., Olsson, H., and Pettersson, K.: Phosphatases; origin, characteristics and function in lakes, Hydrobiol., 170, 157–175, 1988.
Koch, A. L.: The adaptive responses of Escherichia coli to a feast and famine existence, edited by: Rose, A. H. and Wilkinson, J. F., Adv. Microb. Physiol. Vol 6. Academic Press Inc., London, UK, 147–217, 1971.
Koroleff, F.: Determination of phosphorus. in: Methods of seawater analysis, edited by: Grasshoff, K., Ehrhardt, M., and Kremling, K., Second, revised and extended edition. Verlag Chemie, Wein-heim, Germany, 1983.
Larsen, J. B., Larsen, A., Thyrhaug, R., Bratbak, G., and Sandaa, R.-A.: Response of marine viral populations to a nutrient induced
phytoplankton bloom at different pCO2levels, Biogeosciences,
5, 523–533, 2008,
http://www.biogeosciences.net/5/523/2008/.
Lee, S. and Fuhrman, J. A.: Relationships between biovolume and biomass of naturally derived marine bacterioplankton, Appl. En-viron. Microbiol., 53, 1298–1303, 1987.
Leonardos, N. and Geider, R. J.: Elevated atmospheric carbon diox-ide increases organic carbon fixation by Emiliania huxleyi (Hap-tophyta), under nutrient-limited high-light conditions, J. Phycol., 41, 1196–1203, 2005.
Marie, D., Partensky, F., Vaulot, D., and Brussaard, C.: Enumera-tion of phytoplankton, bacteria, and viruses in marine samples. in, Current Protocols in Cytometry, Vol. 11. John Wiley & Sons, Inc., 1–15, 1999.
Mart´ınez-Mart´ınez, J., Norland, S., Thingstad, T. F., Schroeder, D. C., Bratbak, G., Wilson, W. H., and Larsen, A.: Variability in mi-crobial population dynamics between similarly perturbed meso-cosms, J. Plankton Res., 28, 783–791, 2006.
Murphy, J. and Riley, J. P.: A modified single solution method for the determination of phosphate in natural waters, Analytica Chemica Acta, 27, 31–36, 1962.
Myklestad, S. and Sakshaug, E.: Alkaline phosphatase activity of
Skeletonema costatum populations in the Trondheimsfjord, J.
Plankton Res., 5, 557–563, 1983.
Paulino, A. I., Egge, J. K., and Larsen, A.: Effects of increased
atmospheric CO2 on small and intermediate sized osmotrophs
during a nutrient induced phytoplankton bloom, Biogeosciences Discuss., 4, 4173–4195, 2007,
http://www.biogeosciences-discuss.net/4/4173/2007/.
Perry, M. J.: Alkaline phosphatase activity in subtropical central north Pacific waters using a sensitive fluorometric method, Mar. Biol., 15, 113–119, 1972.
Qian, J., and Mopper, K.: Automated performance, high-temperature combustion total organic carbon analyzer, Anal. Chem., 68, 3090–3097, 1996.
Redfield, A. C., Ketchum, B. H., and Richards, F. A.: The influence of organisms on the composition of sea water, edited by: Hill, M. N., The sea. Vol. 2. Interscience, New York, USA, 1963. Rhee, G.-Y.: A continuous culture study of phosphate uptake,
growth rate and polyphosphate in Scenedesmus sp., J. Phycol., 9, 495–506, 1973.
Riebesell, U.: Effects of CO2enrichment on marine phytoplankton,
J. Oceanogr., 60, 719–729, 2004.
Riebesell, U., Schulz, K. G., Bellerby, R. G. J., Fritsche, P., Mey-erh¨ofer, M., Neill, C., Nondal, G., Oschlies, A., Wohlers, J., and Z¨ollner, E.: Enhanced biological carbon consumption in a high
CO2ocean, Nature, 450, 545–548, 2007.
Rochelle-Newall, E., Delille, B., Frankignoulle, M., Gattuso, J. P., Jacquet, S., Riebesell, U., Terbruggen, A., and Zondervan, I.: Chromophoric dissolved organic matter in experimental
meso-cosms maintained under different pCO2levels, Mar. Ecol. Prog.
Ser., 272, 25–31, 2004.
Schulz, K. G., Riebesell, U., Bellerby, R. G. J., Biswas, H., Mey-erh¨ofer, M., M¨uller, M. N., Egge, J. K., Nejstgaard, J. C., Neill, C., Wohlers, J., and Z¨ollner, E.: Build-up and decline of organic matter during PeECE III, Biogeosciences Discuss., 4, 4539– 4570, 2007,
http://www.biogeosciences-discuss.net/4/4539/2007/.
Sciandra, A., Harlay, J., Lefevre, D., Lemee, R., Rimmelin, P., De-nis, M., and Gattuso, J. P.: Response of coccolithophorid
Emil-iania huxleyi to elevated partial pressure of CO2under nitrogen limitation, Mar. Ecol. Prog. Ser., 261, 111–122, 2003.
Simon, M., and Azam, F.: Protein content and protein synthesis rates of planktonic marine bacteria, Mar. Ecol. Prog. Ser., 51, 201–213, 1989.
Sinha, V., Williams, J., Meyerhofer, M., Riebesell, U., Paulino, A. I., and Larsen, A.: Air-sea fluxes of methanol, acetone, acetalde-hyde, isoprene and DMS from a Norwegian fjord following a phytoplankton bloom in a mesocosm experiment, Atmos. Chem. Phys., 7, 739–755, 2007,
http://www.atmos-chem-phys.net/7/739/2007/.
Sterner, R. W. and Elser, J. J.: Ecological stoichiometry, Princeton University Press, Princeton, 2002.
Tanaka, T., Henriksen, P., Lignell, R., Olli, K., Sepp¨al¨a, J., Tam-minen, T., and Thingstad, T. F.: Specific affinity for phosphate uptake and specific alkaline phosphatase activity as diagnostic tools for detecting P-limited phytoplankton and bacteria, Estuar-ies and Coasts, 29, 1226–1241, 2006.
Thingstad, T. F. and Rassoulzadegan, F.: Conceptual models for the biogeochemical role of the photic zone microbial food web, with particular reference to the Mediterranean Sea, Prog. Oceanogr., 44, 271–286, 1999.
Thingstad, T. F., Skjoldal, E. F., and Bohne, R. A.: Phosphorus cycling and algal-bacterial competition in Sandsfjord, western Norway, Mar. Ecol. Prog. Ser., 99, 239–259, 1993.
Thingstad, T. F., Øvre˚as, L., Egge, J. K., Løvdal, T., and Heldal, M.: Use of non-limiting substrates to increase size; a generic strat-egy to simultaneously optimize uptake and minimize predation in pelagic osmotrophs?, Ecol. Lett., 8, 675–682, 2005.
Toggweiler, J. R.: Carbon overconsumption, Nature, 363, 210–211, 1993.
Tortell, P. D., DiTullio, G. R., Sigman, D. M., and Morel, F. M.
M.: CO2effects on taxonomic composition and nutrient
utiliza-tion in an Equatorial Pacific phytoplankton assemblage, Marine Ecology-Progress Series, 236, 37–43, 2002.
Wolf-Gladrow, D., Riebesell, U., Burkhardt, S., and Bijma, J.:
Di-rect effect of CO2concentration on growth and isotopic
compo-sition of marine plankton, Tellus, 51B, 461–476, 1999.
Zondervan, I., Zeebe, R. E., Rost, B., and Riebesell, U.: Decreas-ing marine biogenic calcification: A negative feedback on risDecreas-ing
atmospheric pCO2, Global Biogeochem. Cycles, 15, 507–516,