HAL Id: hal-03265367
https://hal.archives-ouvertes.fr/hal-03265367
Submitted on 20 Jun 2021
HAL is a multi-disciplinary open access
archive for the deposit and dissemination of sci-entific research documents, whether they are pub-lished or not. The documents may come from teaching and research institutions in France or abroad, or from public or private research centers.
L’archive ouverte pluridisciplinaire HAL, est destinée au dépôt et à la diffusion de documents scientifiques de niveau recherche, publiés ou non, émanant des établissements d’enseignement et de recherche français ou étrangers, des laboratoires publics ou privés.
Chemical Forms of Mercury in Pilot Whales Determined
from Species-Averaged Mercury Isotope Signatures
Alain Manceau, Romain Brossier, Brett Poulin
To cite this version:
Alain Manceau, Romain Brossier, Brett Poulin. Chemical Forms of Mercury in Pilot Whales Deter-mined from Species-Averaged Mercury Isotope Signatures. ACS Earth and Space Chemistry, ACS, 2021, 5 (6), pp.1591-1599. �10.1021/acsearthspacechem.1c00082�. �hal-03265367�
1
Chemical Forms of Mercury in Pilot Whales Determined from Species-Averaged Mercury Isotope Signatures
Alain Manceau1,*, Romain Brossier1,*, and Brett A. Poulin2
1Université Grenoble Alpes, ISTerre, CNRS, 38000 Grenoble, France
2Department of Environmental Toxicology, University of California Davis, Davis, CA 95616,
USA
Correspondence: alain.manceau@univ-grenoble-alpes.fr; romain.brossier@univ-grenoble-alpes.fr
ABSTRACT: Marine mammals detoxify organic methylmercury (MeHg) as inorganic mercury
selenide (HgSe), yet the nature of the reaction intermediate species and the tissue-specific redistribution of Hg species in the body are unknown. We report that the identity and proportion of the dominant Hg species in long-finned pilot whale (Globicephala melas) tissues can be obtained from the bulk variation of isotopic values of δ202Hg against the extent of demethylation (percentage of total Hg as MeHg, %MeHg) using an alternating regularized inversion method. Our analysis of isotope data from two previous studies supports that MeHg is demethylated as a tetraselenolate species (Hg(Sec)4), which
further transforms into HgSe. Hg(Sec)4 occurs in the liver, kidneys, muscle, heart, and brain, whereas
HgSe biomineralization occurs only in the liver and kidneys. This study provides a mathematical approach that facilitates probing the molecular-level chemistry of mercury in biological tissues using bulk isotopic data.
2
INTRODUCTION
The enrichment of the biosphere in anthropogenic mercury (Hg) impacts wildlife and humans across the globe.1-4 Despite detailed understanding of the environmental conditions that promote the uptake of neurotoxic methylmercury (MeHg) in food webs, key knowledge gaps remain on the internal transformations, redistribution, and toxicologic mechanisms of Hg in higher organisms. Recently, advancement in the application of high energy-resolution X-ray absorption (HR-XANES) spectroscopy in wildlife identified that MeHg is detoxified to nontoxic mercury selenide (HgSe) through an intermediary Hg-tetraselenolate (Hg(Sec)4) species.5-7 The step-wise transformation of MeHg observed
in bird and fish tissues (MeHg → Hg(Sec)4 → HgSe), likely initiated by selenoprotein P (SelP),5
provided the first in vivo mechanistic information for the observation of HgSe in the liver and extrahepatic tissues of marine mammals8-12 and seabirds6 using standard resolution X-ray absorption
spectroscopy and electron microscopy. Although these two techniques provide critical structural information on mercury,8-26 they provide limited insight into biochemical processes essential for understanding the toxicokinetics of toxic MeHg in organisms (i.e., fate, tissue-specific exchange).
Stable isotope ratios of Hg offer a powerful alternative to spectroscopic and microscopic approaches.27 Chemical reactions induce a fractionation of isotopes between reactants and products,
28-34 and therefore Hg metabolic pathways can be investigated if species-specific stable isotope signatures
are known.35, 36 The isotopic fractionation of 202Hg relative to 198Hg (denoted as δ202Hg) is well suited
for this purpose because δ202Hg can vary by more than 3.5‰ in biological tissues.30 However, tissues usually contain more than one Hg species,5, 6 thus bulk δ202Hg values are weighted averages of all δ202Spi
values present in the tissue
δ202Hg
3 where i is the number of species and f(Spi,t) is the molar fraction of species i in tissue t. At present, a
key limitation in the field of Hg toxicology is resolving the linkages between the speciation of Hg and bulk δ202Hg values.
The first attempt to combine HR-XANES spectroscopy and 202Hg fractionation was performed recently by Poulin et al.37 on piscivorous birds from lacustrine, estuarine, and marine environments. The demethylation of MeHg to Hg(Sec)4 led to a δ202Hg(Sec)4 - δ202MeHg = -2.2 ± 0.1‰ depletion of the 202Hg isotope. Here, we follow a different approach and show that the isotopic signature and proportion
of unique Hg species (δ202Spi and f(Spi,t)) can be obtained directly from bulk δ202Hgt values of tissues
and the molar fraction of MeHg to total Hg (f(MeHg)), the latter being a routine chemical measurement. The demonstration is performed on two independent data sets on long-finned pilot whale (Globicephala melas) tissues documented by Li et al. (2020)36 and Bolea-Fernandez et al. (2019)38. The speciation of
Hg as MeHg, Hg(Sec)4, and HgSe in long-finned pilot whale tissues were obtained by calculating
iteratively the isotopic signature and proportion of unique Hg species (δ202Spi and f(Spi,t)) using a
regularized inversion method.39, 40 The mathematical approach showcases how Hg speciation data can be obtained from bulk isotopic ratios, providing a new tool to investigate the transformations and tissue-specific redistribution of the Hg species in organisms.
METHODS
Data. The δ202Hgt, [Hg]tot, total Se ([Se]tot), and f(MeHg) data from Li et al. (2020)36 included data
of the liver, kidneys, muscle, heart, and brain of 3 juvenile and 4 adult long-finned pilot whales (G. melas) sampled in the Faroe Islands (2016) (n = 35). The δ202Hgt, [Hg]tot, and f(MeHg) data from
Bolea-Fernandez et al. (2019)38 included data of the liver, kidneys, and muscle tissues of juvenile (n = 10, 10, and 8, respectively) and adult (n = 11, 10, and 6, respectively) long-finned pilot whales (G. melas). Bolea-Fernandez et al. (2019)38 also measured δ202Hgt in the blood of 7 juvenile and 7 adult pilot whales,
4 but not f(MeHg). The whales were stranded on a Scottish beach in the United Kingdom (September 12, 2012). For liver tissues of Bolea-Fernandez et al. (2019)38, [Se]tot datawere obtained from Gajdosechova
et al. (2016).12 Wet weight [Hg]tot and [Se]tot of Bolea-Fernandez et al. (2019)38 were converted to dry
weight values using the average moisture content of 73.8 ± 2.8% determined by Li et al. (2020) for similar tissues.36
Analysis of Hg:Se Ratio: The ratio of Hg to Se was evaluated using the approach outline in Manceau
et al. (2021).6 Briefly, the molar ratio of Hg to Se (Hg:Sechem) was determined using chemical
measurements. To account for the stoichiometry of the Hg(Sec)4 and HgSe species observed in the
whale tissues, the effective Hg:Se (Hg:Seeff) was determined (Eq. 2) using values of f(HgSe) and
f(Hg(Sec)4) determined by alternating regularization.
Hg:Seeff = Hg:Sechem × (f(HgSe) + 4 × f(Hg(Sec)4)) (2)
RESULTS AND DISCUSSION
The species distribution of Hg as MeHg, Hg(Sec)4, and HgSe in pilot whale tissues was obtained by
calculating iteratively δ202Sp
i and f(Spi,t) in three steps: (1) an initialization of δ202Spi for each of the
three Hg species using the published δ202Hg
t versus f(MeHg) data,36, 38 (2) an estimation of the fractional
amounts of Hg(Sec)4 (f(Hg(Sec)4)) and HgSe (f(HgSe)) using fixed δ202Spi values and measured δ202Hgt
and f(MeHg) values, and (3) an inverse calculation41 of δ202Spi with fixed f(Hg(Sec)4) and f(HgSe)
values and measured δ202Hgt and f(MeHg) values. Steps 2 and 3 are repeated with new values of
f(Hg(Sec)4), f(HgSe), and δ202Spi assigned at every iteration until convergence is reached. Step 1: Initialization of δ202Sp
i. The Li et al. (2020)36 and Bolea-Fernandez et al. (2019)38 data are highly consistent in the trends between bulk δ202Hgt and f(MeHg) (Fig. 1a,b). δ202Hgt values are highest
in the muscle and heart tissues with f(MeHg) ≈ 1.0 and decrease linearly with decreasing f(MeHg) in the muscle, heart, and brain tissues. At f(MeHg) ≤ ~0.2, which is observed exclusively in the liver and
5 kidneys of adult pilot whales, δ202Hg
t rebounds to more positive values. The ranges of δ202Hgt values
for the three conditions of f(MeHg) are also similar between the two studies: δ202Hgt = 1.0 to 1.4‰ for
f(MeHg) ≈ 1, δ202Hgt = -0.4 to 0.3‰ for f(MeHg) ≈ 0.0, and δ202Hgt exhibits a minimum of ~-1.3‰ at
f(MeHg) ≈ 0.05 to 0.10. Previous measurements show that MeHg is almost completely demethylated as nanoparticulate HgSe in the liver of pilot whales,9, 12 and therefore the δ202Hg value for HgSe was initialized as δ202HgSe = 0.0‰. One liver tissue of an adult pilot whale from the Li et al. (2020)36 data
is an outlier with δ202Hg = 0.33‰ for f(MeHg) = 0.08 (black arrow in Fig. 1a). Importantly, the hockey
stick shape of the δ202Hgt versus f(MeHg) plots (Fig. 1) suggests the occurrence of an intermediate
species in the MeHg → HgSe reaction, which was previously documented to be Hg(Sec)4.5-7 The
analysis here supports that Hg(Sec)4 is highly enriched in lighter Hg isotopes compared to MeHg,
consistent with the observed MDF of mercury due to the demethylation of MeHg to Hg(Sec)4,37 and to
a lesser extent HgSe.
Next, initialized δ202Hg values of MeHg (δ202MeHg) and Hg(Sec)4 (δ202Hg(Sec)4) were obtained by
a linear regression of δ202Hg
t versus f(MeHg) for tissues exempt of HgSe. Fig. 1 shows that the δ202Hgt
values for muscle, heart, and brain tissues are significantly correlated with f(MeHg), and therefore can be used to estimate δ202Hg(Sec)4. Furthermore, careful study of the data shows that two kidneys of
juvenile pilot whales of Li et al. (2020)36 and several liver and kidneys tissues of Bolea-Fernandez et al. (2019)38 align with the δ202Hg
t versus MeHg regression. Therefore, the initial values of δ202Hg(Sec)4
were determined by regression of the selected tissues of each data set that provided the highest coefficient of determination between δ202Hg
t versus f(MeHg): R2 = 0.96 for the Li et al. (2020) data (n
= 23)36, and R2 = 0.97 for the Bolea-Fernandez et al. (2019)38 data (n = 35) (Fig. 2 and Tables S1 and S2). The initialized δ202Spi values derived from the two regression lines are δ202MeHg = 1.26 ± 0.01‰
and δ202Hg(Sec)
4 = -1.56 ± 0.02‰ for the Li et al. (2020) data36, and δ202MeHg = 1.20 ± 0.01‰ and
δ202Hg(Sec)
6 standard deviations (root mean squared error) accounted for the reported uncertainties of both δ202Hg
t
and f(MeHg) values. The initialized values of δ202MeHg and δ202Hg(Sec)4 are remarkably similar in the
two studies.
Step 2: Estimation of f(Hg(Sec)4) and f(HgSe). The measured δ202Hgt values in the two pilot whale
studies are the weighted averages of the three species-specific δ202MeHg, δ202Hg(Sec)4, and δ202HgSe
values. Therefore, the fractional amounts of Hg(Sec)4 and HgSe in each tissue can be calculated from
Equations 3 and 4.
(f(MeHg) × δ202MeHg) + (f(Hg(Sec)4) × δ202Hg(Sec)4) + (f(HgSe) × δ202HgSe) = δ202Hgt (3)
f(MeHg) + f(Hg(Sec)4) + f(HgSe) = 1 (4)
f(MeHg) is known from chemical measurement. f(Hg(Sec)4) and f(HgSe) were estimated using the
initialized δ202MeHg and δ202Hg(Sec)
4 values obtained from the linear regressions (Fig. 2) and δ202HgSe
= 0.00‰ (Step 1). The estimated values of f(Hg(Sec)4) decreases linearly with increasing f(HgSe) in the
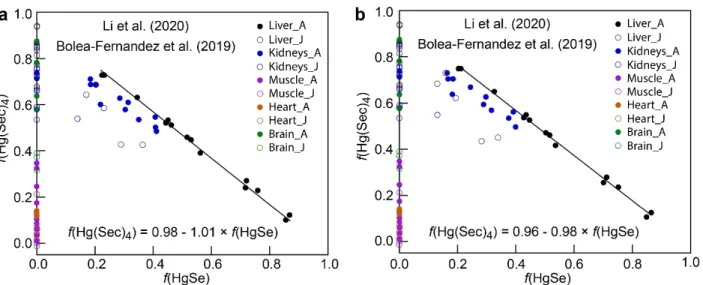
liver of adult pilot whales in both studies (R2 = 0.99, Fig. S1a), which is the tissue with the lowest amounts of MeHg. This result confirms that the tissues behave as a ternary system and further supports the interpretation that Hg(Sec)4 is the precursor to nanoparticulate HgSe.5, 6 f(Hg(Sec)4) and f(HgSe)
also covary negatively in the kidneys of adult pilot whales and in the livers of juveniles (Fig. S1a), but the coefficient of determination between f(Hg(Sec)4) and f(HgSe) is lower if these tissues are included
because they contain more MeHg than the livers of adult whales. The liver tissue of the Li et al. (2020)36
study that was an outlier (Fig. 1a) is not presented in Figure S1a, as the estimated f(Hg(Sec)4) and
f(HgSe) were outside the feasible range (f(Hg(Sec)4) = -0.18, f(HgSe) = 1.07).
Step 3: Calculation of δ202Sp
i, f(Hg(Sec)4), and f(HgSe) by alternating regularized inversion.
7
1 4,1 1
2 4,2 2
4,
(MeHg ) (Hg(Sec) ) (HgSe )
(MeHg ) (Hg(Sec) ) (HgSe )
...
(MeHg ) (Hg(Sec)n n) (HgSe )n
f f f f f f f f f A 202 202 4 202 δ MeHg δ Hg(Sec) δ HgSe = x 202 1 202 2 202 δ Hg δ Hg .. δ Hgn b (5)
where n is the number of tissue samples. Calculating δ202Spi when f(Spi,t) and δ202Hgt are known from
speciation measurements (e.g., HR-XANES) and isotopic measurements is a well-posed inverse problem.41 The column vector x is obtained by minimizing the misfit functional φ(x), or residual, that quantifies the difference between the predicted (x) and the observed (b) isotopic data
2 T 1
d
( )
=
=
(
)
−(
)
x
Ax - b
Ax - b C
Ax - b
(6)where (Ax-b)T denotes the transpose of the vector (Ax-b) and -1
d
C
is the inverse matrix of the squared standard deviations of the isotopic measurements. Isotopic measurements are independent and therefore the input covariance Cd matrix is diagonal and contains the measurement uncertainties of δ202Hgt. Theunknown vector x is obtained at the minimum of the objective functional φ(x), which is equivalent to zero its first derivative.
Here, only f(MeHg) and δ202Hgt are known and therefore the problem is ill-posed with non-unique
mathematical solutions. Notwithstanding, a chemically meaningful solution to δ202Spi and to the
tissue-specific proportions of Hg(Sec)4 and HgSe can be obtained simultaneously by an alternating regularized
inversion method.40 The approach necessitates addition of a regularization term to the objective
function.
2 T 1 T
d
( )
=
=
(
)
−(
)
+
x
Ax - b
Ax - b C
Ax - b
x x
(7)The regularization term xTx allows one to penalize large (i.e., meaningless) values in x and is weighted
by the user-defined λ parameter. The weighting parameter λ was determined using the so-called L-curve criterion defined as
8
λ = 0.01 × max
(
A C A
T d−1)
(8)for both the Li et al. (2020)36 and the Bolea-Fernandez et al. (2019)38 data sets, which is a reasonable value for inverse problems.42 Using the notation in Eq. 7, the optimal x value, as obtained by zeroing
the first derivative of the objective function, is
T 1 -1 T 1
d d
[
−]
−=
+
x
A C A
I A C b
(9)where I is the identity matrix.
The workflow schematic for the inversion calculations is presented in Fig. 3 and the Python code is available in the Supporting Information and has been deposited in the GRICAD GitLab’s site.43 First,
the inversion scheme starts with an a priori estimate of δ202Spi (initialization Step 1 described above),
in which δ202MeHg and δ202Hg(Sec)4 are the values obtained from the δ202Hgt versus f(MeHg) regression
(Fig. 2) and δ202HgSe is set to 0‰. Second, a two-step alternating reconstruction is performed, in which f(Hg(Sec)4) and f(HgSe) are obtained from Eq. 3 and 4 using the preset δ202Spi values (Step 2), and
δ202Sp
i is calculated next from Eq. 9 using the previously calculated f(Hg(Sec)4) and f(HgSe) values
(Step 3). The two variable sets are updated alternatively at each step of the leap-frog process until φ(x) converges to a minimum.
The linear system in Step 2 is well-posed and always provides a unique solution. However, f(Hg(Sec)4) and f(HgSe) may be negative or >1 if the a priori δ202Spi values are unrealistic. When this
is the case, the algorithm automatically projects the unacceptable fractions onto a user-defined admissible range. In the pilot whale data analyzed here, it was observed that a small negative value of f(Hg(Sec)4) and f(HgSe) equal to the uncertainty of the known f(MeHg) value (e.g., ± 0.05) did not
prevent global convergence. The number of iterations in the inner loop increased from 513 to 533 for the Li et al. (2020) data,36 and from 231 to 237 for the Bolea-Fernandez et al. (2019) data,38 when the criterion of the upper and lower limits for f(Hg(Sec)4) and f(HgSe) was changed from ± 0.01 to ± 0.05,
9 but the optimal δ202Sp
i, f(Hg(Sec)4), and f(HgSe) values were identical with the two criteria. The
reliability of the iterative method was also evaluated by varying the initial estimate of δ202HgSe. The reconstruction algorithm converged to the same solution when the initial δ202HgSe values for the Li et al. (2020)36 and the Bolea-Fernandez et al. (2019)38 data sets were set to the experimental value of the liver tissue containing the lowest proportion of MeHg (f(MeHg) = 0.043, δ202HgSe = -0.32‰ and f(MeHg) = 0.009, δ202HgSe = -0.35‰, respectively, Tables S1 and S2).
The optimal solutions are δ202MeHg = 1.23‰, δ202Hg(Sec)4 = -1.46‰, δ202HgSe = 0.00‰ for the Li
et al. (2020)36 data, and δ202MeHg = 1.17‰, δ202Hg(Sec)4 = -1.29‰, δ202HgSe = 0.00‰ for the
Bolea-Fernandez et al. (2019)38 data. The δ202MeHg and δ202Hg(Sec)4 values are in good agreement with those
derived from the regression analysis in the initialization step; 1.26‰ and 1.20‰ for δ202MeHg and -1.56‰ and -1.33‰ for δ202Hg(Sec)
4 for the Li et al. (2020)36 data and Bolea-Fernandez et al. (2019)38
data, respectively. The alternating inversion method quantifies δ202HgSe, whereas the δ202Hgt versus
f(MeHg) analysis (Step 1) only provides an estimate of δ202HgSe. Formal uncertainties cannot be calculated on species-specific δ202Hg values because the alternating inversion scheme is in essence nonlinear and due to the regularization term (λxTx). To estimate accuracy of the alternating inversion method, the δ202Sp
i values were calculated using the two independent data sets together (n = 89) and
compared with the results presented above on each data set. Analyzed together, the δ202Spi values
(δ202MeHg = 1.21‰, δ202Hg(Sec)
4 = -1.37‰, and δ202HgSe = 0.00‰) quantify that the uncertainty in
the calculated δ202Sp
i values is < 0.1‰.
Proportions of the Hg species in pilot whale tissues. The proportions of MeHg, Hg(Sec)4, and
HgSe (f(Spi)) in long-finned pilot whale tissues of Li et al. (2020)36 (n = 34) and Bolea-Fernandez et al.
(2019)38 (n = 55) are reported in Tables S1 and S2 and presented graphically in Figure 4. The sum of the proportions of Hg species being normalized to 1 (Eq. 4), the f(Spi) values define a hyperplane within
10 hyperplane within an equilateral triangle with one Hg species at each vertice. The two triangles obtained with the Li et al. (2020)36 and the Bolea-Fernandez et al. (2019)38 data sets are represented in a three-dimensional space in Figure 4a with δ202Hgt as the third dimension. The two triangles are practically
superimposed in this space, which confirms the high consistency between the two independent data sets. A two-dimensional projection of the two f(Spi) ternary diagrams is shown in Figure 4b. Tissues of
the pilot whales organize into three classes based on mercury species distribution. First, in the heart and muscle tissues of juvenile and adult whales, mercury is primarily present as MeHg with a low fraction as Hg(Sec)4 and no HgSe. Second, in the brain of both juvenile and adult whales and most juvenile
kidneys tissues, mercury is present as a mixture of MeHg and Hg(Sec)4. Third, in adult kidneys and
both juvenile and adult liver tissues, mercury is present as minor MeHg and a mixture of both Hg(Sec)4
and HgSe. When evaluated in context of the total concentration of mercury ([Hg]tot) in tissues, the
fluctuations in f(Spi) with increasing [Hg]tot document the step-wise MeHg → Hg(Sec)4 → HgSe
demethylation reaction (Fig. 5a-5c). f(MeHg) decreases and f(HgSe) increases with the extent of the reaction, which progresses with [Hg]tot, and f(Hg(Sec)4) exhibits a unimodal behavior reflecting the
intermediate species of the reaction. f(Hg(Sec)4) and f(HgSe) covary negatively (Fig. S1b), similar to
the observed trend between estimates of f(Hg(Sec)4) and f(HgSe) from the initialization step (Step 1,
Fig. S1a). The correlation between f(Hg(Sec)4) and f(HgSe) reflects the biomineralization of
nanoparticulate HgSe from precursor Hg(Sec)4.5, 6 Further, the ratios of f(Spi) values for the MeHg →
Hg(Sec)4 reaction (f(Hg(Sec)4)/f(MeHg)) and Hg(Sec)4 → HgSe reaction (f(HgSe)/f(Hg(Sec)4)) are
diagnostic of the extent of the two step reaction (Fig. 5d and 5e). Across all tissues, f(Hg(Sec)4)/f(MeHg)
is greater in adult compared to juvenile whales for a given tissue and exhibit a hierarchy of heart < muscle < brain < kidneys < liver (Fig. 5d). Similarly, of the tissues with HgSe, f(HgSe)/f(Hg(Sec)4) is
11 The weight concentrations of the three Hg species are obtained by multiplying f(Spi) by [Hg]tot and
are presented in Figure 6 for each tissue in ascending order of [Hg]tot. Trends in weighted concentrations
of the three Hg species highlight two notable observations. First, the high abundance of Hg(Sec)4 in the
brain of juvenile and adult whales, compared to the muscle and heart of similar [Hg]tot (Fig. 6a-c),
suggests that the brain is better protected against Hg toxicity than muscular tissues. An evaluation of the ratio of Hg to Se (Hg:Seeff), accounting for the stoichiometric ratio of Hg(Sec)4 (1:4),6 indicates that
the demethylation of MeHg in the adult whale brain could deplete bioavailable reservoirs of Se (1.1 < Hg:Seeff < 3.1) (Tables S1 and S2). It is likely, however, that the brains of adult whales contain
polynuclear Hgx(Se,Sec)y clusters rather than strict mononuclear Hg(Sec)4 complexes, the former
observed in waterbird5 and seabird6 and understood to represent an intermediate in the biomineralization of HgSe from Hg(Sec)4. Hgx(Se,Sec)y clusters have 1 < Hg:Se < 4, therefore omitting this species in the
estimation of Hg:Seeff underestimates the amount of bioavailable Se.6 The possible neurotoxic effects
of Se deficiency due to MeHg demethylation require further study. Second, the primary locations for the detoxification of MeHg are the liver, kidneys, and brain, and the accumulation of demethylated species (Hg(Sec)4 and HgSe) account for Hg burden in these tissues (Fig. 6). In the kidneys and liver of
whales, where the MeHg → Hg(Sec)4 → HgSe demethylation reaction is most advanced, there is no
apparent threshold Hg concentration above which the demethylation of MeHg into Hg(Sec)4 and HgSe
is initiated. In contrast, a demethylation threshold of approximately 8.5 mg Hg/kg dry weight (dw) has been reported in the liver of waterbirds.44 This may reflect the greater availability of selenium in marine systems that yield efficient MeHg → Hg(Sec)4 demethylation across broad tissues.36, 38
To put into context the Hg speciation results in long-finned pilot whales, a diagrammatic picture of the average concentrations and speciation of Hg in the tissues of whales juveniles and adults (Fig. S2a,b) are compared to those obtained recently in giant petrel (Macronectes spp) using HR-XANES (Fig. S2c).6 Petrels are top predator of food webs and scavengers of mammal and bird carcasses, and therefore
12 contain similar amounts of mercury as long-finned pilot whales. In petrel, HgSe occurs not only in liver and kidneys, but also in brain and muscle. Almost all the Hg is in the form of HgSe in liver, and the brain contains 38 ± 32% HgSe, despite having less Hg (5.9 ± 6.4 mg/kg dw) than the whales brains from the Li et al.(2020)36 study (13.8 ± 7.9 mg/kg dw). Overall, petrels seem to detoxify MeHg more efficiently than long-finned pilot whales, for reasons yet to be known, making life apparently more compatible with such high contaminant burden.
CONCLUDING REMARKS
We demonstrated that the atomic-level biochemistry of toxic methylmercury (MeHg) and its degradation products in biological tissues can be obtained by a mathematical treatment of the Hg isotope data using an iterative regularization method. Inversion methods are used in many fields of science,41, 45 but this is the first application with stable isotopic data. The algorithm, which we developed, was
used to probe the internal transformations of mercury in the liver, kidneys, muscle, heart, and brain of long-finned pilot whales. We showed that the hockey stick shape of the δ202Hgt versusf(MeHg) graph
of whale tissues reflects the step-wise MeHg → Hg(Sec)4 → HgSe reaction and metabolic processes
leading to a change of Hg speciation in and across tissues. The isotopic data can be explained by the coexistence of MeHg with two inorganic species, Hg(Sec)4 and HgSe, with uniform isotopic signatures:
δ202MeHg = 1.21 ± 0.04‰, δ202Hg(Sec)
4 = -1.37 ± 0.09‰, and δ202HgSe = 0.00 ± 0.00‰. The
δ202Hg(Sec)
4 - δ202MeHg difference of 2.58 ± 0.13‰ is similar to that reported recently for birds (-2.2
± 0.1‰).37
A highlight of this study is the invariance of the three δ202Sp
i values between the tissues of a same
individual, across individuals of the same pod, and between pods sampled at different times in different geographic locations. A similar observation was made previously for the uniformity of δ202Hg in the
blood of 7 juvenile and 7 adult whales (δ202Hg
13 blood results and the linear relationship of δ202Hg with f(MeHg) in the heart, brain, and muscle of whales
(Fig. 1a,b) to indicate that the isotopic composition of MeHg is constantly homogenized throughout the body. The isotopic equilibrium of MeHg reported here agrees with the rapid shifts in Hg isotope values of fish tissues to values of dietary MeHg.46
We explain the steady state isotopic fractionation of Hg(Sec)4 and HgSe by (1) a continuous input of
isotopically constant MeHg source from the diet, (2) continuous exchange of MeHg and Hg(Sec)4
between the circulatory system and tissues, and (3) the rapid turnover of Hg-carrying proteins and elimination of Hg in urine and feces. The circulation of Hg(Sec)4 in whale blood is supported
experimentally by the analysis of Se-containing proteins in the plasma of Inuits, which showed that up to 50% of Hg is associated with SelP.47 Blood isotopic analysis offers suggestive evidence for the presence of Hg(Sec)4 in the circulatory system. In whales studied by Bolea-Fernandez et al. (2019),38
δ202Hg
blood = 1.06 ± 0.05‰ while δ202MeHg obtained in all tissues by the alternating regularized
inversion is 1.17‰. The circulation of Hg(Sec)4 in the blood at 4% of the total Hg concentration could
account for the 0.11‰ difference observed between the δ202Hgblood and δ202MeHg. In conclusion, this
study establishes the possibility to probe the atomic-level chemistry of mercury in animal tissues from species-averaged isotopic data and f(MeHg) alone, without complementary structural information from HR-XANES spectroscopy. This approach will facilitate advancement of the next generation of toxicokinetic models for mercury across diverse organisms.
ASSOCIATED CONTENT Supporting Information
The Supporting Information is available free of charge on the ACS Publications website at DOI: Supplementary table and figures (PDF)
14 ReadMe of RegInv-202Hg (txt)
Input files of RegInv-202Hg (tx) Input datasets (txt) AUTHOR INFORMATION Corresponding Author E-mail: alain.manceau@univ-grenoble-alpes.fr ORCID Alain Manceau: 0000-0003-0845-611X Romain Brossier: 0000-0002-7195-8123 Brett A. Poulin: 0000-0002-5555-7733 Notes
The authors declare no competing financial interests.
ACKNOWLEDGMENTS
Financial support was provided to Brett A. Poulin by the U.S. National Science Foundation under grant EAR-1629698.
REFERENCES
(1) Douglas, T. A.; Loseto, L. L.; Macdonald, R. W.; Outridge, P.; Dommergue, A.; Poulain, A.; Amyot, M.; Barkay, T.; Berg, T.; Chetelat, J.; Constant, P.; Evans, M.; Ferrari, C.; Gantner, N.; Johnson, M. S.; Kirk, J.; Kroer, N.; Larose, C.; Lean, D.; Nielsen, T. G.; Poissant, L.; Rognerud, S.; Skov, H.; Sorensen, S.; Wang, F. Y.; Wilson, S.; Zdanowicz, C. M. The fate of mercury in Arctic terrestrial and aquatic ecosystems, a review. Environmental Chemistry 2012, 9, 321-355.
15 (2) Driscoll, C. T.; Mason, R. P.; Chan, H. M.; Jacob, D. J.; Pirrone, N. Mercury as a global pollutant: Sources, pathways, and effects. Env. Sci. Technol. 2013, 47, 4967-4983.
(3) Lehnherr, I. Methylmercury biogeochemistry: a review with special reference to Arctic aquatic ecosystems. Environ. Rev. 2014, 22, 229-243.
(4) Eagles-Smith, C. A.; Silbergeld, E. K.; Basu, N.; Bustamante, P.; Diaz-Barriga, F.; Hopkins, W. A.; Kidd, K. A.; Nyland, J. F. Modulators of mercury risk to wildlife and humans in the context of rapid global change. Ambio 2018, 47, 170-197.
(5) Manceau, A.; Bourdineaud, J. P.; Oliveira, R. B.; Sarrazin, S. L. F.; Krabbenhoft, D. P.; Eagles-Smith, C. A.; Ackerman, J. T.; Stewart, A. R.; Ward-Deitrich, C.; Busto, M. E. D.; Goenaga-Infante, H.; Wack, A.; Retegan, M.; Detlefs, B.; Glatzel, P.; Bustamante, P.; Nagy, K. L.; Poulin, B. A. Demethylation of methylmercury in bird, fish, and earthworm. Environ. Sci. Technol. 2021, 55, 1527-1534.
(6) Manceau, A.; Gaillot, A. C.; Glatzel, P.; Cherel, Y.; Bustamante, P. In vivo formation of HgSe nanoparticles and tetraselenolate complex from methylmercury in seabird – Implications for the Hg-Se antagonism. Environ. Sci. Technol. 2021, 55, 1515-1526.
(7) Manceau, A.; Azemard, S.; Hédouin, L.; Vassileva, E.; Lecchini, D.; Fauvelot, C.; Swarzenski, P. W.; Glatzel, P.; Bustamante, P.; Metian, M. The chemical forms of mercury in blue marlin billfish: Implications for human exposure. Environ. Sci.. Technol. Lett. 2021, 8, 405-411.
(8) Arai, T.; Ikemoto, T.; Hokura, A.; Terada, Y.; Kunito, T.; Tanabe, S.; Nakai, I. Chemical forms of mercury and cadmium accumulated in marine mammals and seabirds as determined by XAFS analysis. Environ. Sci. Technol. 2004, 38, 6468-6474.
(9) Nakazawa, E.; Ikemoto, T.; Hokura, A.; Terada, Y.; Kunito, T.; Tanabe, S.; Nakai, I. The presence of mercury selenide in various tissues of the striped dolphin: evidence from -XRF-XRD and XAFS analyses. Metallomics 2011, 3, 719-725.
16 (10) Lailson-Brito, J.; Cruz, R.; Dorneles, P. R.; Andrade, L.; Azevedo, A. D.; Fragoso, A. B.; Vidal, L. G.; Costa, M. B.; Bisi, T. L.; Almeida, R.; Carvalho, D. P.; Bastos, W. R.; Malm, O. Mercury-selenium relationships in liver of Guiana dolphin: The possible role of Kupffer cells in the detoxification process by tiemannite formation. Plos One 2012, 7, n° e42162.
(11) Sakamoto, M.; Itai, T.; Yasutake, A.; Iwasaki, T.; Yasunaga, G.; Fujise, Y.; Nakamura, M.; Murata, K.; Chan, H. M.; Domingo, J. L.; Marumoto, M. Mercury speciation and selenium in toothed-whale muscles. Environ. Res. 2015, 143, 55-61.
(12) Gajdosechova, Z.; Lawan, M. M.; Urgast, D. S.; Raab, A.; Scheckel, K. G.; Lombi, E.; Kopittke, P. M.; Loeschner, K.; Larsen, E. H.; Woods, G.; Brownlow, A.; Read, F. L.; Feldmann, J.; Krupp, E. M. In vivo formation of natural HgSe nanoparticles in the liver and brain of pilot whales. Sci. Rep. 2016, 6, 34361.
(13) Harris, H. H.; Pickering, I. J.; George, G. N. The chemical form of mercury in fish. Science 2003, 301, 1203.
(14) Kuwabara, J. S.; Arai, Y.; Topping, B. R.; Pickering, I. J.; George, G. N. Mercury speciation in piscivorous fish from mining-impacted reservoirs. Environ. Sci. Technol. 2007, 41, 2745-2749.
(15) Huggins, F. E.; Raverty, S. A.; Nielsen, O. S.; Sharp, N. E.; Robertson, J. D.; Ralston, N. V. C. An XAFS investigation of mercury and selenium in Beluga whale tissues. Environ. Bioindic. 2009, 4, 291-302.
(16) George, G. N.; MacDonald, T. C.; Korbas, M.; Singh, S. P.; Myers, G. J.; Watson, G. E.; O'Donoghue, J. L.; Pickering, I. J. The chemical forms of mercury and selenium in whale skeletal muscle. Metallomics 2011, 3, 1232-1237.
(17) Korbas, M.; O'Donoghue, J. L.; Watson, G. E.; Pickering, I. J.; Singh, S. P.; Myers, G. J.; Clarkson, T. W.; George, G. N. The chemical nature of mercury in human brain following poisoning or environmental exposure. ACS Chem. Neurosci. 2010, 1, 810-818.
17 (18) MacDonald, T. C.; Korbas, M.; James, A. K.; Sylvain, N. J.; Hackett, M. J.; Nehzati, S.; Krone, P. H.; George, G. N.; Pickering, I. J. Interaction of mercury and selenium in the larval stage zebrafish vertebrate model. Metallomics 2015, 7, 1247-1255.
(19) Manceau, A.; Enescu, M.; Simionovici, A.; Lanson, M.; Gonzalez-Rey, M.; Rovezzi, M.; Tucoulou, R.; Glatzel, P.; Nagy, K. L.; Bourdineaud, J.-P. Chemical forms of mercury in human hair reveal sources of exposure. Environ. Sci. Technol. 2016, 50, 10721–10729.
(20) Thomas, S. A.; Gaillard, J. F. Cysteine addition promotes sulfide production and four-fold Hg(II)-S coordination in actively metabolizing Escherichia coli. Environ. Hg(II)-Sci. Technol. 2017, 51, 4642-4651. (21) Thomas, S. A.; Rodby, K. E.; Roth, E. W.; Wu, J.; Gaillard, J. F. Spectroscopic and microscopic evidence of biomediated HgS species formation from Hg(II)–cysteine complexes: Implications for Hg(II) bioavailability. Environ. Sci. Technol. 2018, 52, 10030-10039.
(22) Thomas, S. A.; Mishra, B.; Myneni, S. C. B. Cellular mercury coordination environment, and not cell surface ligands, influence bacterial methylmercury production. Environ. Sci. Technol. 2020, 54, 3960-3968.
(23) Pickering, I. J.; Cheng, Q.; Rengifo, E. M.; Nehzati, S.; Dolgova, N. V.; Kroll, T.; Sokaras, D.; George, G. N.; Arner, E. S. J. Direct observation of methylmercury and auranofin binding to selenocysteine in thioredoxin reductase. Inorg Chem. 2020, 59, 2711-2718.
(24) Bourdineaud, J. P.; Durn, G.; Režun, B.; Manceau, A.; Hrenović, J. The chemical species of mercury accumulated by Pseudomonas idrijaensis, a bacterium from a rock of the Idrija mercury mine, Slovenia. Chemosphere 2020, 248, n° 126002.
(25) Minet, A.; Manceau, A.; Valada-Mennuni, A.; Brault-Favrou, M.; Churlaud, C.; Fort, J.; Nguyen, T. C.; Spitz, J.; Bustamante, P.; Lacoue-Labarthe, T. Mercury in the tissues of five cephalopods species: first data on the nervous system Sci. Tot. Environ. 2021, 759, n° 143907.
18 (26) Manceau, A.; Nagy, K. L.; Glatzel, P.; Bourdineaud, J. P. Acute toxicity of divalent mercury to bacteria explained by the formation of dicysteinate and tetracysteinate complexes bound to proteins in Escherichia coli and Bacillus subtilis. Environ. Sci. Technol. 2021, 55, 3612-3623.
(27) Eiler, J. M.; Bergquist, B.; Bourg, I.; Cartigny, P.; Farquhar, J.; Gagnon, A.; Guo, W. F.; Halevy, I.; Hofmann, A.; Larson, T. E.; Levin, N.; Schauble, E. A.; Stolper, D. Frontiers of stable isotope geoscience. Chem. Geol. 2014, 372, 119-143.
(28) Sherman, L. S.; Blum, J. D.; Franzblau, A.; Basu, N. New insight into biomarkers of human mercury exposure using naturally occurring mercury stable isotopes. Environ. Sci. Technol. 2013, 47, 3403-3409.
(29) Li, M. L.; Sherman, L. S.; Blum, J. D.; Grandjean, P.; Mikkelsen, B.; Weihe, P.; Sunderland, E. M.; Shine, J. P. Assessing sources of human methylmercury exposure using stable mercury isotopes. Environ. Sci. Technol. 2014, 48, 8800-8806.
(30) Blum, J. D.; Sherman, L. S.; Johnson, M. W. Mercury isotopes in Earth and environmental sciences. In Annu. Rev. Earth Planet. Sci., Jeanloz, R., Ed. 2014; Vol. 42, pp 249-269.
(31) Wiederhold, J. G. Metal stable isotope signatures as tracers in environmental geochemistry. Environ. Sci. Technol. 2015, 2606-2624.
(32) Renedo, M.; Amouroux, D.; Duval, B.; Carravieri, A.; Tessier, E.; Barre, J.; Berail, S.; Pedrero, Z.; Cherel, Y.; Bustamante, P. Seabird tissues as efficient biomonitoring tools for Hg isotopic investigations: Implications of using blood and feathers from chicks and adults. Environ. Sci. Technol.
2018, 52, 4227-4234.
(33) Renedo, M.; Pedrero, Z.; Amouroux, D.; Cherel, Y.; Bustamante, P. Mercury isotopes of key tissues document mercury metabolic processes in seabirds. Chemosphere 2021, 263, n° 127777. (34) Tsui, M. T. K.; Blum, J. D.; Kwon, S. Y. Review of stable mercury isotopes in ecology and biogeochemistry. Sci. Tot. Environ. 2020, 716.
19 (35) Perrot, V.; Masbou, J.; Pastukhov, M. V.; Epov, V. N.; Point, D.; Berail, S.; Becker, P. R.; Sonke, J. E.; Amouroux, D. Natural Hg isotopic composition of different Hg compounds in mammal tissues as a proxy for in vivo breakdown of toxic methylmercury. Metallomics 2016, 8, 170-178.
(36) Li, M. L.; Juang, C. A.; Ewald, J. D.; Yin, R. S.; Mikkelsen, B.; Krabbenhoft, D. P.; Balcom, P. H.; Dassuncao, C.; Sunderland, E. M. Selenium and stable mercury isotopes provide new insights into mercury toxicokinetics in pilot whales. Sci. Tot. Environ. 2020, 710, n° 136325.
(37) Poulin, B. A.; Janssen, S. E.; Rosera, T. J.; Krabbenhoft, D. P.; Eagles-Smith, C. A.; Ackerman, J. T.; Stewart, A. R.; Kim, E.; Baumann, Z.; Kim, J. H.; Manceau, A. Isotope fractionation from in vivo methylmercury detoxification in waterbirds. ACS Earth Space Chem. 2021, 5, 990-997.
(38) Bolea-Fernandez, E.; Rua-Ibarz, A.; Krupp, E. M.; Feldmann, J.; Kvanhaecke, F. High-precision isotopic analysis sheds new light on mercury metabolism in long-finned pilot whales (Globicephala melas). Sci. Rep. 2019, 9, n° 7262.
(39) Virieux, J.; Operto, S. An overview of full-waveform inversion in exploration geophysics. Geophysics 2009, 74, WCC1-WCC26.
(40) Rizzuti, G.; Gisolf, A. An iterative method for 2D inverse scattering problems by alternating reconstruction of medium properties and wavefields: theory and application to the inversion of elastic waveforms. Inverse Probl. 2017, 33.
(41) Tarantola, A. Inverse Problem Theory and Methods for Model Parameter Estimation. Society for Industrial and Applied Mathematics, Philadelphia: 2005; p 342.
(42) Calvetti, D.; Morigi, S.; Reichel, L.; Sgallari, F. Tikhonov regularization and the L-curve for large discrete ill-posed problems. J. Comput. Appl. Math. 2000, 123, 423-446.
(43) Manceau, A.; Brossier, R.; Poulin, B. A. Alternating inversion. GRICAD GitLab 2021,
20 (44) Eagles-Smith, C. A.; Ackerman, J. T.; Yee, J.; Adelsbach, T. L. mercury demethylation in waterbird livers: dose-response thresholds and differences among species. Environ. Toxicol. Chem.
2009, 28, 568-577.
(45) Kaipio, J.; Somersalo, E. Statistical and computational inverse problems. . Springer.: New York, NY, 2010.
(46) Kwon, S. Y.; Blum, J. D.; Chirby, M. A.; Chesney, E. J. Application of mercury isotopes for tracing trophic transfer and internal distribution of mercury in marine fish feeding experiments. Environ. Toxicol. Chem. 2013, 32, 2322-2330.
(47) Achouba, A.; Dumas, P.; Ouellet, N.; Lemire, M.; Ayotte, P. Plasma levels of selenium-containing proteins in Inuit adults from Nunavik. Environ. Intern. 2016, 96, 8-15.
FIGURE CAPTION
Fig. 1. Relationship between δ202Hg and f(MeHg) in long-finned pilot whales tissues. (a) Li et al. (2020)36 data. (b) Bolea-Fernandez et al. (2019)38 data. Filled and open data points are tissues from adult (A) and juvenile (J) pilot whales, respectively. Error bars present the associated error of measured δ202Hg. In plot (a) the arrow identifies an outlier.
Fig. 2. Selection of long-finned pilot whales tissues giving the best linear regression between δ202Hg and f(MeHg). (a) Li et al. (2020)36 data. δ202Hg = -1.56 + 2.82 × f(MeHg) (R2 = 0.96). (b) Bolea-Fernandez et al. (2019)38 data. δ202Hg = -1.33 + 2.53 × f(MeHg) (R2 = 0.97). Filled and open data points are tissues from adult (A) and juvenile (J) pilot whales, respectively. Error bars present the associated error of measured δ202Hg.
21
Fig. 3. Workflow of the alternating regularized inversion algorithm used to calculate 202Sp
i from 202Hgt
and f(MeHg). Step 1: initialization of δ202Spi from the δ202Hgt versus f(MeHg) data. Step 2: regression
analysis of f(Hg(Sec)4) and f(HgSe) with fixed δ202Spi values. Step 3: inversed calculation41 of δ202Spi
with fixed f(Hg(Sec)4) and f(HgSe) values. Steps 2 and 3 are repeated with f(Hg(Sec)4), f(HgSe), δ202Spi
re-assigned new values at every iteration until convergence is reached.
Fig. 4. Proportions of the three Hg species (f(Spi)) in tissues of long-finned pilot whales as calculated with the alternating regularized inversion method. (a) Three-dimensional view of the ternary planes defined given by f(MeHg), f(Hg(Sec)4), and f(HgSe) with δ202Hgt as the third dimension. Cyan color
refers to the Li et al. (2020)36 data set and magenta color refers to the Bolea-Fernandez et al. (2019)38 data set. (b) Two-dimensional projection of the two ternary planes.
Fig. 5. Proportions of the three Hg species (a) f(MeHg), (b) f(Hg(Sec)4), (c) f(HgSe)) as a function of
the total Hg concentration ([Hg]tot). Box plots of median and quartile ranges of the ratio of (d)
f(Hg(Sec)4) to f(MeHg) and (e) f(HgSe) to f(HgSec)4 for juvenile (open) and adult (filled) whale tissues.
In plots (d) and €, error bars represent 10% and 90% percentiles and outliers are shown as data points.
Fig. 6. Stacked bar charts of the concentrations (dry weight, dw) of the three Hg species (Spi) in the heart (a), muscle (b), brain (c), kidneys (d), and liver (e) of long-finned pilot whales. Concentrations were determined using the proportions of Hg species (f(Spi)) determined by the alternating regularized
inversion method and total Hg concentration published in Li et al. (2020)36 and Bolea-Fernandez et al. (2019).38 In each sub-plot, tissues are presented in ascending order of total Hg concentration and the vertical dashed line identifies the separation between juvenile and adult whales. The asterisk in plot d indicates a juvenile whale.
22
23
24
25
26
27
Supplementary Information
Chemical Forms of Mercury in Pilot Whales Determined from Species-Averaged Mercury Isotope Signatures
Alain Manceau,1,* Romain Brossier, 1,* and Brett A. Poulin2
1Université Grenoble Alpes, ISTerre, CNRS, 38000 Grenoble, France
2Department of Environmental Toxicology, University of California Davis, Davis, CA 95616, USA
Supplementary Figures
Figure S1. Relationship between f(Hg(Sec)4) and f(HgSe) estimated from the regression analysis
(a) and calculated from the alternating regularized inversion method (b) using the δ202Hgt versus
f(MeHg) data (Fig. 2) of Li et al.1 and Bolea-Fernandez et al.2. In plot a, δ202MeHg = 1.26‰,
δ202Hg(Sec)4 = -1.56‰, δ202HgSe = 0.00‰ for the Li et al.1 data, and δ202MeHg = 1.20‰, δ202Hg(Sec)4
= -1.33‰, δ202HgSe = 0.00‰ for the Bolea-Fernandez et al.2 data. In plot b, δ202MeHg = 1.23‰,
δ202Hg(Sec)4 = -1.46‰, δ202HgSe = 0.00‰ for the Li et al.1 data, and δ202MeHg = 1.17‰, δ202Hg(Sec)4
Figure S2. Diagrammatic pictures of the average concentration (dry weight, dw) and speciation of Hg in tissues of long-finned pilot whales and giant petrel. a Li et al.1 data. b Bolea-Fernandez et
al.2 data. c Manceau et al.3 data. Cys and Sec stand for cysteine and selenocysteine residues within a
polymeric chain of peptide or protein, not for free amino acids. The numbers in parentheses are the standard deviations, and n is the number of individuals. d Ball-and-stick representations of the linear
coordination of Hg in MeHgCys and its four-fold coordination to selenocysteine in Hg(Sec)4, and
portion of the HgSe structure. Dark red, purple, yellow, gray, and light gray spheres represent Hg, Se, S, C, and H, respectively.
Supplementary Tables
Table S1. Total Hg concentration ([Hg]tot) and Hg isotopic composition measured by Li et al.1, the
%MeHg, %Hg(Sec)4, and %HgSe calculated by alternated regularized inversion, and the effective
Hg:Se (Hg:Seeff).
Age Tissue [Hg]tot
dw (ppm) δ202Hg (‰) Std %MeHg %Hg(Sec)4a %HgSea Hg/Seeff
Juvenile Brain 3.1 0.36 0.03 62.7 37.3 0.0 0.30 Juvenile Brain 1.0 0.43 0.03 61.0 39.0 0.0 0.06 Juvenile Brain 2.8 0.23 0.03 68.4 31.6 0.0 0.23 Adult Brain 9.4 -0.37 0.03 42.2 57.8 0.0 1.05 Adult Brain 25.3 -1.28 0.03 12.5 87.5 0.0 3.06 Adult Brain 12.4 -0.83 0.03 21.8 78.2 0.0 1.93 Adult Brain 8.1 -0.77 0.03 36.3 63.7 0.0 1.06 Juvenile Heart 5.3 0.98 0.08 92.8 7.2 0.0 0.05 Juvenile Heart 1.6 1.05 0.04 96.6 3.4 0.0 0.00 Juvenile Heart 5.0 0.88 0.02 96.3 3.7 0.0 0.02 Adult Heart 10.6 0.95 0.03 88.2 11.8 0.0 0.12 Adult Heart 10.7 0.65 0.04 88.1 12.0 0.0 0.15 Adult Heart 8.8 0.72 0.09 88.1 11.9 0.0 0.11 Adult Heart 7.1 0.92 0.04 86.0 14.0 0.0 0.10 Juvenile Muscle 8.3 1.08 0.09 101.4 -1.4 0.0 0.00 Juvenile Muscle 3.3 1.37 0.02 98.4 1.6 0.0 0.01 Juvenile Muscle 7.7 1.12 0.02 95.6 4.4 0.0 0.17 Adult Muscle 12.9 1.10 0.09 94.0 6.0 0.0 0.28 Adult Muscle 15.9 0.97 0.09 82.5 17.5 0.0 1.00 Adult Muscle 12.2 1.16 0.02 91.5 8.5 0.0 0.35 Adult Muscle 11.0 1.20 0.02 96.5 3.5 0.0 0.11 Juvenile Kidney 20.4 -1.01 0.09 16.4 83.6 0.0 0.74 Juvenile Kidney 5.4 -0.68 0.06 18.5 62.1 19.4 0.21 Juvenile Kidney 13.7 -0.91 0.09 26.9 73.1 0.0 0.48 Adult Kidney 26.1 -0.71 0.09 18.0 63.8 18.2 0.82 Adult Kidney 58.9 -0.67 0.02 9.0 53.5 37.5 1.03 Adult Kidney 36.7 -0.87 0.09 8.7 66.9 24.4 1.01 Adult Kidney 44.1 -0.69 0.04 11.5 56.9 31.6 0.71 Juvenile Liver 134.3 -0.93 0.04 11.1 73.1 15.8 2.00
Juvenile Liver 10.1 -0.40 0 21.0 45.1 33.8 0.70 Juvenile Liver 63.7 -0.77 0.04 18.6 68.4 13.0 1.74 Adult Liver 439.0 -0.55 0.03 4.7 41.7 53.6 1.42 Adult Liver 870.8 -0.10 0 4.5 10.6 84.9 1.20 Adult Liver 446.0 -0.32 0.04 4.3 25.6 70.1 1.42 Adult Liver 281.3 0.33 0 8.0 -15.8 107.8 --
aValues obtained with λ = 0.01. A difference of 5.4 ± 1.0% is obtained with a regularization λ value of 5 × 10⁻⁴ optimized on the giant petrel isotopic and spectroscopic data (Manceau et al., submitted).
Table S2. Total Hg concentration ([Hg]tot) and Hg isotopic composition measured by Bolea-Fernandez
et al.2, the %MeHg, %Hg(Sec)4, and %HgSe calculated by alternated regularized inversion, and the
effective Hg:Se (Hg:Seeff).
Age Tissue [Hg]tot
dw (ppm) δ202Hg (‰) Std %MeHg %Hg(Sec)4a %HgSea Hg/Seeff
Juvenile Liver 3.7 -0.65 0.12 32.1 67.9 0.0 0.26 Juvenile Liver 5.1 -0.57 0.04 28.2 71.8 0.0 0.68 Juvenile Liver 3.7 -0.23 0.15 28.3 43.5 28.2 0.33 Juvenile Liver 9.9 -0.74 0.03 22.6 77.4 0.0 0.82 Juvenile Liver 23.4 -0.95 0.13 15.4 84.6 0.0 0.88 Juvenile Liver 22.5 -0.97 0.05 18.6 81.4 0.0 1.31 Juvenile Liver 33.2 -0.97 0.07 14.9 85.1 0.0 1.66 Juvenile Liver 104.4 -1.12 0.03 5.9 94.1 0.0 2.43 Juvenile Liver 32.8 -0.98 0.04 14.2 85.8 0.0 1.81 Juvenile Liver 167.3 -1.23 0.09 6.3 93.7 0.0 2.80 Adult Liver 219.9 -0.91 0.04 4.8 74.9 20.3 1.97 Adult Liver 221.8 -0.92 0.07 4.0 74.9 21.1 2.31 Adult Liver 815.5 -0.69 0.05 1.6 54.9 43.5 1.87 Adult Liver 560.2 -0.65 0.03 3.6 53.7 42.7 1.91 Adult Liver 564.0 -0.57 0.05 2.2 46.2 51.6 1.82 Adult Liver 926.1 -0.65 0.07 2.6 52.7 44.7 2.10 Adult Liver 792.7 -0.81 0.09 2.4 65.0 32.6 2.30 Adult Liver 891.8 -0.58 0.05 2.5 47.2 50.3 1.80 Adult Liver 1798.8 -0.35 0.09 0.9 27.9 71.2 1.60 Adult Liver 1581.6 -0.29 0.05 1.2 23.6 75.2 1.36 Adult Liver 2317.1 -0.15 0.03 1.0 12.5 86.5 1.71 Juvenile Kidneys 7.6 -0.76 0.15 32.8 67.2 0.0 -- Juvenile Kidneys 2.1 -0.64 0.13 41.9 58.1 0.0 -- Juvenile Kidneys 1.6 -0.33 0.01 32.2 54.8 13.0 -- Juvenile Kidneys 4.6 -1.02 0.15 24.6 75.4 0.0 -- Juvenile Kidneys 4.1 -0.29 0.05 46.5 53.5 0.0 -- Juvenile Kidneys 7.4 -0.71 0.08 26.1 73.9 0.0 -- Juvenile Kidneys 5.0 -0.39 0.06 40.9 59.1 0.0 -- Juvenile Kidneys 6.9 -0.47 0.04 33.7 66.3 0.0 -- Juvenile Kidneys 11.4 -0.73 0.08 24.2 75.8 0.0 -- Juvenile Kidneys 10.7 -0.55 0.03 34.2 65.8 0.0 -- Adult Kidneys 24.0 -1.10 0.06 13.2 86.8 0.0 --
Adult Kidneys 23.0 -0.73 0.06 26.2 73.8 0.0 -- Adult Kidneys 26.7 -0.78 0.07 11.1 70.5 18.4 -- Adult Kidneys 19.6 -0.62 0.06 28.7 71.3 0.0 -- Adult Kidneys 37.3 -0.52 0.08 10.4 49.7 39.9 -- Adult Kidneys 57.2 -0.82 0.11 10.5 73.1 16.4 -- Adult Kidneys 16.4 -0.63 0.05 11.7 59.4 28.9 -- Adult Kidneys 40.4 -0.76 0.03 12.8 70.5 16.7 -- Adult Kidneys 78.9 -0.67 0.12 4.7 56.2 39.1 -- Adult Kidneys 83.1 -0.72 0.05 7.6 62.7 29.7 -- Juvenile Muscle 1.9 1.03 0.03 89.7 10.3 0.0 -- Juvenile Muscle 2.3 1.05 0.11 100 0.0 0.0 -- Juvenile Muscle 1.9 0.98 0.04 78.7 21.3 0.0 -- Juvenile Muscle 4.0 1.05 0.05 87.2 12.8 0.0 -- Juvenile Muscle 3.6 0.98 0.03 100 0.0 0.0 -- Juvenile Muscle 5.8 1.13 0.09 86.1 13.9 0.0 -- Juvenile Muscle 4.8 1.01 0.06 88.2 11.8 0.0 -- Juvenile Muscle 6.4 0.95 0.08 93.7 6.3 0.0 -- Adult Muscle 12.0 1.07 0.03 99.0 1.0 0.0 -- Adult Muscle 16.0 0.98 0.07 89.6 10.4 0.0 -- Adult Muscle 16.0 0.80 0.04 87.2 12.8 0.0 -- Adult Muscle 14.6 0.71 0.04 75.4 24.6 0.0 -- Adult Muscle 14.6 0.55 0.04 67.5 32.5 0.0 -- Adult Muscle 18.0 0.20 0.10 65.3 34.7 0.0 --
aValues obtained with λ = 0.01. A difference of 3.0 ± 0.4% is obtained with a regularization λ value of 5 × 10⁻⁴ optimized on the giant petrel spectroscopic and isotopic data (Manceau et al., submitted).
Supplementary references
(1) Li, M. L.; Juang, C. A.; Ewald, J. D.; Yin, R. S.; Mikkelsen, B.; Krabbenhoft, D. P.; Balcom, P. H.; Dassuncao, C.; Sunderland, E. M. Selenium and stable mercury isotopes provide new insights into mercury toxicokinetics in pilot whales. Sci. Tot. Environ. 2020, 710, n° 136325.
(2) Bolea-Fernandez, E.; Rua-Ibarz, A.; Krupp, E. M.; Feldmann, J.; Kvanhaecke, F. High-precision isotopic analysis sheds new light on mercury metabolism in long-finned pilot whales (Globicephala melas). Sci. Rep. 2019, 9, n° 7262.
(3) Manceau, A.; Gaillot, A. C.; Glatzel, P.; Cherel, Y.; Bustamante, P. In vivo formation of HgSe nanoparticles and Hg-tetraselenolate complex from methylmercury in seabird – Implications for the Hg-Se antagonism. Environ. Sci. Technol. 2021, 55, 1515-1526.

![Table S2. Total Hg concentration ([Hg] tot ) and Hg isotopic composition measured by Bolea-Fernandez et al](https://thumb-eu.123doks.com/thumbv2/123doknet/14800286.605885/32.918.94.824.82.217/table-total-concentration-isotopic-composition-measured-bolea-fernandez.webp)
