HAL Id: hal-00304994
https://hal.archives-ouvertes.fr/hal-00304994
Submitted on 1 Jan 2004HAL is a multi-disciplinary open access archive for the deposit and dissemination of sci-entific research documents, whether they are pub-lished or not. The documents may come from teaching and research institutions in France or abroad, or from public or private research centers.
L’archive ouverte pluridisciplinaire HAL, est destinée au dépôt et à la diffusion de documents scientifiques de niveau recherche, publiés ou non, émanant des établissements d’enseignement et de recherche français ou étrangers, des laboratoires publics ou privés.
Research Note:An approach to integrated assessement of
reservoir siltation: the Joaquín Costa reservoir as a case
study
A. Navas, B. Valero Garcés, J. Machín
To cite this version:
A. Navas, B. Valero Garcés, J. Machín. Research Note:An approach to integrated assessement of reservoir siltation: the Joaquín Costa reservoir as a case study. Hydrology and Earth System Sciences Discussions, European Geosciences Union, 2004, 8 (6), pp.1193-1199. �hal-00304994�
Research Note:
An approach to integrated assessement of reservoir siltation: the
Joaquín Costa reservoir as a case study
A. Navas
1, B. Valero Garcés
2and J. Machín
11Estación Experimental de Aula Dei
2Instituto Pirenaico de Ecología del CSIC, RICTA, Apartado 202, 50080 Zaragoza, Spain
Email for corresponding author: anavas@eead.csic.es
Abstract
In 1932, the Esera river was dammed at the foothills of the Pyrenean External Ranges; since then, sedimentation has reduced its water storage capacity by a third. This study of the sediments in the Joaquín Costa reservoir has been based on detailed sedimentological examination and other analysis of mineralogy, grain size distribution and the chemical components of the materials accumulated at the bottom of the reservoir. Interpretations are based on results from four sediment cores collected at sites representative of the main environments in the reservoir. Records of known flood events and of reservoir management data have been combined with a 137Cs-derived chronology. Thus, it has been possible to ascribe the sedimentary record at the different reservoir environments to specific years, as well as some main changes in the facies types and sediment components. This methodology is a first approach to assessing siltation processes and dynamics in Mediterranean mountain reservoirs.
Keywords: reservoir siltation, mineralogy, sedimentology,sedimentation rates, 137Cs, sediment tracing, mountain reservoir, central Spanish Pyrenees
Introduction
To improve the management of hydrological resources, many rivers in Spanish basins have been dammed; siltation of these Mediterranean mountain reservoirs is a significant problem on which little information is available. Furthermore, the scarcity of water resources demands sound management based on reliable data within a context of resource sustainability.
The sediment supply to the Joaquín Costa reservoir, part of a system of ten large dams impounding rivers in the central Spanish Pyrenees, is related to both snowmelt and storm events. A bathymetric survey (CEDEX, 1995) estimated the annual average sediment entering the reservoir to be around 350 t km-2.
In this study, multidisciplinary data have been combined to reconstruct the history of siltation to derive information on the sedimentation dynamics in the reservoir system. Sedimentological, mineralogical, chemical and flood data, determined from four sediment cores collected along the reservoirs axis, have been combined with radioisotopic data
to characterise the siltation and depositional processes in the reservoir. This integrated approach addresses the problem of siltation in reservoirs in Mediterranean environments.
Methodology
THE JOAQUÍN COSTA RESERVOIR
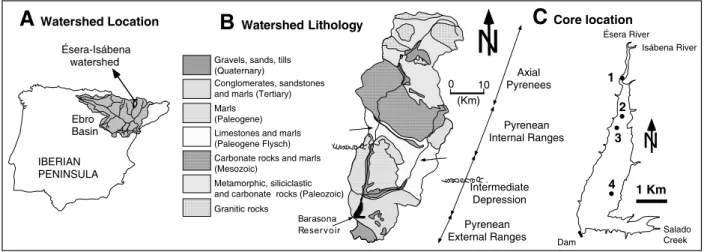
In 1932, the Esera river was dammed at Graus (central Spanish Pyrenees). The reservoir (6 km long, 1 km wide) follows the submerged and meandering Esera channel. With an average depth of 16 m increasing to a maximum of 60 m at its outlet, its initial storage capacity was 92 × 106 m3
(Fig. 1). After the confluence with the Isábena river, the annual inflow to the reservoir of about 845 × 106 m3 is
largely from the Esera river. The main environments in the reservoir are the delta area at the mouth of the river, the submerged plains and the dam wall delta (Valero Garcés et
A. Navas, B. Valero Garcés and J. Machín
The Esera river drains a large and heterogeneous basin (1224 km2) and flows NS, dissecting a very diverse
lithology that varies from granite and other metamorphic, siliciclastic and carbonate Paleozoic rocks in the axial part, followed by calcareous Mesozoic rocks in the Internal Ranges, and then Tertiary limestones, marls, conglomerates and sandstones in the Intermediate Depression and the External Ranges. The Internal Ranges have been identified as the main contributors to sediment delivery in the basin. High erosion rates were measured in badlands of this area and a load of 500 000 m3 reaches the reservoir each year
(Fargas et al., 1996). In agreement with this, Valero Garcés
et al. (1996) also measured the highest concentration of
suspended sediments transported by the Esera river in the Internal Ranges in relation to both the outcropping of more erodible materials as well as a much larger agricultural area.
SEDIMENT CORES, SAMPLE PREPARATION AND ANALYSES
The main environments in the reservoir are the delta area at the mouth of the river, the submerged plains and the dam wall delta (Valero Garcés et al., 1997).The four cores analysed in this study were taken in the bottom deposits along the reservoirs longest axis along the submerged Esera channel (Fig. 1). They were selected from 22 cores used to characterise in detail the sedimentary environments in the reservoir. The core depths varied from 2 m to more than 6 m and the intention to collect the entire deposit at each selected site was achieved at three of the four sites when the typical red fluvial facies of the Esera river comprising
3 was not recovered and should include around 60 cm more of reservoir facies.
Core 1 is 205 cm deep and corresponds to the delta mouth environment. Core 2, 200 cm deep, corresponds to the northern area of the submerged plains. Core 3 (240 cm deep) is at the central part of the submerged plains. Core 4, 600 cm deep, is located at the southern part of the submerged plains at their widest extension in the reservoir. To differentiate the sediments accumulated in the reservoir bottom, an additional core (control core C, 80 cm deep) was collected some 300 m south of Core 3 at the coast line; this represented a littoral environment. Cores 1, 2 and 3, did not exceed 2.5 m, and were taken by a mechanically driven core driller. Core 4 was retrieved using a hand operated piston-coring device, a modified Livingstone corer. Sediments in the cores were extruded to study and describe their characteristics, such as lithology, colour, grain size, transition changes and sedimentary structures. Cores were sectioned for the various analyses. Samples were placed in plastic bags for storage and kept refrigerated for laboratory processing and analysis. They were air-dried and ground to pass through a 2 mm sieve. The chemical analyses included carbonate content by calcimetric techniques and organic matter content by loss on ignition at 450ºC. Mineralogical analyses were performed using a Siemens D-500 diffractometer working at 40 kv and 30 mA. Semi-quantitative results of the mineralogical percentages were obtained using relative reflectance factors. Granulometric analysis of different size fractions used Malvern and Coulter laser equipment after particles were chemically disaggregated and dispersed ultrasonically. 137Cs activity was
Fig. 1. (A) Location of the Joaquín Costa reservoir in the Central Spanish Pyrenees within the Ebro basin.
(B) Lithology and main structural units in the Esera-Isábena watershed.
(C) Location of the four sediment cores collected in the main environments of the reservoir following its axis downward from the delta mouth to the delta dam.
0 10 (Km) Axial Pyrenees Pyrenean Internal Ranges Pyrenean External Ranges Intermediate Depression Barasona Reservoir É s e r a R . I s á b e n a R .
N
B
Watershed Lithology Granitic rocks Metamorphic, siliciclastic and carbonate rocks (Paleozoic) Carbonate rocks and marls (Mesozoic)Marls (Paleogene)
Conglomerates, sandstones and marls (Tertiary) Gravels, sands, tills (Quaternary)
Limestones and marls (Paleogene Flysch) Ebro Basin Ésera-Isábena watershed IBERIAN PENINSULA
A
Watershed LocationC
Core locationN
Isábena River Ésera River Dam 3 4 1 2 1 Km Salado CreekA total of 72 grab samples was collected across the reservoir in a grid pattern, during a bathymetric survey in 1995 by the CEDEX, to assess the spatial distribution of the grain size of surface sediments by geostatistical interpolation.
Flow records at the gauging stations upstream of the reservoir entrance were obtained from the Water Authority (Confederación Hidrográfica del Ebro).
Results and discussion
FACIES AND SEDIMENT COMPOSITION
The grain size distribution of the surface sediments follows that expected for deposition in reservoirs. The coarser fractions are closer to the river outlet where tractive mechanisms are predominant. Conversely, the finer fractions
accumulate at the delta dam where the water table is deeper and a lacustrine regime of transport and deposit is operating. Over most of the area of the reservoir, the sand content is less than 5%; only in the delta mouth does it exceed 40%. The highest sand content occurs at the Esera and Isábena outlets (>80%) and at the SE bay which is fed by some ephemeral creeks. Silt, the predominant fraction in the surface sediments, ranges from 40% to less than 80% but for most of the reservoir area it exceeds 60%. The clay fraction is also abundant and over most of the reservoir the surface sediments contain 2030% of clay, with a maximum (>40%) at the delta dam.
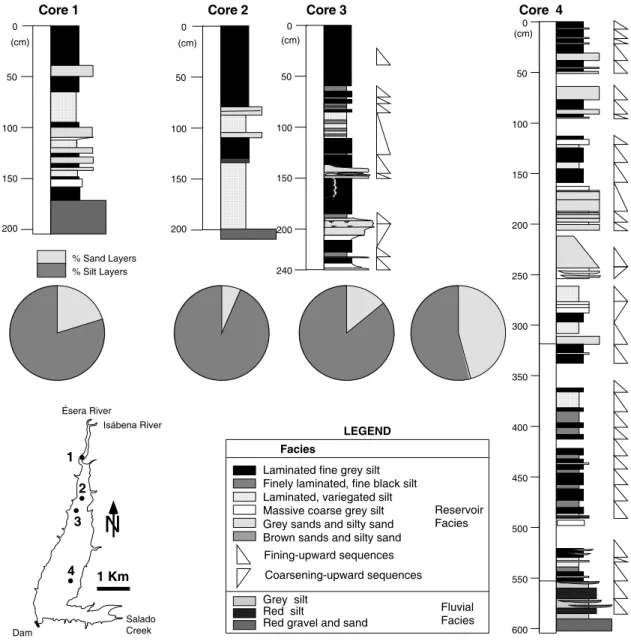
The sediment cores taken at the reservoir are representative of its main sediment environments and the sedimentological facies are shown in Fig. 2. In cores 1, 2
Fig. 2. Sedimentary facies and percentages of silt and sand layers in the four cores of the Joaquín Costa reservoir.
0 50 100 150 200 (cm) Core 1 0 50 100 150 200 (cm) Core 2 0 50 100 150 200 250 300 350 400 450 500 600 550 (cm)
Red gravel and sand Red silt
Grey silt
Grey sands and silty sand Laminated fine grey silt Laminated, variegated silt Massive coarse grey silt
Fluvial Facies Reservoir Facies LEGEND Facies
Finely laminated, fine black silt
Brown sands and silty sand Fining-upward sequences Coarsening-upward sequences 0 50 100 150 200 240 (cm) Core 3 Core 4 % Sand Layers % Silt Layers
N
Isábena River Ésera River Dam 3 4 1 2 1 Km Salado CreekA. Navas, B. Valero Garcés and J. Machín
and 3 corresponding to the delta mouth and the northern and central submerged plains respectively, silt layers account for more than 80%, while sand layers are from 714% except at the delta mouth, where they may reach 20%. As expected from the sedimentation dynamics in reservoirs, the thickness of the deposit increases towards the delta dam (core 4), where the water level is highest and where most of the facies are preserved because subaerial exposure during low water levels is less frequent in this area. Although silt layers are the more abundant (54%), percentages of sand layers account for almost half of the entire deposit in the southern submerged plains.
When comparing the distribution of the sedimentary facies, sand layers are clearly more abundant in the lower half of cores 1, 2 and 3; exceptionally, in core 4, sand layers predominate in the upper half, perhaps because of the regimes operating in the different areas of the reservoir and of the occurrence of floods during low or high levels of water in the reservoir.
The results of mineralogical analysis of the cores selected show calcite as most abundant (3040%), followed by clay
minerals (2530%) and quartz (2030%). Minor components are feldspar and dolomite (less than 5%). The most abundant clays are illites, chlorites and kaolinites, in that order; also, some pyrophyllites are found (Valero Garcés
et al., 1999).
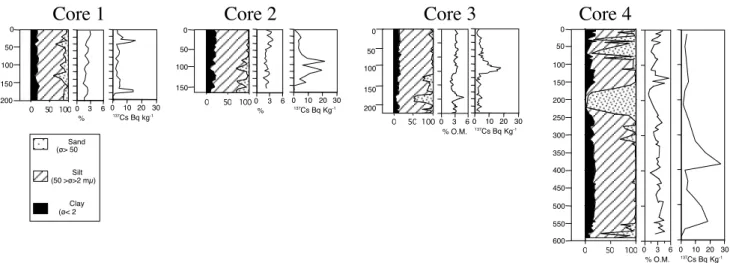
Granulometrical analyses (Fig. 3) in cores 1 and 2 present very similar grain size distributions, suggesting that the delta mouth and the northern submerged plains are sedimentologically similar. Higher percentages of sand appear in the lower parts of cores 2 and 3, while just the opposite happens in core 4. The variations in grain size distribution agree with the pattern of mineral distribution and support the identification of two contrasting periods in the sedimentary record of this reservoir.
Chemical analysis of core samples quantified the percentages of organic matter, carbonates and other inorganic (non-carbonate) components. Table 1 shows that organic matter content is low but increases towards the delta dam, peaking at 6% in core 4. The carbonate content, similar in cores 1 and 2, almost doubles in cores 3 and 4. Conversely, the content of inorganic (non-carbonate and silicate)
Table 1. Basic statistics (%) of the main organic and inorganic components in the four cores collected along the axis of the reservoir.
Organic matter Carbonates Silicates and non-carbonates
n ave. max. min. s.d. CV ave. max. min. s.d. CV ave. max. min. s.d. CV
Core 1 21 2.20 3.04 1.41 0.47 21 18.38 21.09 12.36 2.28 12 79.52 85.00 77.00 2.16 3 Core 2 34 2.55 3.76 1.61 0.55 22 18.00 20.88 13.38 1.74 10 79.46 84.31 77.04 1.80 2 Core 3 60 3.08 5.07 1.96 0.53 17 38.13 48.00 26.00 4.63 12 58.75 70.46 49.12 4.42 8 Core 4 68 2.85 6.00 1.00 0.9734 36.18 48.00 22.00 5.72 16 60.99 74.00 51.00 5.34 9
s.d. : standard derivation
Fig. 3. Distribution of grain size and organic matter percentages and 137Cs activity curves in the sediments of the four cores in the reservoir.
Core 1
Core 2
Core 3
Core 4
Sand (ø> 50 Silt (50 >ø>2 mµ) Clay (ø< 2 0 10 20 30 137Cs Bq Kg-1 0 3 6 % O.M. 100 150 200 0 50 100 0 50 0 3 6 % O.M. 0 10 20 30 137Cs Bq Kg-1 100 150 200 250 300 350 400 450 500 600 550 0 50 100 0 50 0 3 6 % 0 10 20 30 137Cs Bq kg-1 0 50 100 150 200 0 50 100 0 10 20 30 137Cs Bq Kg-1 100 150 0 50 0 50 100 0 3 6 %
components is very high in the delta mouth and northern submerged plains and decreases down the reservoir axis in cores 3 and 4.
The most distinctive features in the cores are the variations in organic matter content, generally associated with the finer fractions of clay minerals (Fig. 3). The organic matter increases in the upper halves of cores 1, 2 and 3 while a marked decrease occurs in the upper half of core 4. This is paralleled by a decrease in the inorganic components and an increase in carbonates. Because of the calcareous composition of the sands, the highest carbonate contents occur in the sandy intervals as in the upper part of core 4.
THE SEDIMENTATION IN THE RESERVOIR
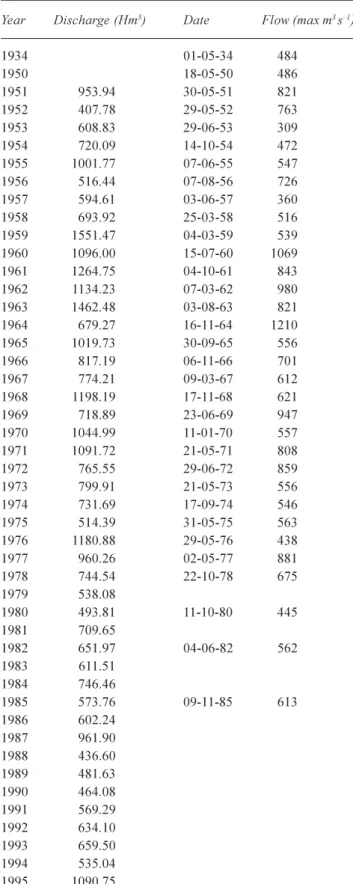
The chronology of the sediment sequence deposited at the Joaquín Costa reservoir has been reconstructed by ascribing the main sedimentological features to the known floods (Table 2) or to other characteristics, such as the functioning of the reservoir, and by combining these data with the chronology derived from the 137Cs radiotracer.
The use of 137Cs to trace sediment movement and
deposition has been referenced in the literature (Ritchie and McHenry, 1990; Foster and Walling, 1994; Navas et al., 1998). Accumulation rates can be derived by comparing the vertical distribution of 137Cs in sediment profiles with the
history of its fallout from the atmosphere (Cambray et al., 1983). From the 137Cs fallout, only two dates, 1954, the year
of its first appearance, and 1963, the year of its maximum accumulation, can be determined in most of the sediment profiles (Whicker et al., 1994).
In the control core C, 137Cs was present, not in the deeper
horizons of the red fluvial facies in the coast line but only in the first 5 cm (1.6 Bq kg 1); this allowed discrimination
between fluvial and reservoir facies.
Figure 3 shows that 137Cs peaks occur at different depths
in all the cores. At the delta mouth, the peak at 170180 cm in core 1 has been ascribed to 1963. Therefore, since the reservoir was built in 1932, until the early 1960s, only 30 40 cm of sediments were deposited at this site. It may be that accumulated sediments were evacuated by annual flushes of the reservoir. Since 1963, around 170 cm of sediment accumulated at this site so that the rate of sedimentation at the delta mouth from 1963 to 1996 was 5.2 cm yr1. A second 137Cs maximum close to the surface of
the cores may reflect remobilisation of sediment; at the mouth of the delta, the energy of floods is highest and tractive mechanisms are predominant. It appears that erosion and remobilisation of accumulated sediments occurred at this site. The relatively low sedimentation rate can also be explained by the predominance, from the 1960s, of late
Table 2. Discharge and main floods recorded at the reservoir
entrance.
Year Discharge (Hm3)Date Flow (max m3 s1)
1934 01-05-34 484 1950 18-05-50 486 1951 953.94 30-05-51 821 1952 407.78 29-05-52 763 1953 608.83 29-06-53 309 1954 720.09 14-10-54 472 1955 1001.77 07-06-55 547 1956 516.44 07-08-56 726 1957594.61 03-06-57360 1958 693.92 25-03-58 516 1959 1551.4704-03-59 539 1960 1096.00 15-07-60 1069 1961 1264.75 04-10-61 843 1962 1134.23 07-03-62 980 1963 1462.48 03-08-63 821 1964 679.27 16-11-64 1210 1965 1019.73 30-09-65 556 1966 817.19 06-11-66 701 1967 774.21 09-03-67 612 1968 1198.19 17-11-68 621 1969 718.89 23-06-69 947 1970 1044.99 11-01-70 557 1971 1091.72 21-05-71 808 1972 765.55 29-06-72 859 1973 799.91 21-05-73 556 1974 731.69 17-09-74 546 1975 514.39 31-05-75 563 1976 1180.88 29-05-76 438 1977 960.26 02-05-77 881 1978 744.54 22-10-78 675 1979 538.08 1980 493.81 11-10-80 445 1981 709.65 1982 651.9704-06-82 562 1983 611.51 1984 746.46 1985 573.76 09-11-85 613 1986 602.24 1987961.90 1988 436.60 1989 481.63 1990 464.08 1991 569.29 1992 634.10 1993 659.50 1994 535.04 1995 1090.75
A. Navas, B. Valero Garcés and J. Machín
autumn floods that enter the reservoir at its low water level. The 137Cs activity curve for core 2 shows a broad peak
between 90 to 130 cm depth. The sharp decrease in 137Cs
concentration at 100 cm is associated with the low clay content in the predominantly coarse materials deposited here by the19631964 floods. At this site, 90 cm of sediments have accumulated since the 1963 maximum, at an average rate of 2.6 cm yr1. Before the 1963 137Cs peak, only around
70 cm of sediment was deposited at a rate of 2.3 cm yr1.
The thickness of the peak may indicate that 137Cs has
undergone mixing and/or diffusion. Davis et al. (1984) indicated that 137Cs can be remobilised when organic matter
decomposes. Moreover, some authors (e.g. Zucker et al., 1984) point out that attachment of 137Cs to some clay
minerals may be not permanent. Nevertheless, because this ill-defined peak has been found only in this core, it is plausible that reworking and mixing of sediments has occurred, especially in relation to the floods between 1960 1964, the most intense of all those recorded in the basin. As with core 1, the small amount of sedimentation at this site could be due to lack of deposition or erosion of sediments as fluvial processes dominated in the northern part of the submerged plains.
At the central submerged plains, a well defined 137Cs peak
appears in core 3 at 110120 cm. Above the 1963 137Cs peak,
110 cm of sediments accumulated and, therefore, the sediment rate increased slightly (3.2 cm yr1). It is not
possible to disaggregate the complete sedimentary record because of the lack of the entire deposit that could contain the first appearance of 137Cs in 1954. Beneath the 1963
maxima to the bottom of the reservoir, 120 cm of sediment accumulated at this site. Although remobilisation may be predominant in this area of the reservoir, this increase in sediment can be interpreted as transitional between a fluvial regime and a lacustrine regime.
In the southern area of the submerged plains, in core 4, the 137Cs activity curve peaks at 330391 cm and again at
537557 cm, corresponding to 1963 and 1954 respectively. On the basis of this chronology, only about 33 cm of red and grey silts were deposited here since the dam was built in 1932 until the mid 1950s. Thereafter, annual flushes were stopped, so that the southern areas of the reservoir were submerged permanently. Taking into account the sediment thickness (164 cm) between the first appearance of 137Cs
and the main peak, the average sedimentation rate from 19541963 was highest (18.2 cm yr1). The scarcity of sandy
silt layers suggested that floods were less frequent or intense during this period or that they occurred when reservoir levels were high. According to data from water authorities (Table 2), the annual inflow into the reservoir was highest in the
should be expected. During the last three decades, almost 4 m of sediment accumulated at the site of core 4, with an average sedimentation rate of 11.6 cm yr1 and sandy
sediments were more abundant. The predominance of coarser materials above the 1963 horizon agrees with the maximum autumn flood frequency registered from the 1960s and supports the hypotheses that at the lowest water level in the reservoir, floods could reach the southern areas where sediments would be deposited.
All these data indicate that between 1932 and 1954 and in all the areas of the reservoir from the delta mouth to the southern submerged plains, erosion and remobilisation were the main sedimentary processes to transport the sediments out of the reservoir. It also appears that, in general, the highest water level in the reservoir, occurring between the mid 1950s1960s, favoured the accumulation of sediments in the southern areas rather than in the northern and delta mouth areas, where coarser materials accumulated as the less frequent floods reached the reservoir at high water levels. Since 1963, erosion is still predominant in the northern areas of the reservoir and at the delta mouth where, despite the increase in flood frequency, little sediment accumulated. In an intermediate position, the central submerged plains accumulated more sediments, albeit transitionally because erosion was still important, while in the southern submerged plains, sediments were deposited in a lacustrine regime.
Conclusions
The sediments accumulated in the reservoir during the 65 years of impoundment are supplied mainly by riverine inputs during periods of maximum flow. A transitional regime towards a lacustrine type is established as the axial distance from the delta mouth increases with the depth of water. Hence, the functioning of the reservoir depends on the depth of water that makes the tractive mechanisms of sediment transport by the Esera channel predominant during the low water levels and, conversely, the suspended transport and deposition by decantation of fine particles at times of high water levels.
Combination of the various sedimentological and analytical techniques applied in this study allowed the main episodes of erosion and accumulation within the Joaquín Costa reservoir to be related to documented events. This methodology permitted the main processes in the siltation history of this reservoir to be identified. To prevent the silting up of water bodies in similar environments, annual flushes or draw-off of floods with high suspended sediment loads should be considered within the operating schemes.
marker and, due to the high cost of coring expeditions, efforts should concentrate on collecting the cores from the more stable areas in the reservoir, avoiding those prone to strong re-mobilisation. Stable areas accumulate the most complete sedimentary sequence and potentially could contain the two
137Cs maxima.
In reservoirs located in Mediterranean environments characterised by high sedimentation rates as well as large variations in grain size, measurement of the detailed 137Cs
activity profile allows discrimination of the two maxima from any small change due to covariation with grain size.
Acknowledegements
The financial support provided by the Confederación Hidrográfica del Ebro and the Spanish Ministry of Environment for this research is gratefully acknowledged.
137Cs was analysed at the Department of Geography of the
University of Exeter (UK). Special thanks are due to Prof. D. Walling and Dr. T. Quine for their support and valuable comments on this work.
References
Cambray, R.S., Playford, K. and Lewis, N.J., 1983. Radioactive
fallout in air and rain: results to the end of 1982. U.K. Atomic
Energy Authority Rep. AERE-R-10859. U.K. AERE, Harwell, UK.
CEDEX, 1995. Reconocimientos sedimentológicos de embalses: embalse de Barasona. Ministerio de Obras Públicas, Transportes y Medio Ambiente. Clave CEDEX: 42-493-1-052,144pp.
Davis, R.B., Hess, C.T., Norton, S.A., Hanson, D.W., Hoagland, K.D. and Anderson D.S., 1984. 137Cs and 210Pb dating of
sediments from soft-water lakes in New-England (USA) and Scandinavia, a failure of 137Cs dating. Chem. Geol., 44, 151
185.
Fargas, D., Martínez, J.A. and Poch, R.M., 1996. Identification of critical sediment source areas at regional level. Ann. Geophys., 14 (Suplement II), 314, European Geophysical Society C. Foster, I.D.L. and Walling, D.E., 1994. Using reservoir deposits
to reconstruct changing sediment yields and sources in the catchment of the Old Mill Reservoir, South Devon, UK, over the past 50 years. Hydrolog. Sci. J., 39, 347368.
Navas, A., Valero, B., Machín, J. and Walling, D., 1998. Los sedimentos del embalse de Joaquín Costa y la historia de su depósito. Limnética, 14, 93112.
Ritchie, J.C. and McHenry, J.R., 1990. Application of radioactive fallout cesium-137 for measuring soil erosion and sediment accumulation rates and patterns: a review. J. Environ. Qual., 19, 215233.
Valero Garcés, B.L., Navas, A. and Machín, J., 1996. Análisis sedimentológico del pantano de Barasona, Huesca. Cadernos
Laboratorio Xeolóxico de Laxe, 21, 483493.
Valero Garcés, B.L., Navas, A. and Machín, J., 1997. Sediment deposition in the Barasona reservoir (central Pyrenees, Spain): temporal and spatial variability of sediment yield and land use impacts. IAHS Publ. no. 245, 241249.
Valero Garcés, B.L., Navas, A., Machín, J. and Walling, D.E., 1999. Sediment sources and siltation in mountain reservoirs: a case study from the Central Spanish Pyrenees. Geomorphology, 28, 2341.
Whicker, J.J., Whicker, F.W. and Jacobi, S., 1994. 137Cs in
sediments of Utah lakes and reservoirs: effects of elevation, sedimentation rate and fallout history. J. Environ. Radioactiv., 23, 265283.
Zucker, C.L., Olsen, C.R., Larsen, I.L. and Cutshall, N.H., 1984. Inventories and sorption-desorption trends of radiocesium and radiocobalt in James River estuary sediments. Environ. Geol.