Publisher’s version / Version de l'éditeur:
Vous avez des questions? Nous pouvons vous aider. Pour communiquer directement avec un auteur, consultez la Questions? Contact the NRC Publications Archive team at
PublicationsArchive-ArchivesPublications@nrc-cnrc.gc.ca. If you wish to email the authors directly, please see the first page of the publication for their contact information.
https://publications-cnrc.canada.ca/fra/droits
L’accès à ce site Web et l’utilisation de son contenu sont assujettis aux conditions présentées dans le site LISEZ CES CONDITIONS ATTENTIVEMENT AVANT D’UTILISER CE SITE WEB.
Laboratory Technical Report (National Research Council of Canada. Aerospace.
Aerodynamics Laboratory); no. LTR-AL-2017-0008, 2017-04-22
READ THESE TERMS AND CONDITIONS CAREFULLY BEFORE USING THIS WEBSITE.
https://nrc-publications.canada.ca/eng/copyright
NRC Publications Archive Record / Notice des Archives des publications du CNRC :
https://nrc-publications.canada.ca/eng/view/object/?id=d21e1097-5d30-4a0f-b742-35ffad931c2f https://publications-cnrc.canada.ca/fra/voir/objet/?id=d21e1097-5d30-4a0f-b742-35ffad931c2f
For the publisher’s version, please access the DOI link below./ Pour consulter la version de l’éditeur, utilisez le lien DOI ci-dessous.
https://doi.org/10.4224/23001922
Access and use of this website and the material on it are subject to the Terms and Conditions set forth at
Fuel-economy testing of a three-vehicle truck platooning system
McAuliffe, Brian R.; Croken, Mark; Ahmadi-Baloutaki, Mojtaba; Raeesi,
Arash
Truck Platooning System
Unclassified Unlimited
LTR-AL-2017-0008 April 22, 2017
Fuel-Economy Testing of a Three-Vehicle
Truck Platooning System
Report No.: LTR-AL-2017-0008 Date: April 22, 2017
Authors: Brian R. McAuliffe, Mark Croken, Mojtaba Ahmadi-Baloutaki, Arash Raeesi
Classification: Unclassified Distribution: Unlimited
For: ecoTECHNOLOGY for Vehicles
Stewardship and Sustainable Transportation Programs Transport Canada
Project #: A1-009253
Submitted by: Dr. Michael Benner, Director R&D, Aerodynamics Laboratory
Approved by: Jerzy Komorowski, General Manager, NRC Aerospace
Pages: 64 Copy No:
Figures: 78 Tables: 6
This report may not be published wholly or in part without the written consent of the National Research Council Canada
Disclaimer
This report reflects the views of the authors only and does not reflect the views or policies of Transport Canada.
Neither Transport Canada, nor its employees, makes any warranty, express or implied, or assumes any legal liability or responsibility for the accuracy or completeness of any information contained in this report, or process described herein, and assumes no responsibility for anyone’s use of the information. Transport Canada is not responsible for errors or omissions in this report and makes no representations as to the accuracy or completeness of the information.
Transport Canada does not endorse products or companies. Reference in this report to any specific commercial products, process, or service by trade name, trademark, manufacturer, or otherwise, does not constitute or imply its endorsement, recommendation, or favoring by Transport Canada and shall not be used for advertising or service endorsement purposes. Trade or company names appear in this report only because they are essential to the objectives of the report.
References and hyperlinks to external web sites do not constitute endorsement by Transport Canada of the linked web sites, or the information, products or services contained therein. Transport Canada does not exercise any editorial control over the information you may find at these locations.
Executive Summary
Vehicle-to-Vehicle (V2V)-based cooperative truck platooning systems are nearing commer-cialization. However, there is a knowledge gap in terms of the reliability and resiliency of these systems. Under a U.S. Federal Highway Administration (FHWA) Exploratory Advanced Re-search Project, the University of California (Berkeley) Partners for Advanced Transportation Technology (PATH) has been developing and testing three-truck platooning technology using cooperative adaptive cruise control (CACC), in collaboration with Volvo Trucks. Transport Canada has been successful in partnering with PATH to secure the PATH CACC system for testing and evaluation purposes at TC’s Motor Vehicle Test Centre (MVTC). The National Re-search Council Canada (NRC) supported TC’s effort to host the fuel-consumption testing cam-paign for the PATH truck-platooning technology demonstrations. The NRC, under direction from TC and with support from FPInnovations PIT Group, conducted a modified version of the SAE J1321 Type II fuel consumption test procedure to evaluate the fuel-savings benefits of platooning for various aerodynamic tractor-trailer configurations. Other project partners included the California Department of Transportation (Caltrans), PMG Technologies , Centre de Formation du Transport Routier de Saint-Jérome (CFTR), and Environment and Climate Change Canada (ECCC).
Four tractor-trailer combinations were used as part of the fuel-economy tests: the three iden-tical test vehicles with the CACC control systems, and a control vehicle. Auxiliary fuel tanks were installed on the vehicles to permit direct measurement of the fuel use during each mea-surement run using a gravimetric fuel-weighing procedure.
A test program was devised, through consensus by the project partners, to examine the influ-ence of four parameters on the fuel-savings potential of the three-truck CACC-based platoon: • Separation Distance/Time: 17 m (57 ft) to 43 m (142 ft), equivalent to 0.6 s to 1.5 s at
105 km/h (65 mph).
• Truck configuration: standard trailer vs. aerodynamic trailer. • Vehicle speed: 89 km/h (55 mph) and 105 km/h (65 mph). • Vehicle weight: 14,000 kg (31,000 lbs) and 29,400 kg (65,000 lbs).
For the range of test conditions examined, the net fuel savings for the full vehicle platoon was measured to be between 5.2% and 7.8%. The combined effect of platooning and aerodynamic trailer devices was measured to be up to 14.2% at the shortest separation distance of 17.4 m.
The major findings of the study include:
• At the shorter separation distances tested, a decrease in fuel savings was observed with increasing distance. Beyond about 22 m for the standard trailer, for which the platoon-averaged fuel savings was measured to be 5.2%, no significant change in fuel savings was observed. For the aerodynamic trailer configuration, no significant change was observed beyond 34 m for which the platoon-averaged fuel-savings was measured to be 5.7%. • The lead vehicle showed no significant fuel savings for the tested separation distances of
26 m and greater. At the shortest separation distance tested (17 m), a small fuel savings on the order of 1% was observed for some of the test conditions.
• For the range of separation distances tested (17 m to 44 m), and for the standard and aerodynamic trailer configurations, the trailing vehicle experienced the highest fuel sav-ings of the three vehicles (approximately 3% higher than the middle vehicle).
• The aerodynamic-trailer configuration experienced a greater percentage fuel savings from platooning than did the standard-trailer configuration (0.5% to 2% higher depend-ing on separation distance).
• No significant effect of vehicle speed on the fuel savings from the CACC platooning system was observed based on the tested speeds of 89 km/h (55 mph) and 105 km/h (65 mph).
• An increased fuel savings of 1.6% associated with the vehicle CACC platooning system was observed for the empty trailer, compared to the loaded trailer.
The results of this study have demonstrated some of the potential fuel-savings benefits of vehicle platooning for a range of test conditions, and highlighted additional knowledge gaps. Recommendations are provided for follow-on testing.
Table of Contents
Executive Summary . . . vii
List of Figures . . . x
List of Tables . . . xiii
Nomenclature . . . xiv
1. Introduction 1 1.1 Background . . . 1
1.2 Project Partners . . . 2
1.3 Objectives and Outcomes . . . 2
1.4 Approach . . . 3
1.5 Aerodynamic Benefits of Truck Platooning . . . 3
2. Test Setup 7 2.1 Cooperative Adaptive Cruise Control System . . . 7
2.2 Test Vehicles and Configurations . . . 7
2.3 Test Site . . . 8
2.4 Test Matrix . . . 11
2.5 Fuel Consumption Measurements . . . 12
2.5.1 Fuel System Modifications . . . 12
2.5.2 Fuel Tank Filling . . . 12
2.5.3 Fuel Measurement Instrumentation . . . 13
2.5.4 Fuel Measurement Procedure . . . 13
2.5.5 Regenerations . . . 16
2.5.6 Wind Measurements . . . 16
2.6 Test Procedure . . . 17
2.6.1 Daily Pre-Test Checks . . . 17
3. Results and Discussion 23
3.1 Data Analysis . . . 23
3.2 Fuel-Savings Measurement Results . . . 25
3.3 Influence of Aerodynamic Treatments . . . 27
3.4 Influence of Separation Distance on Platooning Performance . . . 27
3.5 Influence of Vehicle Speed and Weight on Platooning Performance . . . 31
4. Conclusions and Recommendations 35 4.1 Conclusions . . . 35
4.2 Recommendations for Future Work . . . 36
References 39 A. Test Vehicle Specification 41 B. Test Data 43
List of Figures
1.1 Schematic of a two-vehicle HDV platoon . . . 31.2 Schematic of a three-vehicle HDV platoon . . . 4
2.1 Photograph of Test Truck 1. . . 8
2.2 Photograph of the Control Truck. . . 8
2.3 Test trucks 1, 2, 3, and the control truck parked in position on Bravo track during refuelling and tank weighing. . . 9
2.4 Photograph of side-skirts and boat-tail installed for the aerodynamic-trailer test configuration. . . 9
2.5 Satellite photograph of the test track . . . 10
2.6 Fuel tank installed on frame rails behind the tractor cab . . . 13
2.7 Fuel system routing . . . 14
2.8 Photograph of auxiliary fuel-tank weighing procedure. . . 15
2.10 Schematic representation of test procedure for baseline test and
independent-vehicle test segments. . . 19
2.11 Test procedure for platooning test segments. . . 20
2.12 Schematic representation of test procedure for platooning test segments. . . 21
3.1 Variation in fuel-savings measurements with separation distance for each vehi-cle in the platoon, vehivehi-cle speed of 105 km/hr, vehivehi-cle mass of 29,400 kg (mea-surements referenced to respective vehicle configurations in non-platooned ar-rangement). . . 28
3.2 Variation in fuel-savings measurements with separation distance for the com-plete platoon, vehicle speed of 105 km/hr, vehicle mass of 29,400 kg (measure-ments referenced to respective vehicle configurations in non-platooned arrange-ment). . . 29
3.3 Variation in fuel-savings measurements with separation distance for each ve-hicle in the platoon, veve-hicle speed of 105 km/hr, veve-hicle mass of 29,400 kg (all measurements referenced to standard-trailer configuration in non-platooned ar-rangement). . . 30
3.4 Variation in fuel-savings measurements with separation distance for the com-plete platoon, vehicle speed of 105 km/hr, vehicle mass of 29,400 kg (measure-ments referenced to standard-trailer configuration in non-platooned arrange-ment). . . 31
3.5 Fuel-savings measurements at a separation distance of 17.4 m for different trailer configurations, vehicle speeds, and vehicles weights. . . 32
B.1 Wind Rose - 6 October 2016 Test A1.1 . . . 45
B.2 Wind Rose - 6 October 2016 Test A1.2 . . . 45
B.3 Wind Rose - 6 October 2016 Test A1.3 . . . 46
B.4 Wind Rose - 6 October 2016 Test A6.1 . . . 46
B.5 Wind Rose - 6 October 2016 Test A6.2 . . . 46
B.6 Wind Rose - 6 October 2016 Test A6.3 . . . 47
B.7 Wind Rose - 7 October 2016 Test A3.1 . . . 47
B.8 Wind Rose - 7 October 2016 Test A2.1 . . . 47
B.9 Wind Rose - 7 October 2016 Test A2.2 . . . 48
B.10 Wind Rose - 7 October 2016 Test A2.3 . . . 48
B.11 Wind Rose - 7 October 2016 Test A2.4 . . . 48
B.13 Wind Rose - 11 October 2016 Test A3.2 . . . 49
B.14 Wind Rose - 11 October 2016 Test A3.3 . . . 49
B.15 Wind Rose - 11 October 2016 Test A3.4 . . . 50
B.16 Wind Rose - 11 October 2016 Test A4.1 . . . 50
B.17 Wind Rose - 11 October 2016 Test A4.2 . . . 50
B.18 Wind Rose - 11 October 2016 Test A4.3 . . . 51
B.19 Wind Rose - 11 October 2016 Test A2.6 . . . 51
B.20 Wind Rose - 12 October 2016 Test A5.1 . . . 51
B.21 Wind Rose - 12 October 2016 Test A5.2 . . . 52
B.22 Wind Rose - 12 October 2016 Test A5.3 . . . 52
B.23 Wind Rose - 12 October 2016 Test A5.4 . . . 52
B.24 Wind Rose - 12 October 2016 Test A6.4 . . . 53
B.25 Wind Rose - 12 October 2016 Test A1.4 . . . 53
B.26 Wind Rose - 15 October 2016 Test S1.1 . . . 53
B.27 Wind Rose - 15 October 2016 Test S1.2 . . . 54
B.28 Wind Rose - 15 October 2016 Test S1.3 . . . 54
B.29 Wind Rose - 15 October 2016 Test S6.1 . . . 54
B.30 Wind Rose - 15 October 2016 Test S6.2 . . . 55
B.31 Wind Rose - 16 October 2016 Test S6.3 . . . 55
B.32 Wind Rose - 17 October 2016 Test S2.1 . . . 55
B.33 Wind Rose - 17 October 2016 Test S2.2 . . . 56
B.34 Wind Rose - 17 October 2016 Test S2.3 . . . 56
B.35 Wind Rose - 17 October 2016 Test S3.1 . . . 56
B.36 Wind Rose - 17 October 2016 Test S3.2 . . . 57
B.37 Wind Rose - 17 October 2016 Test S3.3 . . . 57
B.38 Wind Rose - 17 October 2016 Test S3.4 . . . 57
B.39 Wind Rose - 18 October 2016 Test S4.1 . . . 58
B.40 Wind Rose - 18 October 2016 Test S4.2 . . . 58
B.41 Wind Rose - 18 October 2016 Test S4.3 . . . 58
B.43 Wind Rose - 19 October 2016 Test S5.2 . . . 59
B.44 Wind Rose - 19 October 2016 Test S5.3 . . . 59
B.45 Wind Rose - 19 October 2016 Test S7.1 . . . 60
B.46 Wind Rose - 19 October 2016 Test S7.2 . . . 60
B.47 Wind Rose - 20 October 2016 Test C1.1 . . . 60
B.48 Wind Rose - 20 October 2016 Test C1.2 . . . 61
B.49 Wind Rose - 20 October 2016 Test C1.3 . . . 61
B.50 Wind Rose - 23 October 2016 Test S8.1 E . . . 61
B.51 Wind Rose - 23 October 2016 Test S8.2 E . . . 62
B.52 Wind Rose - 23 October 2016 Test S8.3 E . . . 62
B.53 Wind Rose - 23 October 2016 Test S9.1 E . . . 62
B.54 Wind Rose - 23 October 2016 Test S9.2 E . . . 63
B.55 Wind Rose - 23 October 2016 Test S9.3 E . . . 63
B.56 Wind Rose - 24 October 2016 Test S9.4 E . . . 63
B.57 Wind Rose - 24 October 2016 Test S9.5 E . . . 64
B.58 Wind Rose - 24 October 2016 Test S8.4 E . . . 64
B.59 Wind Rose - 24 October 2016 Test S8.5 E . . . 64
List of Tables
2.1 Vehicle mass measurements. . . 72.2 Test matrix for three-truck-platoon fuel-economy tests. . . 11
3.1 Estimates of drag force, rolling resistance, and road load for an individual tractor-trailer at the ground speeds and weights tested. . . 25
3.2 Results from fuel consumption tests. . . 26
A.1 Control and test vehicle specifications. . . 41
Nomenclature
Symbols:
A Reference area
CD Drag coefficient
∆F Fuel savings
FAero Aerodynamic drag force
FGrade Grade force
FRL Road load
FRR Rolling resistance
Q Dynamic pressure
T/C Ratio of test-vehicle fuel consumption to control-vehicle fuel consumption
U Speed
W Vehicle weight
∆W Weight of fuel consumed
WACD Wind-averaged drag coefficient
µ Rolling resistance coefficient
ψ Yaw angle of wind relative to the vehicle
ρ Air density
Acronyms:
CACC Cooperative adaptive cruise control
CFD Computational fluid dynamics
CFTR Centre de Formation du Transport Routier de Saint-Jerome
DSRC Dedicated short-range communication
DOT U.S. Department of Transportation
DPF Diesel particulate filter
ECCC Environment and Climate Change Canada
FHWA Federal Hihgway Administration
eTV ecoTECHNOLOGY for Vehicles
GHG Greenhouse gas
HDV Heavy duty vehicle
ITS Intelligent transportation systems
LDV Light duty vehicle
MVTC Motor Vehicle Test Centre
NACFE North American Council for Freight Efficiency
NRC National Research Council Canada
PATH Partners for Advanced Transportation Technology
RCC Regulatory Cooperation Council
SAE Society of Automotive Engineers
TC Transport Canada
1. Introduction
1.1 Background
Transport Canada (TC), through its ecoTECHNOLOGY for Vehicles (eTV) program, under-takes testing and evaluation of new and emerging vehicle technologies. The program helps inform various stakeholders that are engaged in the development of regulations, codes, stan-dards, and products for the next generation of advanced light-duty vehicles (LDVs) and heavy-duty vehicles (HDVs). Results are helping to inform the development of environmental and safety regulations to ensure that new technologies can be introduced in Canada in a safe and timely manner.
There have been many efforts to reduce the aerodynamic drag of Heavy Duty Vehicles (HDVs). The majority of these efforts includes applying modifications to several aspects of the vehicle design which are costly (Bergenheim et al., 2012). There are, however, other approaches that benefit from positive aerodynamic effects occurring naturally around a moving vehicle. Ve-hicle platooning is one of these methods which is defined as two or more veVe-hicles traveling at the same speed with relatively small inter-vehicle spacing. It has been reported in the lit-erature that vehicle platooning can result in aerodynamic drag reduction as well as improved safety and reduced traffic congestion (Watkins and Vino, 2008; Gaudet, 2014).
Vehicle-to-Vehicle (V2V)-based cooperative HDV truck platooning systems are nearing com-mercialization. However, there is a knowledge gap in terms of the reliability and resiliency of these systems. Further testing and evaluation is required to help qualify and quantify their overall operational, safety, and environmental performance. The University of Califor-nia (Berkeley) Partners for Advanced Transportation Technology (PATH) has been a leader in Intelligent Transportation Systems (ITS) research since its founding in 1986. PATH has ex-perimentally implemented automated truck platooning on two tractor-trailer trucks in 2003 (Browand et al., 2004) and on three tractor-trailer trucks in 2010-11 (Tsugawa et al., 2016). These trucks used V2V communication in addition to forward sensors to help maintain constant clearance for vehicles following at very short gaps (tested from 10 m down to 3 and 4 m gaps). Some tests have included measurements of energy savings at constant-speed-following as well as manoeuvres to join and split from the platoon, and travelling up and down grades. Under a new U.S. Federal Highway Administration (FHWA) Exploratory Advanced Research Project, PATH has been developing and testing a second-generation truck-platooning technology us-ing cooperative adaptive cruise control (CACC), in collaboration with Volvo Trucks.
Transport Canada has been successful in partnering with PATH to secure the PATH CACC sys-tem for testing and evaluation purposes at TC’s Motor Vehicle Test Centre (MVTC). The Na-tional Research Council Canada (NRC) has supported TC’s effort to host the fuel-consumption testing campaign for the PATH truck-platooning technology demonstrations. The NRC, un-der direction from TC and with support from FPInnovations PIT Group, conducted a modified version of the SAE J1321 Type II fuel consumption test procedure at the TC MVTC to evaluate the fuel-savings benefits of platooning for various aerodynamic tractor-trailer configurations.
Assistance from the FPInnovations PIT Group was provided to the NRC/TC for the coordina-tion and execucoordina-tion of the test program.
1.2 Project Partners
The various Canadian and U.S. project partners, and their roles in the project, are as follows: • Transport Canada (TC) - Canadian funding partner, through its ecoTECHNOLOGY for
Vehicle program.
• U.S. Federal Highway Administration (FHWA) - U.S. funding partner, through its Ex-ploratory Advanced Research Program.
• California Partners for Advanced Transportation Technology (PATH) at U.C. Berkeley -Principle research partner and system integrator.
• California Department of Transportation (Caltrans) - Project management and coordina-tion for U.S. project partners.
• Volvo Trucks - Vehicle provider and technical support for system integration.
• National Research Council Canada (NRC) - Project management for Canadian compo-nent and principle test coordinator.
• FPInnovations PIT Group - On-site technical support and coordination. • PMG Technologies - Track operator.
• Centre de Formation du Transport Routier de Saint-Jérome (CFTR) - Supplier of drivers. • Environment and Climate Change Canada (ECCC) - Supplier of control vehicle.
1.3 Objectives and Outcomes
The primary objective of the test program was to evaluate the fuel-savings potential of the three-vehicle cooperative truck platooning system over a range of vehicle separation times that are expected to be suitable for platooning operations from a driver-comfort perspective. The data are to supplement separate testing by PATH on driver response and comfort over the same range of separation times. Secondary objectives were to investigate the variability in fuel-savings potential for changes in vehicle speed and weight, and with the addition of fuel-saving aerodynamic technologies for the trailer.
Additionally, this test program will provide the following benefits and outcomes:
• The work will directly support the U.S.-Canada Regulatory Cooperation Council’s (RCC) U.S. Department of Transportation / Transport Canada Connected Vehicles Working Group through the development and alignment of connected vehicle standards to pro-mote interoperability of these technologies across North America.
• The results will directly support Environment and Climate Change Canada’s (ECCC) HDV greenhouse gas (GHG) emissions regulations for model years 2018 and beyond. • The work directly supports and complements both US Department of Transport (U.S.
DOT) and private sector sponsored cooperative truck platooning demonstration projects that are currently happening in the U.S. including California and Texas.
1.4 Approach
Fuel-economy testing based on the SAE J1321 Type II procedure (SAE J1321, 2012) was under-taken in October 2016 at TC’s Motor Vehicle Test Centre in Blainville, Québec. This approach was selected based on previous experiments on truck platooning systems (see literature sur-vey in next section). The SAE procedure consists of a standard test approach that provides reliability in the resulting data, including appropriate estimates of measurement uncertainty. The test plan was developed in consultation between NRC, PATH, TC, and FHWA to support the objectives of each primary project partner.
1.5 Aerodynamic Benefits of Truck Platooning
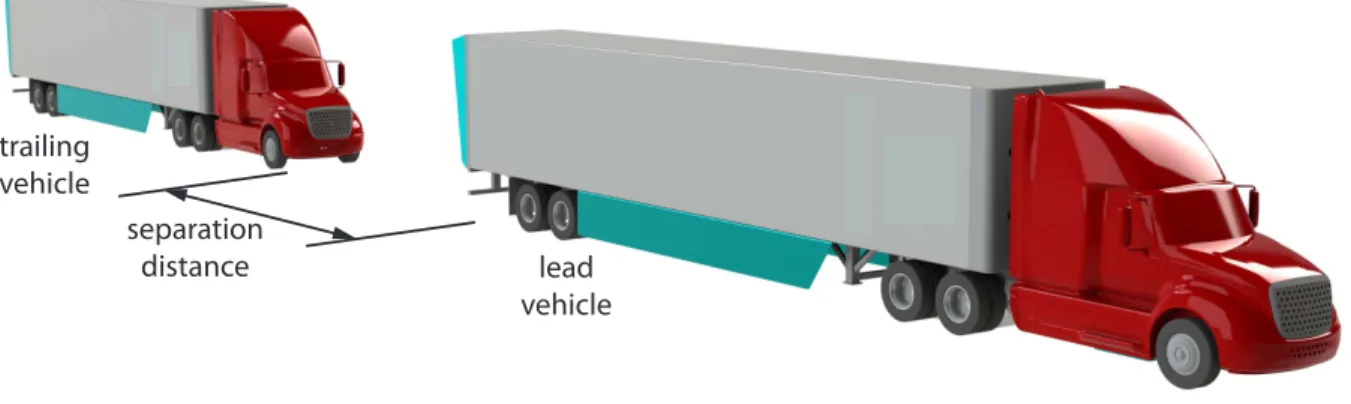
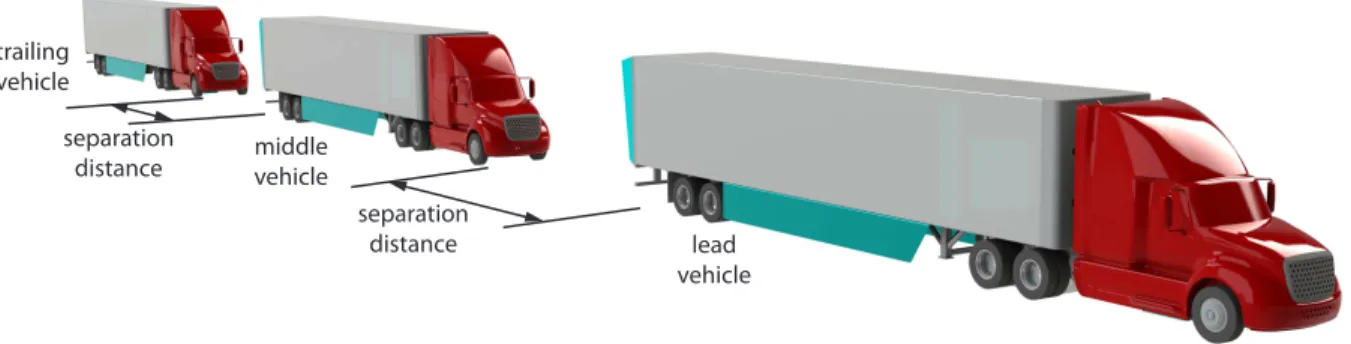
The majority of aerodynamic drag of a ground-vehicle consists of “form” or “pressure” drag generated by the pressure differential between the front (high pressure field) and the rear (low pressure field) surfaces of the vehicle (Patten et al., 2012). The aerodynamic benefit of platooning is primarily the result of the change in the aerodynamic pressure fields over the front and rear surfaces of vehicles present in a platoon configuration. In platoon configuration, like that shown in Figure 1.1, the lead vehicle takes advantage of the increased pressure in the gap between vehicles, especially for small gap sizes. The pressure increase in the back of the lead vehicle, due to the following vehicle, results in less pressure differential between its front and rear surfaces which reduces its aerodynamic drag. The trailing vehicle also benefits from
separation
distance lead
vehicle trailing
vehicle
separation distance lead vehicle middle vehicle separation distance trailing vehicle
Figure 1.2:Schematic of a three-vehicle HDV platoon
the flow-field in the region between the two vehicles, which is dominated by the wake of the lead vehicle. The trailing vehicle is shielded from high-speed air resulting in the reduction of the high-pressure stagnation region at its front, thereby reducing its aerodynamic drag. In platoon configurations consisting of more than two vehicles, like that shown in Figure 1.2, the intermediate vehicles are believed to gain the most drag reduction among the other platoon members since they experience favourable changes in the pressure fields of both their front and rear surfaces. The reduced pressure at the front surface and the increased pressure at the rear surface lead to a reduction in the pressure differential between the front and rear surfaces of intermediate vehicles resulting in reduced aerodynamic drag. This, however, depends on many factors such as vehicle geometrical characteristics, platoon spacing, ambient wind, and traffic conditions (Tadakuma et al., 2016).
Many studies have been performed on vehicle platooning but only a small portion focused on the aerodynamic effects. These studies have investigated the aerodynamic behavior of dif-ferent vehicle sizes from small-size car models to HDVs via various analysis tools including full-scale road testing, wind tunnel measurements, and computational fluid dynamics (CFD). Many researchers have focused on the simplest platoon case consisting of two identical ve-hicles moving at the same speed with no lateral offset (Bonnet and Fritz, 2000; Hammache et al., 2002; Browand et al., 2004; Al Alam et al., 2010; Roeth, 2013; Lammert et al., 2014; Humphreys and Bevly, 2016; and Smith et al., 2014). Recently, the North American Council for Freight Efficiency (NACFE) published a confidence report that summarizes many of the truck-platoon fuel-economy tests performed to date (Roberts et al., 2016). Despite some dis-crepancies, there are several common trends reported in these studies that can be summarized as follows.
Both lead and trailing vehicles demonstrate reduced aerodynamic drag especially for gap sizes shorter than one vehicle length. In most cases, the downstream vehicle achieved higher drag
reductions than the lead vehicle for moderate to long distances between vehicles ('10 m). For
very small inter-vehicle distances (/10 m), shorter than a half of a vehicle length, there are
contradicting results in the literature where a few studies reported the lead vehicle achieves higher fuel savings while others showed greater fuel consumption improvement for the trail-ing vehicle. Furthermore, the gap size between the platoontrail-ing vehicles influences each ve-hicle’s drag behavior individually. In general, both lead and trailing vehicles achieve higher drag reductions when the gap decreases from long to moderate distances. For very small gaps,
shorter than a half of vehicle length, some studies (Bonnet and Fritz, 2000; Lammert et al., 2014; Humphreys and Bevly, 2016; and Smith et al., 2014) showed that the lead vehicle’s drag reduc-tion continues to improve while the trailing vehicle experiences a loss in its drag reducreduc-tion by decreasing the vehicle gap. A couple of CFD studies (Smith et al., 2014; and Gheyssens and Van Raemdonck, 2016) investigated this discrepancy and found that the different geometri-cal features at the frontal surfaces of trucks have a significant impact on the aerodynamics of platooning vehicles with small gaps. They explained that the wake of the upstream vehicle influences the trailing vehicle in two ways. On one hand, it shields the trailing vehicle which results in reducing the stagnation pressure in front of the trailing vehicle. On the other hand, it reduces the suction or thrust force on the curved frontal surfaces of the trailing vehicle. The suction force is a function of the local Reynolds number (Wood, 2015) and is reduced at small inter-vehicle gaps due to the reduced local Reynolds number in the gap region. Smith et al. (2014) and Gheyssens and Van Raemdonck (2016) found that for platooning vehicles with small gaps, the negative effect of suction-force reduction is dominant compared to the posi-tive effect of stagnation-pressure reduction, and therefore the trailing vehicle loses the drag reduction benefits.
While most of the HDV platooning studies have focused on the fundamental scenario of a two-vehicle platoon, there are a handful of studies on multiple-vehicle HDV platoons. In a numerical-experimental study on a three-truck platoon, Tsugawa et al. (2011) examined the aerodynamic performance of three 25-ton heavy trucks driving at a speed of 80 km/h. They measured the fuel consumption of the platoon at several vehicle-separation distances ranging from 4.7 m to 20 m. The average fuel saving for the platoon unit was 18% at 4.7 m gap and decreased to 9% at 20 m gap. In all cases studied by Tsugawa et al. (2011) the lead truck showed the lowest amount of fuel saving. For shorter gap distances (<15 m), the middle truck achieved the largest amount of fuel saving while the trailing truck’s fuel improvement was greater at larger gaps of 15 and beyond. They also used numerical simulations to determine the aerodynamic drag reduction associated with the fuel saving of the platoon unit for 80 km/h speed at a 4 m separation gap. They reported drag reductions of more than 20% for the lead and the trailing vehicles while the middle truck was shown to achieve 50% drag reduction. Ellis et al. (2015) numerically studied three-vehicle platoons of Class 8 trailer-tractor configu-rations at two different vehicle spacings using high-fidelity CFD. They reported an averaged drag reduction in the range of 20% per vehicle at 9 m vehicle spacing while reducing the spacing to 5 m resulted in about 5% additional drag saving. They also investigated the ef-fectiveness of adding improved aerodynamic devices such as trailer side-skirts and boat-tails on trucks in a platoon configuration. They found that platooning is more beneficial for the aerodynamically-treated vehicles. The effect of location within the platoon on each vehicle’s drag saving was also investigated by Ellis et al. (2015). For 9 m vehicle spacing, the middle vehicle achieved the most drag reduction, followed by the trailing vehicle, and the lead vehi-cle had the lowest amount of drag saving. This pattern was changed by reducing the vehivehi-cle spacing to 5 m where the lead vehicle showed more drag reduction than the trailing vehicle while the middle vehicle still had the highest drag reduction.
Gheyssens and Van Raemdonck (2016) studied the effect of crosswind on a platoon by
expos-ing the platoon to an incomexpos-ing flow at a yaw angle of 3◦. Although the drag variation of
depended on the frontal edge radius of the simplied vehicle shapes. The drag reduction of the platoon was improved under crosswind conditions for the vehicles having a small frontal edge radius while the crosswind had a negative effect on the platoon’s drag saving for vehi-cles with large frontal edge radii. Gheyssens and Van Raemdonck (2016) also reported that the side force was significantly reduced for the middle and trailing vehicles in the platoon due to the redirection of flow by the lead vehicle, while the lead vehicle experienced almost the same side force as its isolated case.
Since the number of studies on multiple-HDV platoons is fairly limited, additional insights could be gained from related studies on vans or vehicle models having similar shapes and aerodynamic characteristics to those of HDVs. In a CFD study on multiple-vehicle platoons (up to six vehicles), Schito and Braghin (2012) studied the effect of vehicle shape, number of vehicles and relative distance between the vehicles on the platoon’s aerodynamic performance. They used different representative vehicle shapes including compact cars, sedans and vans. For platoons of identical vans, no additional drag reduction was observed for the platoon beyond 4 vehicles. Schito and Braghin (2012) also reported the highest drag saving occurred for middle vehicles followed by the last vehicle, and the lead vehicle had the least amount of drag reduction.
Tsuei and Savas (2001) studied the transient aerodynamic behaviour of two four-vehicle pla-toon configurations with 0.4 vehicle-length spacing in a series of wind tunnel tests. They used a sedan model and a rectangular box model representative of a mini-van or a bus. They stud-ied the number of the vehicles in the platoon (from two to four) and reported that the platoon’s averaged drag reduction increased with the number of vehicles in the platoon. They measured the highest drag saving for middle vehicles followed by the trailing and lead vehicles.
Marcu and Browand (1999) examined the effect of wind angularity on the aerodynamic per-formance of a three-vehicle platoon in a wind tunnel investigation. They used 1/8 scaled
mini-vans at 10◦crosswind with the vehicle spacing varying from 0 to 0.72 of a vehicle length.
They measured an averaged drag reduction of 39% for three vehicles at a vehicle spacing of 0.2 vehicle lengths under crosswind conditions, while the platoon at zero yaw condition showed a slightly larger reduction (average of 42%). Under crosswind conditions, the vehicle platoon achieved a reduction in drag over the entire range of vehicle spacings examined, with the largest reductions at the shortest spacings. In this study, the middle vehicle showed the high-est drag reduction, while the drag improvement of the lead vehicle was higher than that of the trailing vehicle for all vehicle spacings studied. Marcu and Browand (1999) also measured the side forces and yawing moments of platooning vehicles under crosswind conditions and reported that the side forces and yawing moments were significantly lower for the second and third vehicles while the lead vehicle experienced the largest side force and yawing moment. They attributed this to the redirection of the airflow by the lead vehicle as also observed by Gheyssens and Van Raemdonck (2016).
2. Test Setup
2.1 Cooperative Adaptive Cruise Control System
The control system for maintaining vehicle spacing is based on Volvo’s adaptive cruise control (ACC) technology that uses radar and video to sense the distance to forward vehicles. The system has been supplemented with 5.9 GHz dedicated short-range communication (DSRC) radios for vehicle-to-vehicle (V2V) communication that enables implementation of a higher-performance control system with faster response to speed changes and a greater level of sta-bility to the multi-vehicle system. Shladover et al. (2015) describe the concepts upon which this Cooperative ACC (CACC) system are based.
2.2 Test Vehicles and Configurations
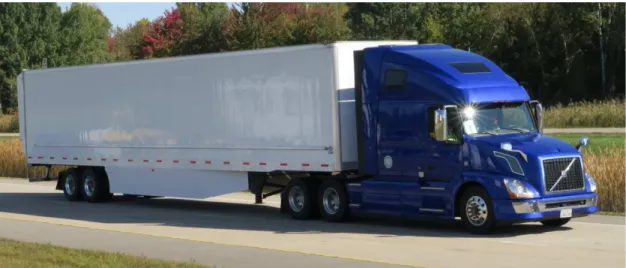
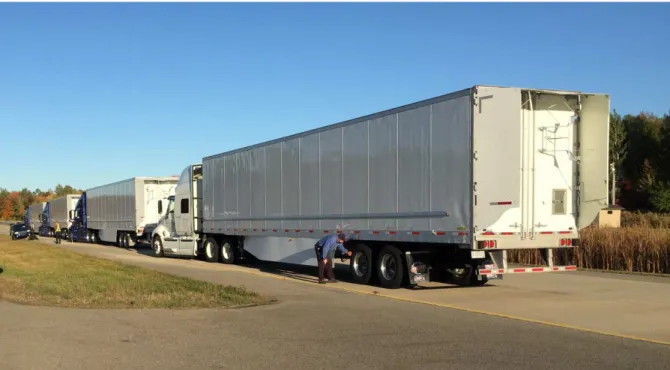
Four tractor-trailer combinations were used as part of the fuel-economy tests. The control tractor was a 2013 International ProStar aerodyamic sleeper-cab, and the three identical test tractors were MY2015 Volvo model VNL 670 aerodynamic sleeper-cabs. The same model of 53 ft dry-van trailers, Utility model 4000D-X, was used for all four test vehicles. Figures 2.1 shows one of the test trucks and Figure 2.2 shows the control truck. The four trucks parked for refuelling and weighing are shown in Figure 2.3. The use of different tractor models for the test and control vehicles does not strictly conform to the SAE J1321 requirements, which specifies identical vehicles are to be used, although both are aerodynamically-treated tractors with sim-ilar engine specifications that were expected to behave simsim-ilarly in the controlled conditions of the tests. The tractor and trailer specifications are provided in Appendix A. Investigation of the fuel-use data from the tests reveals that, for the non-platooning measurements, the test vehicles used approximately 3% more fuel than the control tractor for the drive cycles used in the test campaign (see data in Appendix B).
Fuel levels in the main tanks of the control vehicle were adjusted to match the vehicle weight to that of the test vehicles. The mass of the vehicles as-tested are provided in Table 2.1. The trailers were ballasted using concrete blocks aligned evenly along the centreline of the trailer.
Table 2.1:Vehicle mass measurements.
Tractor Trailer Tractor Ballasted Total # Mass Trailer Mass Vehicle Mass 1 160315 8,515 kg 20,880 kg 29,395 kg 2 160327 8,505 kg 20,880 kg 29,385 kg 3 160311 8,585 kg 20,870 kg 29,455 kg Control 160325 8,650 kg 20,850 kg 29,500 kg
Figure 2.1:Photograph of Test Truck 1.
Figure 2.2:Photograph of the Control Truck.
For some of the tests, the trailers were outfitted with two aerodynamic technologies: side-skirts (Transtex Edge) and a boat-tail (Stemco TrailerTail Trident). These two aerodynamic devices are shown installed on the trailers in Figures 2.1 and 2.2, and photographs showing more details of the side-skirts and boat-tail are provided in Figure 2.4.
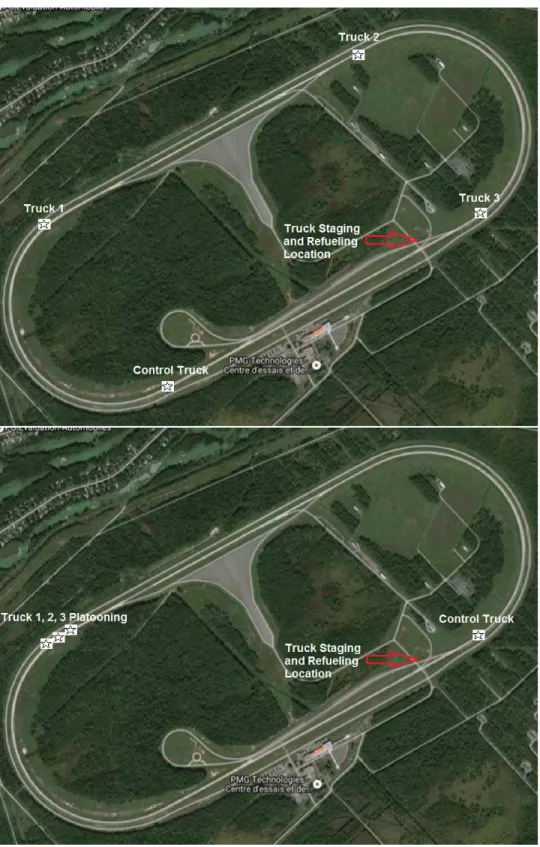
2.3 Test Site
Testing was performed at the Motor Vehicle Test Centre operated by PMG Technologies in Blainville, Quebec. The “Bravo” track was used for testing, which is a high-speed banked oval and the primary surface is rain-grooved concrete. The track is 6.5 km (4.0 miles) long with two straight 1.6 km (1.0 mile) sections, and two 1.6 km (1.0 mile) constant-curvature banked sections. An aerial view of the test track is shown in Figures 2.5.
Figure 2.3:Test trucks 1, 2, 3, and the control truck parked in position on Bravo track during refuelling and tank weighing.
Figure 2.4:Photograph of side-skirts and boat-tail installed for the aerodynamic-trailer test
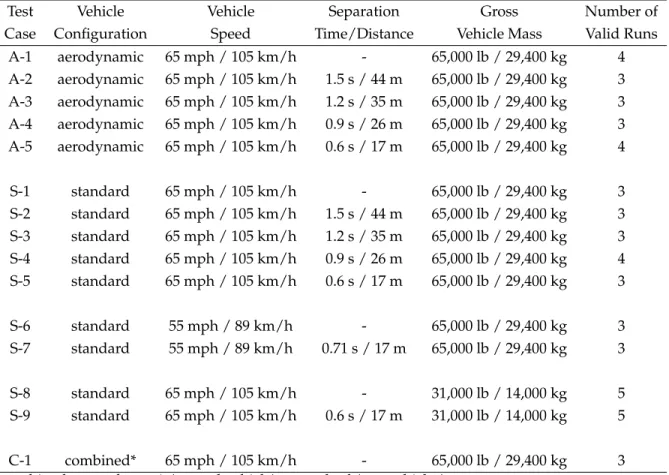
Figure 2.5:Satellite photograph of the test track (top - vehicle configuration for independent-vehicle test runs, bottom - independent-vehicle configuration for platooning test runs).
2.4 Test Matrix
A test program was devised to examine the influence of four parameters on the fuel-savings potential of the three-truck CACC-based platoon:
• Separation Distance/Time: 17 m (57 ft) to 43 m (142 ft), equivalent to 0.6 s to 1.5 s at 105 km/h.
• Truck configuration: standard trailer vs. aerodynamic trailer. • Vehicle speed: 89 km/h (55 mph) and 105 km/h (65 mph). • Vehicle weight: 14,000 kg (31,000 lbs) and 29,400 kg (65,000 lbs).
From this range of parameters, a test matrix was developed though consensus by the prin-ciple project partners (TC, PATH, NRC, FHWA) and is shown in Table 2.2. A decision was made to test the full range of separation distances for both trailer configurations (standard and aerodynamic), after which the influence of vehicle speed and weight were tested for the best-performing separation distance only, that being the shortest distance. For each change in
Table 2.2:Test matrix for three-truck-platoon fuel-economy tests.
Test Vehicle Vehicle Separation Gross Number of
Case Configuration Speed Time/Distance Vehicle Mass Valid Runs
A-1 aerodynamic 65 mph / 105 km/h - 65,000 lb / 29,400 kg 4 A-2 aerodynamic 65 mph / 105 km/h 1.5 s / 44 m 65,000 lb / 29,400 kg 3 A-3 aerodynamic 65 mph / 105 km/h 1.2 s / 35 m 65,000 lb / 29,400 kg 3 A-4 aerodynamic 65 mph / 105 km/h 0.9 s / 26 m 65,000 lb / 29,400 kg 3 A-5 aerodynamic 65 mph / 105 km/h 0.6 s / 17 m 65,000 lb / 29,400 kg 4 S-1 standard 65 mph / 105 km/h - 65,000 lb / 29,400 kg 3 S-2 standard 65 mph / 105 km/h 1.5 s / 44 m 65,000 lb / 29,400 kg 3 S-3 standard 65 mph / 105 km/h 1.2 s / 35 m 65,000 lb / 29,400 kg 3 S-4 standard 65 mph / 105 km/h 0.9 s / 26 m 65,000 lb / 29,400 kg 4 S-5 standard 65 mph / 105 km/h 0.6 s / 17 m 65,000 lb / 29,400 kg 3 S-6 standard 55 mph / 89 km/h - 65,000 lb / 29,400 kg 3 S-7 standard 55 mph / 89 km/h 0.71 s / 17 m 65,000 lb / 29,400 kg 3 S-8 standard 65 mph / 105 km/h - 31,000 lb / 14,000 kg 5 S-9 standard 65 mph / 105 km/h 0.6 s / 17 m 31,000 lb / 14,000 kg 5 C-1 combined* 65 mph / 105 km/h - 65,000 lb / 29,400 kg 3
vehicle shape, speed, or weight, a baseline test segment was first performed with the vehicles spaced a quarter track length (1.6 km / 1.0 mi) from each other to represent the undisturbed non-platoon scenario (test cases A-1, S-1, S-6, S-8). In addition, to provide a link between the standard-trailer data set and the aerodynamic-trailer data set, an independent-vehicle test seg-ment was performed to characterize the influence of the aerodynamic devices applied to the trailer (test case C-1), separate from the influence of the platoon.
2.5 Fuel Consumption Measurements
2.5.1 Fuel System Modifications
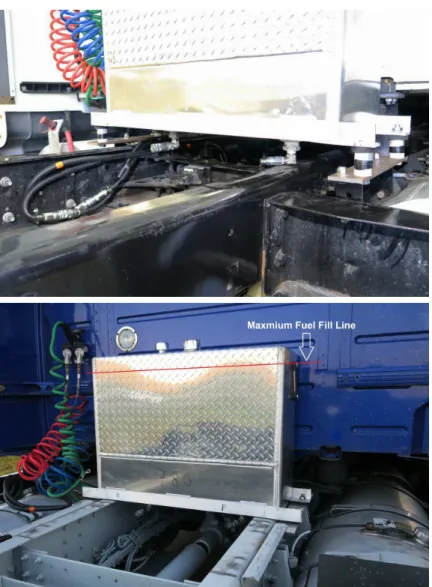
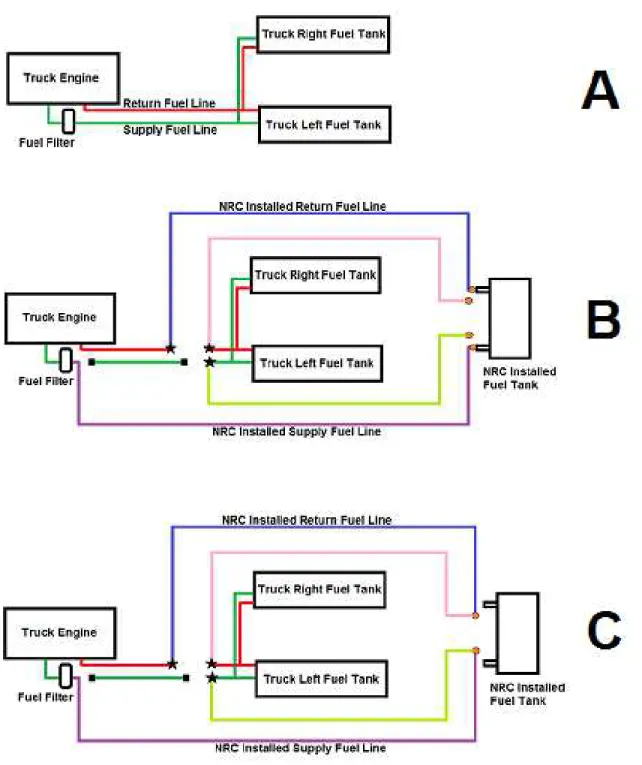
Auxiliary fuel tanks were installed on each tractor to allow measurement of the fuel used dur-ing each run. These were mounted on the frame rails in the tractor-trailer gap (see Figure 2.6). To allow switching between the stock fuel tanks and the auxiliary fuel tank, the manufacturer-installed fuel line connected to the input of the truck fuel filter was removed, capped off, and replaced by a NRC-installed hose. This NRC-installed hose was run from the fuel filter to the auxiliary fuel tank. The new supply fuel hose was connected to the auxiliary tank using flat face double ended shutoff (quick couplers). Fuel-line routing for the stock tanks and for the auxiliary tank are shown in Figure 2.7.
Figure 2.7 (A) shows the stock fuel system routing where the fuel is supplied from the two manufacturer-installed side fuel tanks. Figure 2.7 (B) shows the modifications performed to the truck fuel system routing to allow the NRC installed tank to provide fuel to the truck engine. Figure 2.7 (C) shows the modifications performed to the truck fuel system hose routing to allow the NRC installed tank to be switched over to the manufacturer-installed side fuel tanks. This configuration allowed the truck to operate from the manufacturer side fuel tanks when in transit to and from the NRC Ottawa campus, where the fuel-system modifications were performed, and the PMG test track in Blainville.
2.5.2 Fuel Tank Filling
Diesel fuel was stored in a large above ground storage tank located directly beside the truck staging area on Bravo track. Fuel was transferred using an electric pump from the large track side storage fuel tank to two 40 gallon fuel drums housed in the bed of an NRC shop truck. When the test trucks required refueling the NRC shop truck was driven onto Bravo track beside each test truck and fuel was transferred from the 40 gallon fuel drums to the test truck auxiliary installed fuel tank. Figure 2.6 shows the maximum fuel fill level of the auxiliary tanks. A sight glass on the right side of the tanks was used to confirm the tank fill level.
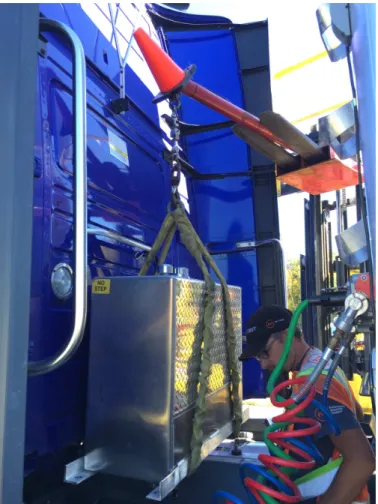
Figure 2.6:Fuel tank installed on frame rails behind the tractor cab (top - control truck, bottom - test truck).
2.5.3 Fuel Measurement Instrumentation
An LCCA-500 S-beam load cell (500 lb range) was used to weigh the fuel tanks before and after each run. Calibration verifications were performed throughout the test program. Calibrated 20 kg weights were used to perform verifications in increments of 20 kg from 20 kg to 120 kg. Deviations between the recorded and actual weight were no greater than 0.03%.
2.5.4 Fuel Measurement Procedure
Figure 2.3 (Page 9) shows the three test trucks and the control truck parked for the fuel-weighing procedure between runs. The truck cabs were parked with an articulation angle
Figure 2.7:Fuel system routing (A Truck 1, 2, 3 and Control stock fuel system routing, B -NRC modified fuel system routing configured to fuel engine from -NRC installed fuel tank, C - NRC modified fuel system routing configured to fuel engine from truck main tanks).
of approximate 15◦ in relation to the trailers, allowing easier forklift access to the auxiliary
tank from the passenger side of the vehicle.
The fuel weighing procedure described below was repeated on Truck 1, Truck 2, Truck 3 and the Control Truck before and after each test run, and required 20 to 25 minutes to complete. Figure 2.8 shows a photograph taken during the weighing procedure.
1. A forklift was positioned with its forks raised and a boom attachment extended between the cab of the truck and its trailer.
2. The four nuts attaching the NRC installed fuel tank to the truck frame were removed using a cordless impact gun.
3. The fuel supply and return lines were disconnected, using the installed flat face double ended shut-off (quick couplers), from the fuel tank.
4. Data acquisition was started and the load cell was zeroed.
5. The load cell was raised into position by the forklift above a lifting sling which is wrapped vertically around the auxiliary fuel tank.
6. The lifting sling was attached to a hook connected below the load cell and raised until the auxiliary fuel tank was clear of its mounting position on the truck.
7. The tank was steadied to ensure minimal swaying and a visual check was performed to ensure the tank was not in contact with any part of the truck before a reading was captured by the data acquisition system.
8. The fuel tank remained raised until a minimum of 10 consecutive seconds of stable data were obtained before being lowered back onto its mounting location on the truck. 9. The four fuel tank mounting nuts were reinstalled and tightened with a cordless impact
gun.
10. The quick coupler fuel supply and return lines were reconnected to the fuel tank, and a visual inspection was performed for any fuel leaks.
2.5.5 Regenerations
For both truck types used, once the manufacturer-predetermined diesel particulate filter (DPF) soot level is exceeded, a regeneration process will occur while the truck is in operation. A regeneration cycle may last between 30-45 minutes. Additional fuel is used during this process compromising the accuracy for SAE J1321 fuel economy testing. The occurrence and timing intervals of the process is not obvious to the driver.
During official testing, only one unscheduled regeneration cycle was experienced on
Octo-ber 7th for the control truck. An additional test run was added to the test matrix as a
replace-ment. The test trucks did not experience any unscheduled regeneration cycles during official testing. This was ensured by monitoring the vehicle-reported DPF soot levels after each run. If the soot level reading was close to the predetermined trigger level set by the truck manufac-turer, a regeneration cycle was initiated manually.
2.5.6 Wind Measurements
Site and track-side wind measurements were performed during the test campaign. An on-site weather station, positioned at 10 m height and approximately 50 m from the track provides the wind speed and direction, along with the temperature and barometric pressure. For segments of the test, 10-minute mean data were available from this anemometer, with hourly means available at all other times. To collect wind data closer to the track and at vehicle mid-height, an ultrasonic anemometer was placed adjacent to the south-side straight segment of the track, 8 m from the track centreline, with the sensor 2 m above track surface. This track-side ultra-sonic anemometer was used as the primary reference to gauge the wind speeds experienced by the truck, with the weather-station data used as a secondary reference. The wind-data mea-sured during the test runs, including the minima, means, and maxima and the wind roses for each run, are provided in Appendix B.
2.6 Test Procedure
2.6.1 Daily Pre-Test Checks
Test staff arrived at the test track daily between 6:00 and 7:00 AM. Tire pressure and vehicle visual inspections were performed by PIT and NRC personnel. CFTR drivers performed an industry standard pre-trip inspection on their designated truck and trailer noting any defi-ciencies. The drivers also thoroughly cleaned the truck wind shields and mirrors.
2.6.2 Specific Test Procedures
Three types of test runs were completed during the test campaign. For each, the vehicles travelled 103 km (64 miles, 16 laps).
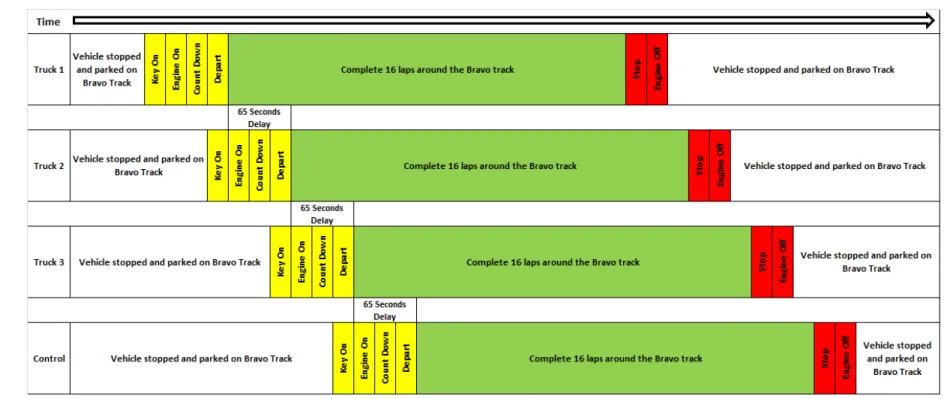
1. Baseline test segment - Vehicle fuel consumption is measured simultaneously for all the vehicles (control and test) spaced approximately 1.6 km from each other, forming the reference measurements against which the test segments will be compared (vehicle con-figuration shown in top image of Figure 2.5). This procedure is listed in Figure 2.9 and shown schematically in Figure 2.10.
2. Independent vehicle test segment - Vehicle fuel consumption is measured in the same manner as the Baseline Segment, but with changes made to the test vehicles (vehicle configuration in top image of Figure 2.5). This procedure is listed in Figure 2.9 and shown schematically in Figure 2.10.
3. Platooning test segment - Vehicle fuel consumption is measured with the three test trucks in a platoon formation spaced approximately 3.2 km from the control vehicle (vehicle configuration shown in bottom image of Figure 2.5). This procedure is listed in Figure 2.11 and shown schematically in Figure 2.12.
Baseline and Independent-Vehicle Test Procedure
Truck 1 Key on and wait 15 seconds for systems to run diagnostic check Truck 1 Engine start and idle for 10 seconds
Truck 1 Driver receives radio count down from 5 seconds to 0 Truck 1 Departure
Wait 65 seconds
Truck 2 Key on and wait 15 seconds for systems to run diagnostic check Truck 2 Engine start and idle for 10 seconds
Truck 2 Driver receives radio count down from 5 seconds to 0 Truck 2 Departure
Wait 65 seconds
Truck 3 Key on and wait 15 seconds for systems to run diagnostic check Truck 3 Engine start and idle for 10 seconds
Truck 3 Driver receives radio count down from 5 seconds to 0 Truck 3 Departure
Wait 65 seconds
Truck 4 Key on and wait 15 seconds for systems to run diagnostic check Truck 4 Engine start and idle for 10 seconds
Truck 4 Driver receives radio count down from 5 seconds to 0 Truck 4 Departure
Truck 1, 2, 3 and Control complete 16 laps of Bravo track Radio confirmation with all drivers of final lap
Truck 1 Truck stopped at designated stop area (pylon marker)
Truck 1 Truck shifted to neutral and supply and service brakes engaged
Truck 1 Driver receives radio count down from 5 seconds to 0 before engine shut down Truck 1 Engine shut down
Truck 2 Truck stopped at designated stop area (pylon marker)
Truck 2 Truck shifted to neutral and supply and service brakes engaged
Truck 2 Driver receives radio count down from 5 seconds to 0 before engine shut down Truck 2 Engine shut down
Truck 3 Truck stopped at designated stop area (pylon marker)
Truck 3 Truck shifted to neutral and supply and service brakes engaged
Truck 3 Driver receives radio count down from 5 seconds to 0 before engine shut down Truck 3 Engine shut down
Truck 4 Truck stopped at designated stop area (pylon marker)
Truck 4 Truck shifted to neutral and supply and service brakes engaged
Truck 4 Driver receives radio count down from 5 seconds to 0 before engine shut down Truck 4 Engine shut down
L TR-AL-2017-0008 Fuel-Economy T esting of a Thr ee-T ruck Platoon
Figure 2.10:Schematic representation of test procedure for baseline test and independent-vehicle test segments.
Unclassified
Unlimited
Platooning Test Procedure
Truck 1 /2 /3 Key on and wait 15 seconds for systems to run diagnostic check Truck 1 /2 /3 Engine start and idle for 10 seconds
Truck 1 /2 /3 Driver receives radio count down from 5 seconds to 0 Truck 1 /2 /3 Departure from staging area on Bravo track
Control Held at start staging area on Bravo track
Trucks 1, 2, and 3 radio confirmation received indicating successful linking (platooning) Trucks 1, 2, and 3 complete 1/3 of first lap around Bravo track
Control Key on and wait 15 seconds for systems to run diagnostic check Control Engine start and idle for 10 seconds
Control Driver receives radio count down from 5 seconds to 0 Control Departure from staging area on Bravo track
Truck 1, 2, 3 and Control complete 16 laps of Bravo track Radio confirmation with all drivers of final lap
Truck 1 /2 /3 Truck stopped at designated stop area (pylon marker)
Truck 1 /2 /3 Truck shifted to neutral and supply and service brakes engaged
Truck 1 /2 /3 Driver receives radio count down from 5 seconds to 0 before engine shut down Truck 1 /2 /3 Engine shut down
Control Truck stopped at designated stop area (pylon marker)
Control Truck shifted to neutral and supply and service brakes engaged
Control Driver receives radio count down from 5 seconds to 0 before engine shut down Control Engine shut down
L TR-AL-2017-0008 Fuel-Economy T esting of a Thr ee-T ruck Platoon
Figure 2.12:Schematic representation of test procedure for platooning test segments.
Unclassified
Unlimited
3. Results and Discussion
3.1 Data Analysis
The fuel-consumption data have been analysed using the method described in the SAE J1321 Type II procedure (SAE J1321, 2012). The method was devised to minimize the influence of environmental and external factors that may change from run to run or from day to day. It makes use of fuel-use ratios between the test vehicles and the control vehicle, and relies on an assumption that the change in external factors affects the control vehicle in the same manner as the test vehicles. The ratio of test-vehicle (T) fuel use to the control-vehicle (C) fuel use is defined as:
T/C = ∆WF,test
∆WF,control (3.1)
where ∆W represents the weight of the fuel consumed for the respective vehicle during a measurement run. The fuel-savings measure is based on averages of the T/C ratios from the respective baseline runs and test runs and calculated according to:
∆F = (T/C)baseline− (T/C)test
(T/C)baseline
(3.2) SAE J1321 (2012) includes a spreadsheet that performs the above calculation along with an es-timate of the measurement uncertainty. Data quality checks, described in SAE J1321 (2012), are performed by means of a comparative statistical analysis to define the validity of a measured
∆F value and assign an uncertainty value associated with a 95% confidence interval.
The test matrix was shown in Figure 2.2 on Page 11. To evaluate the combined influence of aerodynamic technologies and the CACC platooning system, the C-1 test case was performed to provide a link between standard-trailer test cases (S-1 to S-5) and the aerodynamic-trailer test cases (A-1 to A-5). In addition, when using case A-1 as a baseline, test case C-1 provides a measure of the fuel increase associated with removing the aerodynamic technologies from the trailers. Equation 3.2 can be used, with the “test” and “baseline” terms interchanged to provide the fuel savings associated with adding the aerodynamic devices to the standard trailer. To calculate the fuel savings associated with the combination of aerodynamic devices and the CACC system for a given separation distance, the following equation relates the aerodynamic-trailer platooning test results to the standard-aerodynamic-trailer independent-vehicle test results:
∆FPA/S = ∆FPA/A−∆FS/A
1−∆FS/A (3.3)
where subscript PA/S represents the fuel savings of the Platoon and Aerodynamic trailer rela-tive to the Standard trailer, where PA/A represents the fuel savings of the Platoon and Aerodyn-amic trailer relative to the AerodynAerodyn-amic trailer, and S/A represents the fuel savings of the Standard trailer relative to the Aerodynamic trailer. Combining results in this manner does not provide a direct method to calculate the associated measurement uncertainty, as is done
for the SAE J1321 procedure. To provide an estimate of the uncertainty, it has been assumed
that the uncertainties of the two independent parameters (δ∆FPA/Aand δ∆FS/A) are
indepen-dent, and as such, a combined uncertainty on ∆FPA/Scan be defined as
δ∆FPA/S=
q
δ∆FPA/A2 +δ∆FS/A2 . (3.4)
To gauge the influence of vehicle speed or weight on the fuel-savings potential of platooning systems, it is important to understand the manner in which the fuel use is expected to differ for changes in speed and weight of an independent vehicle. This can be estimated by evaluating the road load experienced by a vehicle under constant-speed conditions:
FRL = FAero+FRR+FGrade (3.5)
For the current test program undertaken on a track, the grade influence is negligible because
the vehicle does not attain a net increase in elevation over the test, hence FGrade =0.
The aerodynamic drag force is the parameter of most interest for the current investigation. The drag force for a vehicle can be defined as
FAero =Q CD(ψ) A (3.6)
where Q is the dynamic pressure, CD(ψ)is the drag coefficient and assumed to be a function
of the wind yaw angle relative to the vehicle ψ, and A is the vehicle reference area (typically the frontal area). The dynamic pressure of the wind (Q) is dependent on the air density (ρ) and wind speed relative to the vehicle (U):
Q= 1
2 ρ U
2 (3.7)
As a first-order approximation for long-distance testing, the yaw-variability of the drag
coef-ficient can be averaged and represented by a wind-averaged-drag coefcoef-ficient WACD, with the
reference wind speed equivalent to the vehicle ground speed Ug. Therefore
FAero= 12 ρ U2gWACD A (3.8)
No significant change in WACD is expected for the vehicle speed changes evaluated during
the test program.
The rolling resistance (FRR) associated with the tire contact with the road is caused primarily
by deformation of the tire material while in motion and is most influenced by the weight sup-ported by the wheels. As a first-order approximation, the net rolling resistance for the vehicle can be assumed a function of the vehicle weight (W) and a rolling resistance coefficient (µ):
FRR =µ W (3.9)
No significant change in the rolling-resistance coefficient would be expected for the changes in vehicle weight and speed evaluated during the test program.
Combining the assumptions above, the vehicle road load is approximated by
Table 3.1:Estimates of drag force, rolling resistance, and road load for an individual tractor-trailer at the ground speeds and weights tested.
Vehicle Speed Vehicle Weight Drag Force Rolling Resistance Road Load
Ug W FAero FRR FRL
105 km/h (65 mph) 29,400 kg (65 klb) 3,090 N (690 lbf) 1,740 N (390 lbf) 4,830 N (1,090 lbf) 89 km/h (55 mph) 29,400 kg (65 klb) 2,210 N (500 lbf) 1,740 N (390 lbf) 3,950 N (890 lbf) 105 km/h (65 mph) 14,000 kg (31 klb) 3,090 N (690 lbf) 780 N (180 lbf) 3,870 N (870 lbf)
In the subsequent discussions of this report, the speed-change and weight-change results are evaluated in the context of what might be estimated as a change due to the aerodynamic drag reduction associated with vehicle platooning. The following assumptions are used for these estimates:
• ρ = 1.2 kg/m3
• WACD= 0.57
• A = 10.7 m2
• µ = 0.006
from which the road-load has been estimated and is provided in Table 3.1 for the combination of vehicle speed and weight tested.
3.2 Fuel-Savings Measurement Results
The test results from the SAE J1321-based fuel consumption tests are provided in Table 3.2. The calculated fuel-savings values are associated with either the addition of aerodynamic devices to the trailers under isolated driving conditions (Test Variable = aero dev.), the platooning effect from use of the CACC system (Test Variable = CACC), or the combination of aerodynamic devices and platooning (Test Variable = CACC+aero). The “aero dev.” and “CACC” effects have been evaluated from the respective Test Case and Ref. Case runs using Equation 3.2. The “CACC+aero” results make use of Equation 3.3 to combine individual results to evaluate the combined effects.
The fuel consumed by the vehicles during each measurement run is documented in Table B.1 of Appendix B. The run-to-run variability of the fuel consumed by the control truck demonstrates the necessity for its use as part of the J1321 test procedure. For example, the fuel consumed by the aerodynamically-treated control truck varied between 27.8 kg (61.1 lbs) and 30.0 kg (66.1 lbs) during the 105 km/h (65 mph) test runs. These run-to-run differences (>7%) are of the same magnitude as the fuel-savings associated with the aerodynamic devices applied to the trailer or from the platooning effect, the results of which are discussed in the remaining sections of this chapter. This variability is largely a result of the changing environmental con-ditions. For these runs the mean winds varied between 1 km/h and 14 km/h and the mean
L TR-AL-2017-0008 Fuel-Economy T esting of a Thr ee-T ruck Platoon
Table 3.2:Results from fuel consumption tests.
Test Separation Trailer Vehicle Vehicle Test Ref. Lead Truck Middle Truck Trailing Truck Platoon Variable Distance/Time Configuration Speed Weight Case Case Fuel Savings Fuel Savings Fuel Savings Fuel Savings aero dev. - combined 105 km/h 29,400 kg C-1 A-1 7.6%±1.9% 7.5%±1.8% 6.3%±1.4% 7.1%±1.1% CACC 43.6 m / 1.5 s aerodynamic 105 km/h 29,400 kg A-2 A-1 0.3%±1.2% 6.7%±1.9% 10.4%±1.4% 5.8%±1.0% CACC 34.9 m / 1.2 s aerodynamic 105 km/h 29,400 kg A-3 A-1 -0.4%±0.7% 7.2%±1.9% 10.4%±1.5% 5.7%±0.8% CACC 26.2 m / 0.9 s aerodynamic 105 km/h 29,400 kg A-4 A-1 0.3%±1.0% 8.4%±1.9% 11.7%±1.4% 6.8%±0.9% CACC 17.4 m / 0.6 s aerodynamic 105 km/h 29,400 kg A-5 A-1 1.0%±0.7% 9.4%±1.5% 12.3%±1.3% 7.6%±0.8% CACC 43.6 m / 1.5 s standard 105 km/h 29,400 kg S-2 S-1 0.0%±1.1% 6.2%±1.5% 9.5%±1.8% 5.2%±1.4% CACC 34.9 m / 1.2 s standard 105 km/h 29,400 kg S-3 S-1 -0.4%±1.2% 6.1%±1.1% 9.8%±1.3% 5.2%±1.2% CACC 26.2 m / 0.9 s standard 105 km/h 29,400 kg S-4 S-1 -0.7%±0.4% 6.3%±0.6% 9.9%±0.9% 5.2%±0.6% CACC 17.4 m / 0.6 s standard 105 km/h 29,400 kg S-5 S-1 0.3%±1.1% 7.4%±1.1% 11.0%±1.2% 6.2%±1.1% CACC+aero 43.6 m / 1.5 s aerodynamic 105 km/h 29,400 kg A-2 A-1/C-1 7.9%±2.4% 13.7%±2.7% 16.0%±2.0% 12.5%±1.5% CACC+aero 34.9 m / 1.2 s aerodynamic 105 km/h 29,400 kg A-3 A-1/C-1 7.2%±2.2% 14.2%±2.7% 16.1%±2.1% 12.5%±1.4% CACC+aero 26.2 m / 0.9 s aerodynamic 105 km/h 29,400 kg A-4 A-1/C-1 7.9%±2.3% 15.3%±2.7% 17.3%±2.0% 13.5%±1.5% CACC+aero 17.4 m / 0.6 s aerodynamic 105 km/h 29,400 kg A-5 A-1/C-1 8.5%±2.2% 16.2%±2.5% 17.9%±2.0% 14.2%±1.4% CACC 17.4 m / 0.71 s standard 89 km/h 29,400 kg S-7 S-6 1.6%±0.8% 7.6%±1.1% 10.5%±1.4% 6.6%±1.0% CACC 17.4 m / 0.6 s standard 105 km/h 14,000 kg S-9 S-8 1.4%±1.6% 9.6%±1.8% 12.1%±1.1% 7.8%±1.5% NRC-CNRC Classification: Unclassified Distribution: Unlimited
temperature varied between 8◦C and 24◦C. For each test condition (combination of speed,
trailer configuration, and weight), the fuel-consumption measurements for the control vehicle also demonstrate a general trend towards increased fuel use with ambient wind speed (not shown here).
3.3 Influence of Aerodynamic Treatments
Combining test cases A-1 and C-1 provides a measure of the potential fuel-savings associ-ated with the side-skirts and boat-tail devices applied to the trailer. The first row of Table 3.2 provides the individual fuel-savings measurements associated with this aerodynamic device-package for the trailer, for each of the three trucks as well as the combined fuel savings for the three-vehicle fleet. Trucks 1 and 2 experienced nearly the same fuel savings from the aerody-namic devices, however Truck 3 experiences a fuel savings more than a percent lower than the other two vehicles, although the differences are within the statistical uncertainty of the mea-surements. These results, which represent the same technologies applied to identical vehicles, highlight the variability of fuel-economy testing for aerodynamic technologies. This variabil-ity may be the result of differences in vehicle performance, sensitivvariabil-ity to installation, or driver technique.
3.4 Influence of Separation Distance on Platooning Performance
The effect of vehicle separation distance on fuel consumption was investigated for the two trailer configurations (standard and aerodynamic), for which the fuel-savings measurements for the individual vehicles are presented in Figure 3.1. For this vehicle speed of 105 km/h (65 mph), the corresponding time-gap axis is shows on the upper edge of the plot.
The data in Figure 3.1 show that, for each respective trailer configuration, the middle and trailing vehicles experience fuel savings in excess of 6%, with a general trend of decreasing fuel savings with increasing separation distance. The trailing vehicle experiences the greatest fuel savings. This observation is also apparent in the three-truck platoon data of Tsugawa et al. (2011) for longer separation distances, and contrasts the trends at separation distances shorter than those tested here for which the middle vehicle was shown by Tsugawa et al. (2011) to experience the greater fuel savings.
The lead vehicle for both trailer configurations is shown to experience little to no change in fuel use for the range of separation distances tested here. The data summary presented by NACFE (Roberts et al., 2016) for two-truck platoons shows that the majority of road/track-test campaigns have observed a consistent trend in fuel savings for the lead vehicle at separation distances below approximately 15 m to 18 m (50 ft to 60 ft), beyond which no significant fuel savings have been observed. With the shortest distance of 17.4 m in the current study, the negligible fuel savings measured for the lead vehicle is therefore consistent with other studies. The negligible change in fuel savings for the lead vehicle provides some evidence to explain the differences between the middle and trailing vehicles. If the lead vehicle does not
experi-vehicle separation distance [m] time gapt [s] fuel s av ings , F[ % ] 0 10 20 30 40 50 60 70 0 0.5 1 1.5 2 -5 0 5 10 15 20 Standard Trailer Aerodynamic Trailer Lead Trailing Middle (r ef . to in d iv idual v e hi cl e o f s ame c on fi g. )
Figure 3.1:Variation in fuel-savings measurements with separation distance for each vehicle in
the platoon, vehicle speed of 105 km/hr, vehicle mass of 29,400 kg (measurements referenced to respective vehicle configurations in non-platooned arrangement). ence a measurable fuel savings at the shortest separation distance, it would therefore not be expected that the middle vehicle experience any influence of the trailing vehicle. The middle-vehicle fuel savings is therefore dominated by the low-speed air-wake of the lead middle-vehicle. The trailing vehicle experiences a greater fuel savings than the middle vehicle likely due to a com-pounding effect of the low-speed air-wakes of the lead and middle vehicles, producing an air-wake with a greater wind-speed deficit (relative to the moving vehicles) than the air-wake of an individual vehicle.
The data in Figure 3.1 shows that, for the middle and trailing vehicles specifically, a greater fuel savings was measured for the aerodynamic-trailer tests, compared to the standard trailer. The aerodynamic-trailer configuration shows a fuel-savings higher by 0.5% to 2%, with the largest differences at shorter separation distances. Part of this difference is due to the fact that the aerodynamic-trailer configuration has a lower starting drag, and hence lower road load, than the standard trailer. If the reduction in absolute aerodynamic drag associated with platooning were the same for each configuration, the aerodynamic-trailer configuration will demonstrate a larger percentage-based fuel savings as a result of its lower starting value. However, this effect is estimated to provide a difference on the order of 0.5%. Therefore, the results here provide a strong indication that a greater fuel savings, from an absolute sense (litres/km), will be experienced by platoons outfitted with aerodynamic trailers.
At the shortest separation distance examined (17.4 m), the standard-trailer configuration ex-periences a 7.4% and 11.0% fuel savings for the middle and trailing vehicles, respectively,
whereas the aerodynamic-trailer configuration experiences 9.4% and 12.3% fuel savings, re-spectively. At the longest separation distance of 43.6 m, the middle and trailing vehicles for the standard trailers experience 6.2% and 9.5%, with the aerodynamic-trailer configurations experiencing 6.7% and 10.4% fuel savings. The results of Figure 3.1 also show nearly-constant fuel savings for separation gaps beyond 22 m for the standard-trailer configuration. These results provide an indication that fuel savings are achieved for vehicles in moderately-close proximity, and do not necessarily require small separation distances to achieve measurable fuel savings. These results do not provide an indication of the distance at which the effect of vehicle platooning no longer yields a beneficial influence. Smith et al. (2014) discuss the scenario whereby vehicles are likely already experiencing a fuel savings when travelling in moderate to heavy traffic conditions. It is, therefore, important to understand the true poten-tial of vehicle platooning on fuel savings compared to what is already being experienced in general traffic conditions on the road.
The results of Figure 3.1 show that each vehicle in the platoon experiences a different level of fuel savings. The change in fuel savings with separation distance of the full platoon, assuming it behaves as a system, are presented in Figure 3.2. These values could also represent an aver-age fuel savings per vehicle, if the vehicles changed positions sufficiently often to achieve the same savings for each vehicle. The results show that a fuel-savings of at least 5% for the full platoon is achievable for the range of separation distances examined, with up to 7.6% fuel sav-ings at 17.4 m for the aerodynamic-trailer platoon. Both the standard-trailer and aerodynamic
vehicle separation distance [m] time gapt [s] fuel s av ings , F[ % ] 0 10 20 30 40 50 60 70 0 0.5 1 1.5 2 -5 0 5 10 15 20 Standard Trailer Aerodynamic Trailer (r ef . to in d iv idual v e hi cl e o f s ame c on fi g. )
Figure 3.2:Variation in fuel-savings measurements with separation distance for the complete
platoon, vehicle speed of 105 km/hr, vehicle mass of 29,400 kg (measurements ref-erenced to respective vehicle configurations in non-platooned arrangement).