HIGH RESOLUTION THERMAL AND
MULTISPECTRAL UAV IMAGERY FOR PRECISION
ASSESSMENT OF APPLE TREE RESPONSE TO
WATER STRESS
David Gómez-Candón1, Sylvain Labbé2, Nicolas Virlet1, Audrey Jolivot3, Jean-Luc Regnard1
1
Montpellier SupAgro UMR AGAP 1334, CIRAD, TA-A -108/03, Avenue Agropolis, Montpellier Cedex 5, F-34398 France
2
IRSTEA UMR TETIS, Maison de la Télédétection, 500 rue Jean-François Breton, 34093 Montpellier, France
3
CIRAD UMR TETIS, Maison de la Télédétection, 500 rue Jean-François Breton, 34093 Montpellier, France
Abstract. This manuscript presents a comprehensive methodology to obtain Thermal,
Visible and Near Infrared ortho-mosaics, as a previous step for the further image-based assessment of response to water stress of an experimental apple tree orchard. Using this methodology, multi-temporal ortho-mosaics of the field plot were created and accuracy of ortho-rectification and geo-location computed. Unmanned aerial vehicle (UAV) flights were performed on an irrigated apple tree orchard located in Southern France. The 6400 m² plot was composed of 520 apple trees which were disposed in 10 rows. In this field set-up, five well irrigated rows alternated with five rows submitted to progressive summer water constraints. For remote image acquisition, on 4th July, 19th July, 1st August and 6th September UAV flights with three cameras onboard (thermal, visible and near infrared) were performed at solar noon. On 1st August, five successive UAV flights were carried out at 8, 10, 12, 14 and 16 h (solar time). By using self-developed software, frames were automatically extracted from the recorded thermal video and turned in the right image format. The temperature of four different targets (hot, cold, wet and dry bare soil) was continuously measured by the IR120 thermo-radiometers during each flight, for radiometric calibration purpose. Based each on thirty images, all ortho-mosaics were successfully obtained. As high spatial resolution imagery requires high precision geo-location, and the root mean squared error (RMSE) of each ortho-mosaic positioning was calculated in order to assess its spatial accuracy. RMSE values were less than twice the pixel size in every case, which allowed a precise overlapping of the mosaics created. Canopy temperature data extracted from thermal images for showed significantly higher temperatures in water stressed trees compared to well irrigated, difference being related to severity of water stress. Thanks to the ultra-high resolution of remote images obtained (<0.1m spatial resolution for thermal infrared images), and beyond its capacity to delineate efficiently each individual tree, the methodology presented here will also make it possible the analysis of intra-canopy variations and the accurate calculation of vegetation and water stress indices.
Keywords: Unmanned aerial vehicle, Thermal infrared, Drought, Phenotyping,
Georeferencing, Ortho-mosaics, geometric correction
Communication avec actes dans un congrès international (ACTI) à comité de lecture.
Congrès RHEA* – May 21-23, 2014, Madrid 2014 (Espagne). P. Gonzalez-de-Santos & A. Ribeiro (eds), PGM publisher (Madrid), pp. 279-288.
*RHEA: 2nd International Conference on Robotics and associated High-technologies and Equipment for Agriculture and Forestry
1
Introduction
In the context of climate change, statistical trend toward a general temperature increase, and more frequent and intense extreme weather events are expected (IPCC, 2007). Longer periods of drought are susceptible to occur in the future during spring and summer periods, notably in the Mediterranean region (Giorgi and Lionello, 2008), and this will likely threaten the temperate fruit production, in particular where irrigation is limited by water resources. Adapting fruit trees to abiotic stresses such as water stress is thus a new challenging issue for fruit crops, whose water use needs to be deeply re-considered.
Precision agriculture methods can contribute to drought assessment and irrigation scheduling. For the estimation of crop water status at tree scale, Unmanned Aerial Vehicle (UAV) imagery offers both global vision of the whole crop and the needed high spatial resolution. Furthermore, the UAV potential for assessing drought stress or estimating the latent heat flux (evapotranspiration flux density) of agricultural fields has already been shown in numerous studies (e.g. Sullivan et al., 2007; Berni et al., 2009a,b; González-Dugo et al., 2012; Zarco-Tejada et al., 2012). Technical progress in thermal imagery made it possible to widen its possibilities of application in plant sciences, with affordable devices that are suitable for airborne high resolution image acquisition. Monitoring stomatal conductance on the base of thermal imagery can be a better indicator of plant response to drying soil than monitoring the leaf water potential, because stomatal closure can occur even before any change in plant water status (Jones 2004). Stoll and Jones (2007) explored the possibility of using thermal imaging as a tool for monitoring plant stress, showing that the canopy temperature difference between plants submitted to different water regimes can be very helpful to detect water stress. Sela et al. (2007) combined thermal and visible images to estimate leaf water potential status of cotton crops. Galleguillos et al. (2011) compared various temperature differencing methods to estimate daily grapevine evapotranspiration by using ASTER satellite data. More recently, Cohen et al. (2012) developed a methodology based on aerial thermal imagery and watershed image segmentation analysis, to estimate water status of palm trees from aerial thermal images.
Thermal imagery is particularly suitable for monitoring areas of small to medium size (up to some hundreds of hectares). In this context, using UAVs provides the possibility of frequent flights, allowing water stress assessment and irrigation scheduling among other applications. This kind of imagery has been successfully employed in multi-temporal studies over fruit tree orchards (González-Dugo et al., 2013). In low-altitude remote sensing, a large number of images, taken within a short time span, must be mosaicked. Software is available that creates a mosaicked and geo-referenced image relatively automatically, often using the GPS location of the UAV or airplane (e.g. Berni et al., 2009b). Some studies have been focused on the georeferencing improvement of mosaics from UAV-sensed images by determining the optimum number of Ground Control Points (GCPs) and the flying altitude (Gómez-Candón et al., 2011; Gómez-(Gómez-Candón et al., 2014). Wang et al. (2008) developed a practical method for mosaicking video frames from thermal infrared cameras based on Scale Invariant Feature Transform algorithm. In spite of this, thermal image processing still remains a time-consuming step that requires expert knowledge in both software and thermography. This must be largely automated before infrared
thermography can be applied as a common tool in agricultural practice (Maes & Steppe, 2012).
Stress indices are a powerful tool for assessing the effects of drought on crop plants. One of the most commonly used is the Crop Water Stress Index (CWSI) developed by Idso et al. (1981). One extension of the CWSI is the Water Deficit Index (WDI), which has been proposed by Moran et al. (1994) for non-fully covering crops. This index, based on a combination of thermal imagery with other vegetation indices, enables the interpretation of canopy surface temperature. It beforehand determines, by inverting surface energy balance, the evaporative extremes that are used for the temperature differencing, which involves ancillary information about aerodynamic and micrometeorological conditions. Virlet et al. (2014) computed WDI through plotting the vegetation index value (using Normalized Difference Vegetation Index, NDVI) versus the difference between vegetation surface (Ts) and air (Ta) temperatures and demonstrated relevancy of WDI for assessing the variability of tree evapotranspiration in response to soil drought in a field phenotyping trial.
As part of a long term research to investigate the possibilities and limitations of UAV imagery in accurately mapping water stress in field crops, it is crucial to explore the potential of generating accurate ortho-mosaicked imagery from multiple overlapped frames for proper discrimination of illuminated leaves from shaded leaves and soil. This is particularly important when heterogeneous plant cover, like orchards or vineyards are considered. Such an approach should demonstrate the accuracy of the ortho-images obtained and the further possibility of generating accurate water stress indices. This can be helpful to assess the variability of raw temperatures and stress indices within individual tree canopies, as shown by González-Dugo et al. (2012). In this paper we report a study of the geometric accuracy of the ortho-imagery obtained from multiple overlapped images taken in apple tree orchards using UAV-sensed imagery. The aim of this research is to present a comprehensive methodology to obtain thermal and multispectral ortho-mosaics over an apple tree field experiment. As the assessment of crop water status and its temporal development is focused, multi-temporal ortho-mosaics were created and their ortho-rectification accuracy compared. Furthermore, canopy temperature data were retrieved for well irrigated and water stressed trees in order to assess thermal difference between both treatments.
2
Material and methods
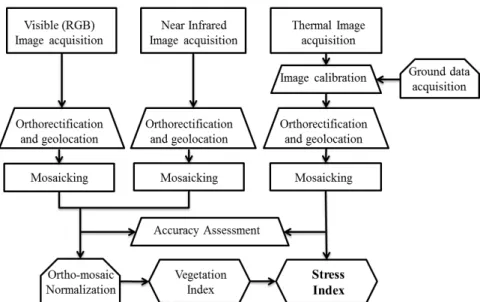
The proposed method is applicable for computation of water stress indices. It comprises the following main steps (Figure 1): image acquisition; image calibration; ortho-rectification and georeferencing; mosaicking; and image band combination to compute the final values of the stress index. UAV remotely-sensed thermal video files have to be pre-processed as following: first, image extraction from thermal video files; second, correction in geometry and radiometry; and third, ortho-mosaicking. This process requires the use of specific software and a system for concomitant ground temperature acquisition. UAV imagery and measurements in planta have been both developed during this research.
Fig. 1. Flowchart for Water Deficit Index (WDI) calculation.
2.1 Locations and data acquisition
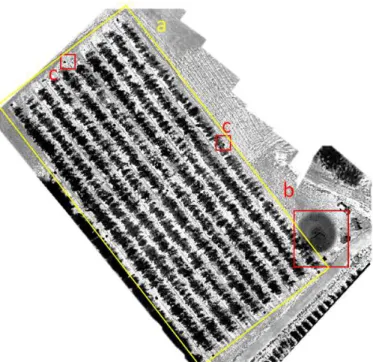
Studies were conducted in an apple tree orchard located at INRA Melgueil station (Diaphen experimental platform), near Montpellier, France (N43º36, E03º58, Figure 2). 520 adult apple trees, planted at 5m * 2m distance, were disposed into ten rows. In one row out of two, irrigation was restricted two weeks before the first flight, in order to induce progressive water deficit. Combination of a large genetic panel and contrasting water regimes was settled for spatial and temporal comparison purposes. Ortho-images were taken during summer 2013 by using a MikroKopter UAV (Figure 3a) equipped with a low weight Thermoteknix Miricle 307K thermal camera (640x480 detector resolution) and two Sigma DP1x digital cameras (2640 x 1760 pixels; Figure 3b), one of them being modified according to Lebourgeois et al. (2008) to acquire near infrared images. UAV flights and image acquisition were carried out under fully sun conditions, on 4th July, 19th July, 1st August and 6th September, and performed at solar noon. On 1st August, five UAV flights also took place at 8, 10, 12, 14 and 16 h (solar time) in order to yield intra-day dynamics of plant temperature. UAV images were acquired at 40m altitude and flight length was 4-6 minutes approximately, depending on wind conditions. The image along-track overlap was 80% and cross-track overlap was 60%. A series of 30 UAV navigation waypoints were fixed within each flight, to ensure stable conditions each 9 meters and prevent blurred RGB and NIR images. A total of 30 images per flight were needed to cover the whole field (one image each 8 seconds approximately). Over the plot, a total of 15 GCPs were placed and geo-referenced using a Leica RTK GPS (Leica Geosystems®) with an accuracy of 1cm. For radiometric correction purposes, IR120 thermo-radiometers (Campbell® Scientific Inc.) were installed to continuously measure the brightness temperature of four contrasted targets: cold (white polystyrene), hot (black-painted), and also dry and wet bare soil.
Fig. 2. Thermal ortho-mosaic of the study plot (August, 8th). (a) Apple tree orchard. (b) Hot and cold ground targets. (c) Georeferencing ground control points.
2.2 Thermal imagery pre-processing
Data were pre-processed in two main steps: image extraction from video files and geometric and radiometric calibration. Self-developed specific software was developed for automatically performing the process. The software is based on Python programming language (Python Software Foundation, 9450 SW Gemini Dr., ECM# 90772, Beaverton, OR 97008, USA) and the avconv command line program for transcoding multimedia files (Libav Open source audio and video processing tools, www.libav.org).
Fig. 3. a. Mikrokopter UAV. b. Detail of the camera mount with the thermal and the DP1
camera installed. The pico-computer controlling the thermal camera is also shown.
Video frames extraction and image format transformation
To avoid data errors due to overheating, the uncooled thermal camera itself had a system for continuous self-calibration, which was set to occur every 4 seconds. To
minimize acquisition errors, only the first frame after every self-calibration was extracted. After extraction, each raw frame was automatically transformed into the desired image format.
Geometric correction and ground data-based radiometric calibration
Resulting thermal images had some errors due to some lens distortion effects. Geometric correction was based on lens geometric coefficients, which were provided by camera manufacturer.
Each flight was divided into two tracks, flying over the ground targets at the beginning and the end of each track. Radiometric calibration coefficients were calculated by linear interpolation, using the ground temperature data (from hot, cold, and soil targets). Afterwards, coefficients were applied to TIR images for radiometric calibration.
2.3 Ortho-mosaicking process
The exterior position and orientation parameters of the UAV were provided by the UAV inertial system. These parameters and GCPs coordinates were used as input data for the Leica Photogrammetric Suite 2010 (LPS, Leica Geosystems®, 2006) software, for ortho-rectification by aero-triangulation and mosaicking. For the near infrared and visible images (NIR and RGB), calibration parameters were calculated by comparing overlapping zones of consecutive images during the aero-triangulation process. Radiometric correction for RGB and NIR images was based on invariant field targets in each spectral band, with Date 1 as a reference, so that the acquisitions would be comparable from one date to the others. For the thermal images, calibration was performed as explained in the previous section. Afterwards, the images were combined into a seamless ortho-mosaicked image of the entire field.
2.4 Accuracy assessment
Accuracy assessment consisted of estimating the error associated with ortho-rectification of the UAV imagery. This error is commonly expressed by the root mean squared error (RMSE) of the ortho-mosaicked image. The RMSE is a global indicator of the quality of the mosaic, and is based on the residuals of the image co-ordinates and the ground co-ordinates. The geometric accuracy of the ortho-rectified mosaic was assessed using the co-ordinates of seven out of 15 GCPs collected at ground level using the differential GPS. Then, the RMSEs were calculated as follows: once the mosaic was generated, co-ordinates of the seven GCPs measured in the field were compared to the co-ordinates of these seven GCPs in the mosaicked image using ENVI software (Research System Inc., Boulder, CO, USA). Finally, the differences between DGPS co-ordinates and co-ordinates from the mosaicked image were used for calculating the RMSE. The RMSE for an image with n validation points is assessed as follows (ERDAS, 1999):
(
) (
)
[
]
12 1 2 2 / − + − =∑
= n i r s r s X Y Y n X RMSE (1)where Xs and Ys are the geospatial co-ordinates of the point of the source image, and Xr and Yr are the co-ordinates of the same point DGPS measured at field level.
Table 1. Overall georeferencing errors at INRA Melgueil plot. UAV images were taken at 4
different dates. Images from three different cameras: Visible RGB (Red, Green, Blue), Near Infrared (NIR) and Thermal Infrared (TIR).
Kind of image (spatial resolution)
Date RGB (0.02m) NIR (0.02m) TIR (0.10m)
4th July 2013 RMSE ±s.d. 0.028±0.023 0.025±0.018 0.182±0.095 19th July 2013 RMSE ±s.d. 0.024±0.015 0.026±0.016 0.194±0.100 1st August 2013 RMSE ±s.d. 0.027±0.010 0.025±0.009 0.150±0.070 6th Sept.2013 RMSE ±s.d. 0.026±0.009 0.025±0.007 0.153±0.090 Mean RMSE±s.d. 0.026±0.002 0.026±0.001 0.170±0.021 RMSE (root mean squared error) ± standard deviation of validation points of each image (in meters).
2.5 Measurement of temperature difference
To assess performance of ortho-mosaics obtained, three dates were selected according to the increasing severity of water stress, 4th July (no stress), 1st August (medium stress) and 6th September (high stress). For each date, differences between apple tree canopy temperature (Tc) and air temperature (Ta) were calculated for the well watered (WW) and the water stressed (WS) trees separately. Finally analysis of variance was performed.
3
Results and discussion.
Table 2. Overall georeferencing errors at Melgueil plot. UAV images were taken on 1st August 2013 at 5 different moments of the day. Images from three different cameras: Visible RGB (Red, Green, Blue), Near Infrared (NIR) and Thermal Infrared (TIR).
Kind of image (spatial resolution) Solar time RGB (0.02m) NIR (0.02m) TIR (0.10m)
8:00 RMSE ±s.d. 0.027±0.011 0.026±0.012 0.196±0.094 10:00 RMSE ±s.d. 0.027±0.010 0.025±0.009 0.150±0.070 12:00 RMSE ±s.d. 0.029±0.015 0.027±0.006 0.191±0.086 14:00 RMSE ±s.d. 0.027±0.011 0.029±0.013 0.194±0.105 16:00 RMSE ±s.d. 0.028±0.009 0.026±0.011 0.192±0.060 Mean RMSE±s.d. 0.028±0.001 0.026±0.001 0.185±0.019 RMSE (root mean squared error)±standard deviation of validation points of each image (m). For both situations, inter-day and intra-day flights, the UAV image series were successfully taken and ortho-rectified. Besides, as a result of the development of specific software, the image extraction and calibration was more automatic and faster than using the conventional methods.
Tables 1 and 2 show the measured RMSE of the ortho-mosaics taken at 4 different summer dates, along with the drought progression in field trial, and on 1st August for
five different moments of the day. The ortho-mosaics generated had a spatial resolution of 0.02m for near infrared (NIR) and visible (RGB) bands and 0.10m in thermal infrared (TIR). Those spatial resolutions are appropriate for the water stress assessment at individual tree level, since canopies diameter were 1 to 3m.
The overall RMSEs were very similar between ortho-mosaics regardless of the moment of the flight or the kind of image acquired (TIR, NIR or RGB). Thus, the results did not show large differences in accuracy between ortho-mosaics which were similar whatever the date. One of the relevant results of the study is that the moment of acquisition did not affect the georeferencing accuracy of the mosaicked image. Furthermore, the final RMSE value was less than twice the image pixel size, which is accurate enough according to Laliberte et al (2010). Furthermore, ortho-mosaics were accurate enough to be applied on multi-temporal studies, according to the methodology proposed by Virlet et al. (2014), since they were radiometrically corrected too. The low RMSEs for RGB and NIR (about 1 pixel) permit the precise computation of vegetation indices. The fairly low RMSE for TIR image georeferencing (lower than 0.20m) will allow a satisfactory extraction of thermal data within the tree canopies, upon consideration of a representative central zone. On the basis of the image series obtained, analysis of intra-crown variations will also be possible. However, other factors must be taken into account while acquiring this kind of high resolution imagery at low flying height, like directional effects (Hakala et al., 2013).
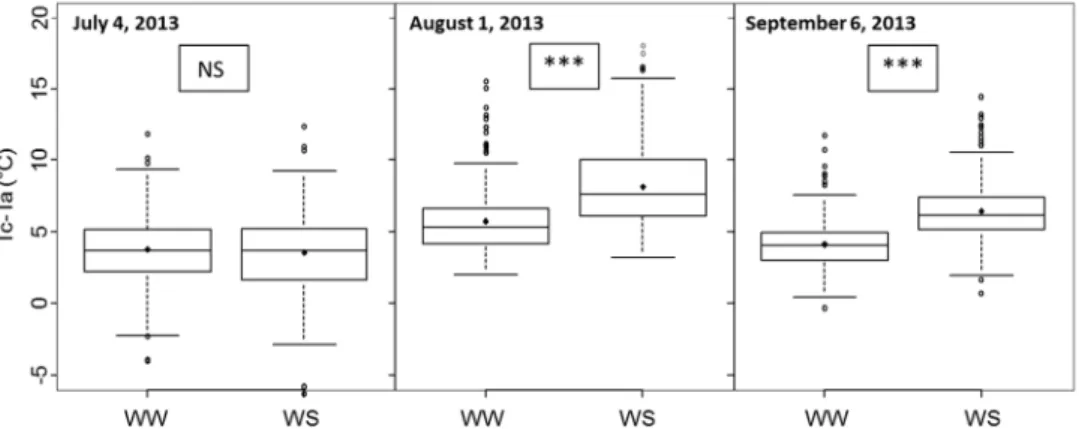
Fig. 4. Distribution of differences between canopy temperature and air temperature (Tc-Ta) for
the well watered (WW) and the water stressed (WS) trees (122 genotypes). Three dates: 4th July (no stress), 1st August (medium stress) and 6th September (high stress). Each box plot shows the median value, the 1st and 3rd quartiles, and the 1st and 9th deciles. Significant p-values are represented as follows: *** for p≤ 0.001; NS: not significant.
Comparison between canopy temperature in WW and WS trees (all genotypes confounded) is represented in figure 4, while the environmental data during image acquisition are shown in table 3. There was no statistical difference in Tc-Ta before water stress establishment (July 4th). In contrast, highly significant differences were found on the second and third dates. This result was consistent with the stem water potential data acquired (table 3). Nevertheless, thermal data yielded in WW and WS trees at 3rd date showed lower Tc-Ta differences, due to lower irradiance conditions compared to 2nd date.
4
Conclusions
The proposed methodology is suitable for obtaining thermal and multispectral ortho-mosaics, reducing the pre-processing time needed for image extraction and calibration. Due to the automation of the process, its cost efficiency is increased. This kind of remotely-sensed imagery is presently contributing to a tree phenotyping program at field, whose aim is to analyze the genotypic variability of apple tree response to increasing water constraints. The spatial resolution obtained allows carrying out the water stress assessment at individual tree level. As UAV-borne image series can be acquired with short revisit time, temporal series can be developed at seasonal and daily scales. The accuracy obtained is enough to perform comparisons in these temporal series.
Acknowledgments
Thanks to Cyril Portal and Sébastien Martinez for helping in field imaging. This research was partly funded by Hiri-FAP Project (Open Science Nr 1202-070, Agropolis Fondation).
References
Berni, J.A.J., Zarco-Tejada, P.J., Sepulcre-Canto, G., Fereres, E., Villalobos, F. Mapping canopy conductance and CWSI in olive orchards using high resolution thermal remote sensing imagery. In: Remote Sensing of Environment 113, 2380–2388. (2009a). Berni, J.A.J., Zarco-Tejada, PJ., Suarez, L., Fereres, E. Thermal and narrowband
multispectral remote sensing for vegetation monitoring from an unmanned aerial vehicle. In: IEEE Transactions on Geoscience and Remote Sensing 47, 722–738. (2009b). Cohen, Y., Alchanatis, V., Prigojin, A., Levi, A., Soroker, V. Use of aerial thermal imaging
to estimate water status of palm trees. In: Precision Agriculture 13, 123-140. (2012). ERDAS Inc. RMS error. ERDAS field guide (5th edn, 672 pp.). Atlanta, GA: ERDAS Inc.
pp. 362–365. (1999).
Galleguillos, M., Jacob, F., Prévot, L., French, A., Lagacherie, P. Comparison of two temperature differencing methods to estimate daily evapotranspiration over a Mediterranean vineyard watershed from ASTER data. In: Remote Sensing of Environment 115, 1326–1340. (2011).
Giorgi, F., Lionello, P. Climate change projections for the Mediterranean region. In: Global and Planetary Change 63, 90-104. (2008).
Gómez-Candón, D., López-Granados, F., Caballero-Novella, J.J., Gómez-Casero, M.T., Jurado-Expósito, M., García-Torres, L. Geo-referencing remote images for precision agriculture using artificial terrestrial targets. In: Precision Agriculture, 12, 876–891 (2011).
Gómez-Candón, D., De Castro, A.I., López-Granados, F. Assessing the accuracy of mosaics from unmanned aerial vehicle (UAV) imagery for precision agriculture purposes in wheat. In: Precision Agriculture, 15, 44-56. (2014).
González-Dugo, V., Zarco-Tejada, P., Berni, J.A.J., Suárez, L., Goldhamer, D. Fereres, E. Almond tree canopy temperature reveals intra-crown variability that is water stress-dependent. In: Agricultural and Forest Meteorology 154–155, 156–165. (2012).
González-Dugo, V., Zarco-Tejada, P., Nicolás, E., Nortes, P.A., Alarcón J.J., Intrigliolo, D.S., Fereres, E. Using high resolution UAV thermal imagery to assess the variability in
the water status of five fruit tree species within a commercial orchard. In: Precision Agriculture 14, 660-678. (2013).
Hakala, T., Honkavaara, E., Saari, H., Mäkynen, J., Kaivosoja, J., Pesonen, L., Pölönen, I. Spectral imaging from UAVs under varying illumination conditions. International Archives of the Photogrammetry, Remote Sensing and Spatial Information Sciences (XL-1/W2), 189–194. (2013).
IPCC (Intergovernmental Panel on Climate Change). Climate Change 2007: The Physical Science Basis. Cambridge, UK: Cambridge University Press, 2007.
Idso, S.B., Jackson, R.D., Pinter, P.J., Reginato, R.J., Hatfield, J.L. Normalizing the stress-degree-day parameter for environmental variability. Agricultural and Forest Meteorology 24, 45–55. (1981).
Jones, H.G. Irrigation scheduling: Advantages and pitfalls of plant-based methods. In: Journal of Experimental Botany 55, 2427–2436. (2004).
Laliberte, A.S., Herrick, J.E., Rango, A., Winters, C. Acquisition, orthorectification, and object based classification of unmanned aerial vehicle (UAV) imagery for rangeland monitoring. Photogrammetric Engineering and Remote Sensing, 76, 661–672. (2010). Lebourgeois V, Bégué A, Labbé S, Mallavan B, Prévot L, Roux B. 2008. Can commercial
digital cameras be used as multispectral sensors? A crop monitoring test. Sensors 8, 7300-7322. (2008).
Leica Geosystems. Leica Photogrammetry Suite Project Manager. Leica Geosystems Geospatial Imaging, LLC, Norcross, GA, (434 pp.) Retrieved July 25, 2013, from: http://pdf.ebooks6.com/Leica-Photogrammetry-Suite-pdf.pdf (2006).
Maes, W.H. Steppe, K. Estimating evapotranspiration and drought stress with ground-based thermal remote sensing in agriculture: a review. In: Journal of Experimental Botany 63, 4671–4712. (2012).
Moran, M., Clarke, T., Inoue, Y., Vidal, A. Estimating crop water deficit using the relation between surface–air temperature and spectral vegetation index. In: Remote Sensing of Environment 49, 246−263. (1994).
Sela, E., Cohen, Y., Alchanatis, V., Saranga, Y., Cohen, S., Möller, M. Thermal imaging for estimating and mapping crop water stress in cotton. In: J. V. Stafford (Ed.), European conference in precision agriculture. Wageningen: Acad. Publications. 365-371 (2007). Stoll, M., Jones, H.G. Thermal imaging as a viable tool for monitoring plant stress. In:
International Journal of Vine and Wine Sciences. 41, 77–84. (2007).
Sullivan, D.G., Fulton, J.P., Shaw, J.N., Bland, G. Evaluating the sensitivity of an unmanned thermal infrared aerial system to detect water stress in a cotton canopy. In: Transactions of the ASABE 50, 1955–1962. (2007).
Virlet, N., Lebourgeois, V., Martinez, S., Costes, E., Labbé, S., Regnard, J.L. Stress indicators based on airborne thermal imagery for field phenotyping a heterogeneous tree population for response to water constraints. In: Journal of Experimental Botany. 65 (18): 5429-5442. (2014).
Wang, Y., Camargo, A., Fevig, R., Martel, F., Schultz, R.R. Image mosaicking from uncooled thermal IR video captured by a small UAV. In: IEEE Southwest Symposium on Image Analysis and Interpretation, 2008. 161-164. (2008).
Zarco-Tejada, P.J., González-Dugo, V., Berni, J.A.J. Fluorescence, temperature and narrow-band indices acquired from a UAV platform for water stress detection using a micro-hyperspectral imager and a thermal camera. In: Remote Sensing of Environment 117, 322–337. (2012).