HAL Id: hal-01547785
https://hal.sorbonne-universite.fr/hal-01547785
Submitted on 27 Jun 2017
HAL is a multi-disciplinary open access
archive for the deposit and dissemination of
sci-entific research documents, whether they are
pub-lished or not. The documents may come from
teaching and research institutions in France or
abroad, or from public or private research centers.
L’archive ouverte pluridisciplinaire HAL, est
destinée au dépôt et à la diffusion de documents
scientifiques de niveau recherche, publiés ou non,
émanant des établissements d’enseignement et de
recherche français ou étrangers, des laboratoires
publics ou privés.
Distributed under a Creative Commons Attribution| 4.0 International License
of myocardial infarction
Wahida Kihal-Talantikite, Christiane Weber, Gaëlle Pedrono, Claire Segala,
Dominique Arveiler, Clive E. Sabel, Séverine Deguen, Denis Bard
To cite this version:
Wahida Kihal-Talantikite, Christiane Weber, Gaëlle Pedrono, Claire Segala, Dominique Arveiler, et
al.. Developing a data-driven spatial approach to assessment of neighbourhood influences on the
spatial distribution of myocardial infarction. International Journal of Health Geographics, BioMed
Central, 2017, 16, pp.22. �10.1186/s12942-017-0094-8�. �hal-01547785�
RESEARCH
Developing a data‑driven spatial
approach to assessment of neighbourhood
influences on the spatial distribution
of myocardial infarction
Wahida Kihal‑Talantikite
1*, Christiane Weber
2, Gaelle Pedrono
3, Claire Segala
4, Dominique Arveiler
5,
Clive E. Sabel
6, Séverine Deguen
7,8and Denis Bard
9Abstract
Background: There is a growing understanding of the role played by ‘neighbourhood’ in influencing health status. Various neighbourhood characteristics—such as socioeconomic environment, availability of amenities, and social cohesion, may be combined—and this could contribute to rising health inequalities. This study aims to combine a data‑driven approach with clustering analysis techniques, to investigate neighbourhood characteristics that may explain the geographical distribution of the onset of myocardial infarction (MI) risk.
Methods: All MI events in patients aged 35–74 years occurring in the Strasbourg metropolitan area (SMA), from January 1, 2000 to December 31, 2007 were obtained from the Bas‑Rhin coronary heart disease register. All cases were geocoded to the census block for the residential address. Each areal unit, characterized by contextual neighbourhood profile, included socioeconomic environment, availability of amenities (including leisure centres, libraries and parks, and transport) and psychosocial environment as well as specific annual rates standardized (per 100,000 inhabitants). A spatial scan statistic implemented in SaTScan was then used to identify statistically significant spatial clusters of high and low risk of MI.
Result: MI incidence was non‑randomly spatially distributed, with a cluster of high risk of MI in the northern part of the SMA [relative risk (RR) = 1.70, p = 0.001] and a cluster of low risk of MI located in the first and second periphery of SMA (RR 0.04, p value = 0.001). Our findings suggest that the location of low MI risk is characterized by a high socioeconomic level and a low level of access to various amenities; conversely, the location of high MI risk is charac‑ terized by a high level of socioeconomic deprivation—despite the fact that inhabitants have good access to the local recreational and leisure infrastructure.
Conclusion: Our data‑driven approach highlights how the different contextual dimensions were inter‑combined in the SMA. Our spatial approach allowed us to identify the neighbourhood characteristics of inhabitants living within a cluster of high versus low MI risk. Therefore, spatial data‑driven analyses of routinely‑collected data georeferenced by various sources may serve to guide policymakers in defining and promoting targeted actions at fine spatial level. Keywords: Data‑driven, Multidimensional, Spatial approach, Neighbourhood influences, Social health inequalities, Myocardial infarction
© The Author(s) 2017. This article is distributed under the terms of the Creative Commons Attribution 4.0 International License
(http://creativecommons.org/licenses/by/4.0/), which permits unrestricted use, distribution, and reproduction in any medium,
provided you give appropriate credit to the original author(s) and the source, provide a link to the Creative Commons license, and indicate if changes were made. The Creative Commons Public Domain Dedication waiver (http://creativecommons.org/
publicdomain/zero/1.0/) applies to the data made available in this article, unless otherwise stated.
Open Access
*Correspondence: wahida.kihal@live‑cnrs.unistra.fr
1 LIVE UMR 7362 CNRS (Laboratoire Image Ville Environnement),
University of Strasbourg, Strasbourg 6700, Strasbourg, France Full list of author information is available at the end of the article
Background
Despite a succession of high-profile reports based on scientific studies demonstrating the links between social determinants and several health outcomes, health ine-qualities persist and still constitute a major public health
issue [1–3]. Since the early 2000s, there has been a
grow-ing number of studies demonstratgrow-ing the role played by ‘place’ where people live (also referred to as ‘context’)
in influencing health status [4–7]. More precisely, the
underlying idea is that the health effect of the environ-ment exposure is complex, including both direct effect of specific environmental exposure (e.g. air pollution) and indirect consequences commonly addressed as the
concept of “neighbourhood” [4, 6–8]. Many literature
reviews support the significant effect of neighbourhood
on a set of outcomes [9] such as mental health, birth [10],
early childhood health [11], and obesity [12].
In order to explain the pathway via which neighbour-hood may affect health, several papers have proposed conceptual models related to neighbourhood and to
individuals’ behaviours—such as physical activities [13],
walkability [13], diet [14] and such bio-physiological
events as stress [15]. For instance, the causal framework
proposed by Pearce et al. [16] uses three distinct domains
to describe the various components of neighbourhood: physical characteristics (quality of outdoor environment and housing, traffic and physical disorder, etc.), (2) social characteristics (social network, social cohesion, etc.), and (3) community resources access (leisure facilities,
healthcare, etc.). More recently, Komeily et al. [17] have
defined neighbourhood as a function of several variables selected from physical (street design, connectivity, build-ing type and use, etc.), operational (transit stops, routes, etc.), socioeconomic (demographics, land use and den-sity, etc.) environmental (climate, topography, etc.) and institutional points of view (policy, etc.). In the majority of studies, however, neighbourhood was characterized by
a single variable such as, for instance, noise [18–20] or
the presence of graffiti, [21] defining the physical domain
in epidemiological studies investigating respiratory [18]
or cardiovascular disease [18–20]. Characterization of
neighbourhood in the domain of community resources
access, food store accessibility [22], primary healthcare
services, recreational facilities, and public open [23, 24]
and green spaces [25, 26] has been investigated in the
literature. The role of the social domain has so far been
explored mainly through data on local violence [27, 28]
and social cohesion (or social capital) [29].
Each of these domains has been recognized as being associated with health status beyond socioeconomic status. For instance, the association between a low social standing measurement for residential neighbour-hood and blood pressure was found after adjusting for
individual/neighbourhood socioeconomic status and
individual risk factors for hypertension [30]. A recent
systematic review revealed that the majority of studies show a reduced risk of cardiovascular disease mortality
in areas having higher residential greenness [31]; a
find-ing confirmed by another study investigatfind-ing respiratory disease, which showed that children living in areas with
more street trees have lower prevalence of asthma [32].
In addition, certain neighbourhood characteristics–such as proximity and/or access to green space or healthcare– are often not equitably distributed with regard to
socio-economic status [33]—and this could exacerbate health
inequalities.
Fine neighbourhood characterization for the study of health effects now has major policy implications for the public health community, to promote development and application of policies and social action aimed at
reduc-ing health inequalities [34–36]. Moreover, the spatial
identification of small geographical areas carrying a high health risk, and their contextual characteristics, could allow for action more closely targeted at those most at
risk [37, 38].
In this context, the issue is the definition of relevant, evidence-based public health interventions, armed with precise knowledge of what truly influences health ine-qualities in a given setting and among specific, vulner-able population groups. It should be stressed that such knowledge may inform the “Health in all Policies”
strat-egy advocated by WHO and the European Union [39,
40], through actions on urban planning, transport,
edu-cational services, social work, and amenities (including leisure centres, libraries and parks).
In this work, we sought to combine a data-driven approach with clustering analysis techniques, to investi-gate neighbourhood characteristics (including socioeco-nomic and public resources as well as the psychosocial dimension) that may explain the geographical distribu-tion of onset of MI risk. This work is not intended to reveal any relationship or causal pathway between neigh-bourhood characteristics and MI risk; other, more
appro-priate studies were designed to answer this question [9].
Methods
Study setting
Our study setting was the Strasbourg metropolitan area
(SMA), an urban area of 316 km2, located in the Bas-Rhin
district of the Great-East region of north-eastern France, and having a population of 500,000. This area comprises 33 municipalities subdivided into 190 French census blocks named IRIS (Ilots Regroupés pour l’Information Statistique), each having an average of 2000 inhabitants.
This French census block/IRIS (a sub-municipal French census block) is defined by the National Institute of
Statistics and Economic Studies (INSEE). This is the smallest administrative unit in which socioeconomic and demographic data are available in France. In terms of population size, French census block is intermediate between US census tracts (about 4000 inhabitants) and US census block groups (about 1000 inhabitants).
Neighbourhood characteristics
To our knowledge, few groups have attempted to
com-bine all the domains addressed above [41, 42]. For
instance, the UK Department of the Environment,
Trans-portation, and the Regions (DETR) [42] developed an
Index of Multiple Deprivation (IMD) as an official meas-ure of relative deprivation for small areas (or neighbour-hoods) in England—based on a combination of six or seven domains.
As in the British contextual frameworks, we have undertaken a process of characterizing a neighbourhood in the SMA that includes the most common domains capable of supporting health studies of related to: socio-economic, community resources (or public resource), and psychosocial (or social).
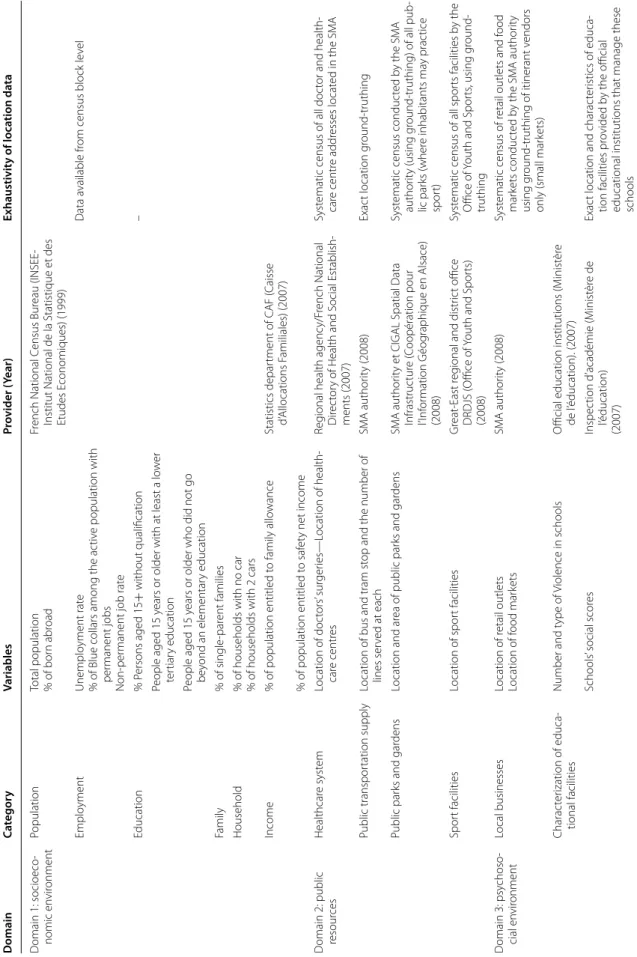
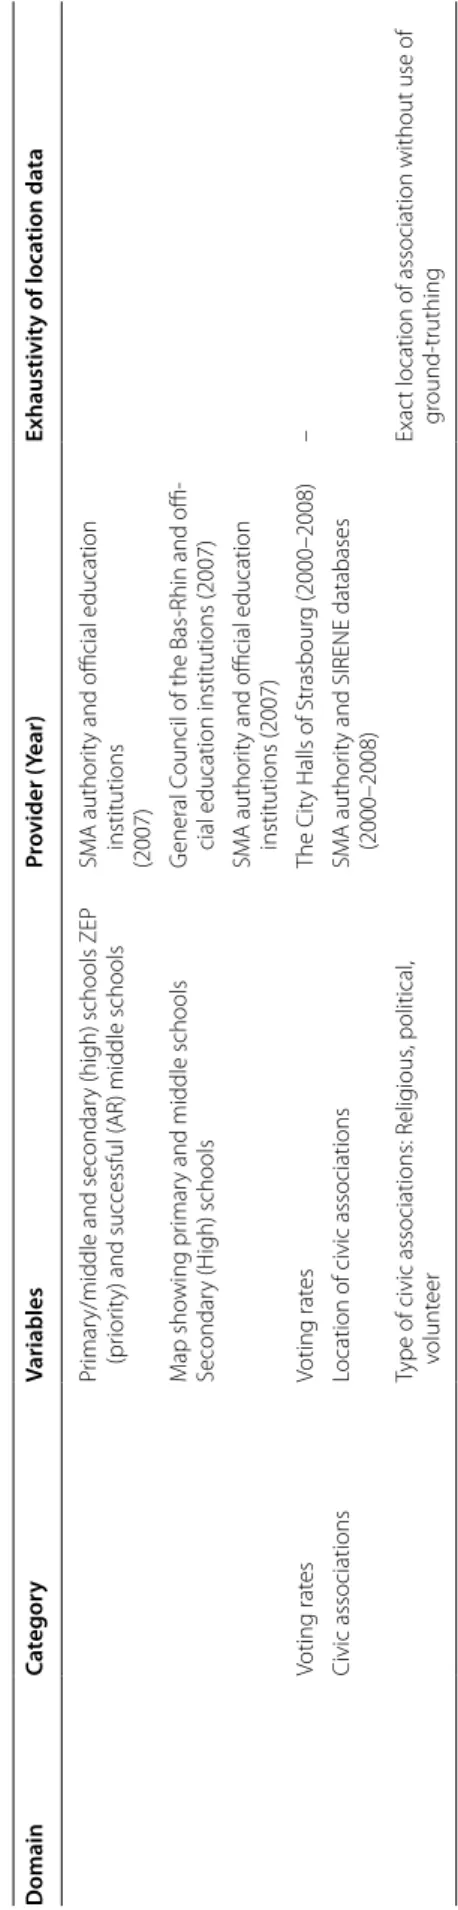
Data sources: Table 1
All socioeconomic data including employment, educa-tional level, income, data about those receiving child ben-efit and also those receiving the French welfare allowance was obtained from the French National Census Bureau (INSEE-Institut National de la Statistique et des Etudes Economiques) and from the statistics department of the CAF (Caisse d’Allocations Familiales), family welfare system.
To characterize access to public resources, the regional health agency provided all the FINESS (French National Directory of Health and Social Establishments) files, which describe the healthcare system (physicians and facilities). The SMA made geocoded data available that allowed us to determine (1) transportation elements such as bus and tram stops and the number of lines served, as well as (2) geocoded data on location of public parks and green spaces. Lastly, the Great-East regional and district office DRDJS (Office of Youth and Sports) made available its database of all athletic equipment and facilities. How-ever, no information concerning the usage of amenities was collected in this study.
To characterize the psychosocial environment, includ-ing the civic and community environments, local busi-nesses and retail stores, and educational environment, we used SIRENE databases (INSEE), the educational facilities database available at the SMA authority and official education institutions, as well as data provided by the city’s list of itinerant vendors (small markets). The CIGAL Spatial Data Infrastructure (Cooperation pour
l’Information Géographique en Alsace), provides a data-base describing land use and land cover coverage and
cat-egories (see Table 1).
Geographical information system analysis
Of the databases collected, some datasets were available at administrative spatial base level—such as census block. Such segmentation might, however, not be relevant for spatial analysis of other data produced for different pur-poses, at various scales. Instead of using the available French census block files, we therefore chose to design a specific spatial unit mesh, allowing us to manage the data’s scale heterogeneity (that is, a square grid) for three reasons:
• Stability of the basic geographical unit; one advan-tage of cell-based over administrative borders (likely to change over time) is that it can be fixed: its borders do not change over time unless desired—in response for example to changing underlying population or land-use footprints.
• Administrative spatial units and their borders are not necessarily relevant for subsequent analysis other than that for which they were constructed.
• To homogenize contextual data; contextual data is extremely heterogeneous in terms of spatial scales, collection dates, and exhaustiveness. Use of the grid makes it possible to homogenize data to some extent, ahead of any statistical or spatial analysis.
To determine grid path size, we used the “nearest
neighbour” method [43] to characterize the spatial
dis-tribution of the different patterns of geographical points (retail store, physicians, etc.). The mean distance sepa-rating points has been calculated as 270 m. Cell dimen-sion was thus set at 250 m × 250 m to best approximate underlying data distribution, yielding 5127 cells for the SMA coverage. All contextual variables collected were assigned at this cell level.
Zonal data (such as the socioeconomic data obtained at IRIS scale for the 1999 census) was fitted to the 250 × 250 m grid using a clipping function. The “zone clipping” algorithm is then used to disaggregate the vari-able, according to a geometric overlap principle. The value of the information transferred to the cell is thus a function of the area common to the initial area (for example, the IRIS) and the grid cell.
In this desegregation approach, we assume equal den-sity of the phenomenon across the area. The space con-sidered, however, is not isotropic. This constraint was overcome using available geographic information (topo-graphic database) to improve characterization of the dis-aggregation of the initial area.
Table 1 Da ta sour ce t o char ac teriz e the neighb our ho od c on te xt Domain Ca tegor y Variables Pr ovider ( Year) Exhaustivit y of loca tion da ta D omain 1: socioeco ‑ nomic en vir onment Population
Total population % of bor
n abr oad Fr ench National C ensus Bur eau (INSEE ‑
Institut National de la Statistique et des Etudes E
conomiques) (1999) Emplo yment Unemplo yment rat e
% of Blue collars among the ac
tiv e population with per manent jobs Non ‑per
manent job rat
e Data a vailable fr om census block le vel Education % P ersons aged 15 + without qualification – People aged 15 y
ears or older with at least a lo
w er ter tiar y education People aged 15 y
ears or older who did not go
be yond an elementar y education Family % of single ‑par ent families Household
% of households with no car % of households with 2 cars
Income % of population entitled t o family allo wance Statistics depar tment of CAF ( Caisse d’ Allocations F amiliales) (2007) % of population entitled t o saf et y net income D
omain 2: public resour
ces Healthcar e syst em Location of doc tors ’ sur ger ies—L ocation of health ‑ car e centr es Reg
ional health agenc
y/F rench National Dir ec tor y of Health and S ocial Establish ‑ ments (2007) Syst
ematic census of all doc
tor and health
‑ car e centr e addr esses locat ed in the SM A Public transpor tation supply
Location of bus and tram st
op and the number of
lines ser ved at each SM A author ity (2008) Exac t location g round ‑truthing Public par ks and gar dens Location and ar ea of public par ks and gar dens SM A author
ity et CIGAL Spatial Data
Infrastruc tur e ( Coopération pour l’I nf or mation G éog raphique en Alsace) (2008) Syst
ematic census conduc
ted b y the SM A author ity (using g round
‑truthing) of all pub
‑ lic par ks (wher e inhabitants ma y prac tice spor t) Spor t facilities Location of spor t facilities Gr eat ‑East r eg
ional and distr
ic
t office
DRDJS (
O
ffice of
Youth and Spor
ts)
(2008)
Syst
ematic census of all spor
ts facilities b
y the
O
ffice of
Youth and Spor
ts , using g round ‑ truthing D omain 3: psy choso ‑ cial en vir onment Local businesses Location of r etail outlets Location of f ood mar kets SM A author ity (2008) Syst ematic census of r
etail outlets and f
ood mar kets conduc ted b y the SM A author ity using g round ‑truthing of itinerant v endors
only (small mar
kets) Charac ter ization of educa ‑ tional facilities Number and t ype of Violence in schools O
fficial education institutions (M
inist èr e de l ’éducation). (2007) Schools ’ social scor es Inspec tion d ’académie (M inist èr e de l’éducation) (2007) Exac
t location and charac
ter istics of educa ‑ tion facilities pr ovided b y the official
SMA S tr asbour g metr opolitan ar ea Table 1 c on tinued Domain Ca tegor y Variables Pr ovider ( Year) Exhaustivit y of loca tion da ta Pr imar
y/middle and secondar
y (high) schools ZEP
(pr
ior
ity) and successful (
AR) middle schools
SM
A author
ity and official education
institutions (2007) M ap sho wing pr imar
y and middle schools
Secondar
y (H
igh) schools
G
eneral C
ouncil of the Bas
‑R
hin and offi
‑
cial education institutions (2007)
SM
A author
ity and official education
institutions (2007) Voting rat es Voting rat es The Cit y Halls of Strasbour g (2000–2008) – Civic associations
Location of civic associations
SM
A author
ity and SIRENE databases
(2000–2008)
Type of civic associations: R
elig ious , political , volunt eer Exac
t location of association without use of
gr
ound
In our study, we postulate that the equidistribution of data was a function of the buildings’ volume: in this case, we estimated the population of the cells proportionally to the habitable area of the buildings included in the cells, according to the following formula:
where Area of housing = Building footprint area of hous-ing × Number of habitable floors. Number of habitable floors = housing height/3.
Once all socioeconomic variables had been deseg-regated at cell level, we calculated the socioeconomic indicator for each cell (e.g. unemployment rate, % of blue-collars among the active population with permanent jobs, non-permanent job rate).
For all spatial analyses described below, each cell was represented by the centroid of the inhabited built area.
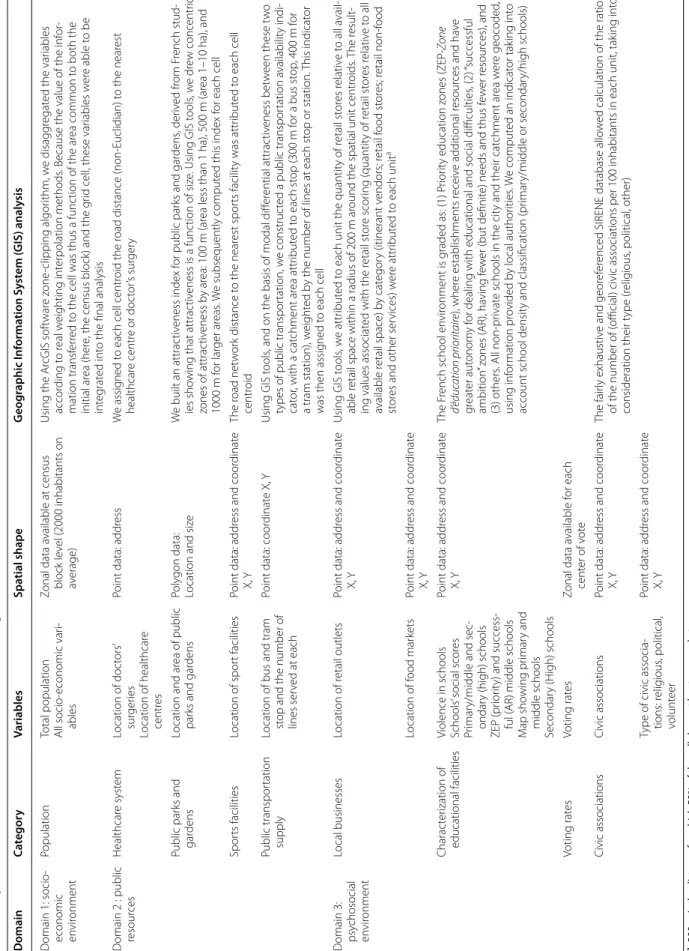
A data‑driven approach to neighbourhood characterization
First, the 25 variables described in Table 1 were
geolo-cated and analysed in line with the approaches proposed
by various studies (Table 2).
Second, we aimed to create a multidimensional profile with which to characterize each neighbourhood based on the underlying data structure using a data-driven approach, and without any a priori models.
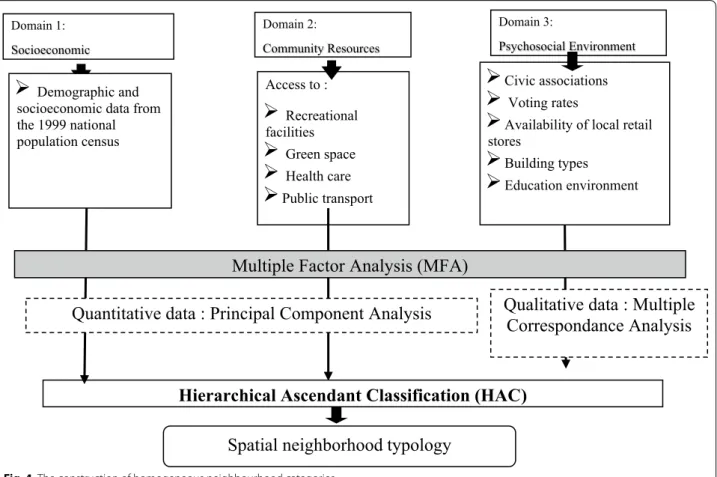
Consider a data set composed of each domain within the same unit as group of variables. As we had several groups of both quantitative and qualitative contextual variables (socioeconomic, public resource, psychosocial) and because we wanted to give each equal weight regard-less of the number of variables in it, we used Multiple
Factor Analysis (MFA) [44]—a technique well-suited to
this situation.
The MFA entailed performing either a Principal Com-ponent Analysis (PCA) for each subset, if the group is composed of quantitative variables (sets of both socio-economic and public resources domain variables), or a Multiple Correspondence Analysis (MCA) if the group is composed of qualitative variables (sets psychosocial domain of variables). This first step allowed us to com-pute distance between units by giving a specific weight to each variable, based on use of the highest eigenvalue of the PCA or the MCA for each group, thus obtaining a particular metric. In the second step of the MFA, we used the previously obtained metric to perform a PCA on the whole data set. This allowed us to compare groups of dif-ferent types of variables.
Following the MFA, we applied Hierarchical Ascendant
Clustering (HAC) [45] to create meaningful contextual
Population = i−1 N PIRISi× i−1 n Area of housingi
Total area of housing in IRSi
profile (cf. Appendix for Fig. 4). HAC is an unsupervised
clustering method that creates a hierarchy of classes (clusters), and is frequently used after MFA. Given a set of variables created by the MFA, the HC algorithm cre-ates a hierarchy of categories, step by step—at each step merging the two categories that are closest, according to a given distance between categories. When it is a par-ticular distance (Ward distance), this algorithm aims to obtain categories that are homogeneous within and het-erogeneous between one another, with respect to an iner-tia-based criterion.
These approaches therefore allow us to build a partition of our unit into homogeneous clusters (low within-varia-bility) that are different from one another (high between-variability), ultimately producing a categorical indicator, referred to in our previous work as the Neighbourhood
Deprivation Index (NDI) [46] (for more detail, see Sabel
et al. [46]). These analyses were performed using SPAD
7.0 statistical software.
Synthetic neighbourhood design
To evaluate spatial implication of neighbourhood plan-ning, we have chosen to define specific boundaries of the neighbourhood, so as to use (1) a more homogeneous area (with high intra-zone homogeneity and inter-zone heterogeneity), and (2) an area with population size set to 2000 inhabitants, similar to the French census blocks, ensuring health data confidentiality.
To produce these synthetic neighbourhoods, we used the AZTool zone design program provided by David Martin (University of Southampton, UK) to aggregate contiguous and homogeneous spatial units (cells) for
gen-erating optimal geographies [47, 48]. To produce a
syn-thetic homogeneous neighbourhood, three criteria were considered: (1) output zone homogeneity (and inter-zone heterogeneity), using our NDindex as the homogeneity criterion; (2) population target size equal to 2000 inhab-itants (similar to French census blocks) to ensure health data confidentiality; (3) shape compactness, avoiding linear or quasi-linear output zones. To design the new zones, we used different combinations of relative weight-ing of parameters (criteria) in the AZTool (population target, shape and homogeneity) to create candidate sets of pseudo-blocks (in total six experimental conditions were tested). To improve AZT performance, we used simulated annealing (SA). Next, we evaluated the zonal system (each criterion defined below) to identify the opti-mal solution using a measure of within-area homogeneity (IAC) and measure shape compactness (P2A score) for each experimental condition. International experience and AZTool parameter setting advice accepts an IAC of greater than 0.5 as representing a very reasonable degree of homogeneity. Then, to improve AZT’s solution and
Table 2 Spa tial char ac teriza tion of diff er en t field of neighb our ho od Domain Ca tegor y Variables Spa tial shape G eog raphic I nf orma tion S yst em ( GIS) analy sis D omain 1: socio ‑ economic envir onment Population
Total population All socio
‑economic var i‑ ables Zonal data a vailable at census block le vel (2000 inhabitants on av erage) Using the Ar cGIS sof twar e z one ‑clipping algor ithm, w e disagg regat ed the var iables accor ding t o r eal w eighting int er polation methods
. Because the value of the inf
or
‑
mation transf
er
red t
o the cell was thus a func
tion of the ar
ea common t
o both the
initial ar
ea (her
e, the census block) and the g
rid cell , these var iables w er e able t o be int eg rat ed int
o the final analysis
D
omain 2 : public resour
ces Healthcar e syst em Location of doc tors ’ sur ger ies Location of healthcar e centr es
Point data: addr
ess
W
e assig
ned t
o each cell centr
oid the r
oad distance (non
‑E uclidian) t o the near est healthcar e centr e or doc tor ’s sur ger y Public par ks and gar dens Location and ar ea of public par ks and gar dens Poly gon data:
Location and siz
e W e built an attrac tiv eness index f or public par ks and gar dens , der iv ed fr om F rench stud ‑ ies sho
wing that attrac
tiv eness is a func tion of siz e. Using GIS t ools , w e dr ew concentr ic zones of attrac tiv eness b y ar ea: 100 m (ar ea less than 1 ha), 500 m (ar ea 1–10 ha), and 1000 m f or lar ger ar eas . W e subsequently comput ed this index f or each cell Spor ts facilities Location of spor t facilities
Point data: addr
ess and coor
dinat e X, Y The r oad net w or k distance t o the near est spor ts facilit y was attr ibut ed t o each cell centr oid Public transpor tation supply
Location of bus and tram st
op and the number of
lines ser
ved at each
Point data: coor
dinat
e X,
Y
Using GIS t
ools
, and on the basis of modal diff
er ential attrac tiv eness bet w een these t w o
types of public transpor
tation, w
e construc
ted a public transpor
tation a vailabilit y indi ‑ cat or , with a cat chment ar ea attr ibut ed t o each st op (300 m f or a bus st op , 400 m f or a tram station), w eight ed b
y the number of lines at each st
op or station.
This indicat
or
was then assig
ned t o each cell D omain 3: psy chosocial en vir onment Local businesses Location of r etail outlets
Point data: addr
ess and coor
dinat e X, Y Using GIS t ools , w e attr ibut ed t
o each unit the quantit
y of r etail st or es r elativ e t o all a vail ‑ able r
etail space within a radius of 200
m ar
ound the spatial unit centr
oids
. T
he r
esult
‑
ing values associat
ed with the r etail st or e scor ing ( quantit y of r etail st or es r elativ e t o all available r etail space) b y cat egor y (itinerant v endors; r etail f ood st or es; r etail non ‑food st or
es and other ser
vices) w er e attr ibut ed t o each unit a Location of f ood mar kets
Point data: addr
ess and coor
dinat e X, Y Charac ter ization of educational facilities
Violence in schools Schools
’ social scor
es
Pr
imar
y/middle and sec
‑
ondar
y (high) schools
ZEP (pr
ior
ity) and success
‑
ful (
AR) middle schools
M ap sho wing pr imar y and middle schools Secondar y (H igh) schools
Point data: addr
ess and coor
dinat e X, Y The F rench school en vir onment is g raded as: (1) P rior ity education z ones (ZEP ‑Z one d’ éduc ation prioritair e), wher e establishments r eceiv e additional r esour ces and ha ve gr eat er aut onom y f
or dealing with educational and social difficulties
, (2) “successful ambition ” z ones ( AR), ha ving f ew er (but definit
e) needs and thus f
ew er r esour ces), and (3) others . All non ‑pr ivat
e schools in the cit
y and their cat
chment ar ea w er e geocoded , using inf or mation pr ovided b y local author ities . W e comput ed an indicat or tak ing int o
account school densit
y and classification (pr imar y/middle or secondar y/high schools) Voting rat es Voting rat es Zonal data a vailable f or each cent er of v ot e Civic associations Civic associations
Point data: addr
ess and coor
dinat e X, Y The fair ly exhaustiv e and geor ef er
enced SIRENE database allo
w
ed calculation of the ratio
of the number of (
official) civic associations per 100 inhabitants in each unit, tak
ing int o consideration their t ype (r elig ious , political , other)
Type of civic associa
‑ tions: r elig ious , political , volunt eer
Point data: addr
ess and coor
dinat e X, Y a 200 m is the distanc e f or which 50% of the c ells ha ve a
t least one mar
the found optimum solution, we sought to optimise two conditions for which IC >0.5 and which also presented a shape that was more compact than linear, by increasing the number of iterations. For more details, see Sabel et al.
[46].
Health data: MI
All MI events [International Classification of Diseases, 9th Revision (ICD-9): 410] occurring in the SMA, among the population aged 35–74 years, collected by the
Bas-Rhin coronary heart disease register [49] between
Janu-ary 1, 2000 and December 31, 2007 were geocoded at their residential address areal unit (see below). Spe-cific annual rates, standardized by age and gender (per 100,000 inhabitants), were calculated for each
neighbour-hood by contextual profile. Khi2 tests were performed
to compare the annual rate between the five contextual profiles.
Spatial method
In order to explore the geographic pattern of the MI risk, we used the spatial scan statistics (implemented in
the SaTScan software [50]) to statistically and
signifi-cantly detect the presence of potential clusters for both high and low risk. This approach, used in an increasing number of applications in the field of spatial
epidemiol-ogy [51–55], allowed us to (1) identify the specific spatial
location of the clusters and (2) evaluate and understand the implications of neighbourhood characteristics in the
spatial distribution of MI risk [56, 57].
The procedure works as follows: a circle (or windows) of variable radius (from zero up to 50% of population size
[56]) is placed at every centroid of the synthetic
neigh-bourhood and moves across the whole study area to compare the MI rate in the windows with what would be expected under a random distribution.
In our study, the Poisson probability model
imple-mented in the SaTScan software [50] was chosen as
clus-ter analysis method. The number of cases in each census block is assumed to follow a Poisson distribution. Our cluster detection approach identified clusters of both high and low rates with maximum circle window size, to include up to 50% of the population at risk. Identification of the most-likely clusters is based on a likelihood ratio
test [56] with an associated p value obtained using Monte
Carlo replications [58]. The number of Monte Carlo
rep-lications was set to 999 to ensure adequate power for defining clusters and considered a 0.05 level of signifi-cance (p value derived from 999 replications).
If we detect a significant most-likely cluster (with p < 0.05) using this method, a logical next step is to take account of the individual characteristics acknowledged in the literature and available in our studies, to see whether
the significant cluster can be explained by suspected risk factors. Spatial analyses were thus performed in two stages (step by step):
1. Unadjusted analysis, to identify and localize the most-likely cluster of high/low risk of MI.
2. Analysis adjusted for age and sex included this
infor-mation directly in the SaTScan model [50].
Results
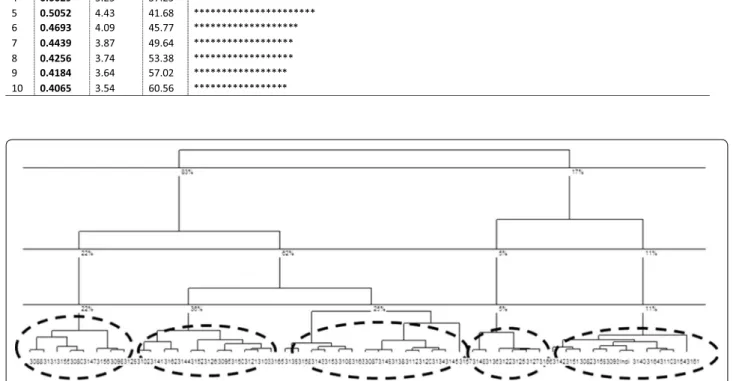
The MFA was applied on the 27 selected variables cov-ering the three contextual groups described above. The first four components explain only 17, 8, 5 and 5% of total
variance respectively (Table 3). These components can be
interpreted using the contributions made by both groups and variables to the components or their graphical repre-sentations. To explain 60% of total variance, we needed to use ten components, because all ten were used as a basis for the HC in order to preserve all the variability of the initial information.
In line with the MFA, we performed an HAC—and according to both the dendrogram and the Ward
dis-tance (Fig. 1), we chose a 5-category partition. From
the HAC analysis, then, five clusters (or contextual
pro-files Table 4), were determined using the coordinates
of the cells for the first ten factorial axes of the MFA. Using the characteristics of each category by variable
(Table 4), five contextual profiles can be identified in
the SMA.
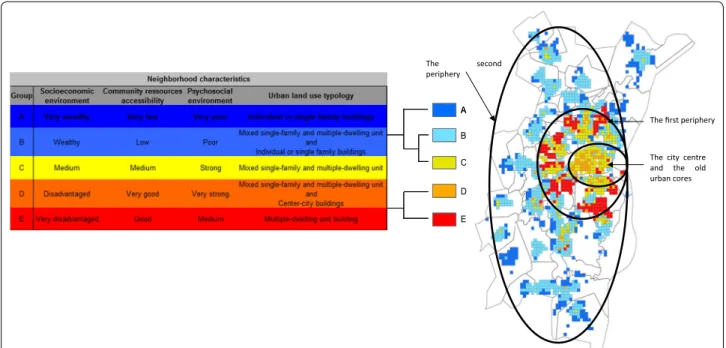
In total, we have identified: Two profiles (A and B) characterized by favourable socioeconomic conditions, low psychosocial cohesion, and poor access to public resources; two profiles (D and E) characterized by low socioeconomic conditions, very strong psychosocial cohesion and very good access to public resources, and profile (C) characterized by medium socioeconomic con-ditions, high psychosocial cohesion and average access to public resources.
Table 4 shows neighbourhood characteristics for the
five contextual profiles, determined through multidimen-sional analysis (MFA and HAC).
Figure 2 shows the spatial distribution of these five
contextual profiles from ‘A’ (least deprived) to ‘E’ (most deprived). Mapping these profiles shows that neighbour-hood planning is spread unevenly across our study area. We have highlighted a centre-periphery gradient with two groups (C and D) characterizing the city centre and the old urban cores. A first periphery of SMA (profile E) concentrated on inner city neighbourhoods, which tend to be more distant from the historic city centre. A second periphery of SMA (profiles A and B) correspond to the urban extensions of the last decade and the urban spread in the SMA.
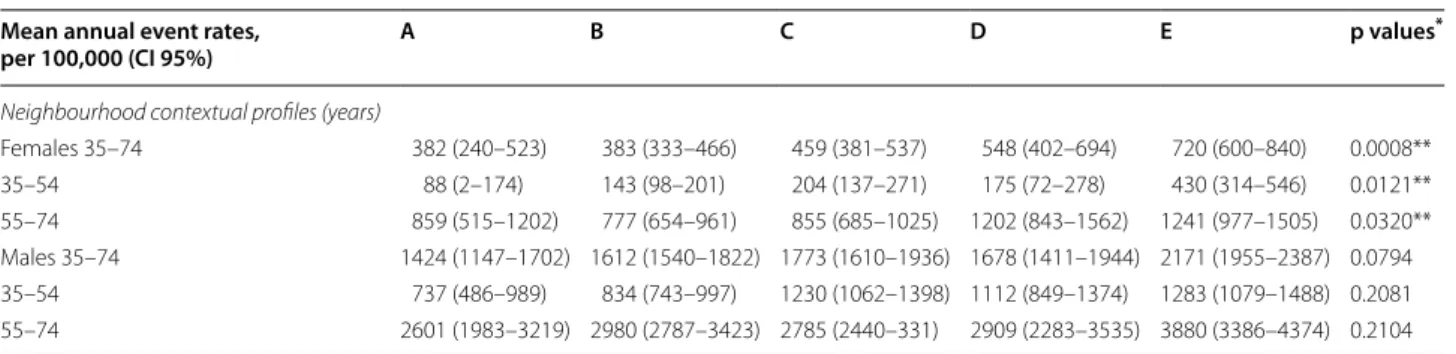
Table 5 presents the age-standardized mean annual rates (per 100,000 inhabitants) by gender and by neigh-bourhood contextual profile. Regardless of contextual profile, MI rates in women are always lower than those in men, at all ages, and MI rates are always much higher among the elderly. Secondly, profile A and B neighbour-hoods are characterized by lower rates than the other profiles. Finally, MI rates differ significantly between con-textual profiles among women.
Identification of MI risk cluster
Spatial distribution of MI risk is not random, either across all SMA or between the five contextual profiles.
We identified three spatial clusters of high risk of MI
(Fig. 3; Table 6) located mainly in the Strasbourg
cen-tre and first periphery of Strasbourg. These clusters are presented in order of most-likely cluster to least
likely cluster in Fig. 3. Risk in the most-likely cluster
(in the northern SMA) is 1.70 times greater than in the rest of the study area (p value = 0.001). The sec-ond cluster, also identified within the northern part
of the metropolitan area (RR = 1.28) was not statisti-cally significant, while the third cluster was located in the southern part of the metropolitan area (RR 2.02). After adjustment for gender and age group, we found the same most-likely cluster [relative risk (RR) 1.64; p value = 0.001] with a slightly lower likelihood value (down from 22.56 to 19.73), indicating that age and sex can explain some of the excess risk of MI observed in
the unadjusted analysis (Fig. 3).
On the other hand, we identified two spatial clusters of
low MI risk (Fig. 3; Table 6) located mainly in the
Stras-bourg first and second peripheries. These clusters are presented from most-likely cluster to least likely cluster
in Fig. 3. The most-likely cluster, in the western SMA,
has lower risk that than in the rest of the study area (RR 0.04; p value = 0.001). The second cluster was also in the northern part of the metropolitan area, and was also statistically significant (RR 0.68; p value = 0.001). After adjustment for gender and age group, we found the same most-likely cluster, with a slightly lower likelihood value
decreasing from 46.94 to 46.19 (Fig. 3).
Table 3 Eigenvalue and variance explained by the ten first components of the MFA
Axe
Eigen-value % Variance % Cumul
1 1.9973 17.39 17.39 ********************************************************************************* 2 0.9973 8.69 26.08 ***************************************** 3 0.6796 5.92 32.00 ******************************* 4 0.6029 5.25 37.25 ************************** 5 0.5052 4.43 41.68 ********************** 6 0.4693 4.09 45.77 ******************* 7 0.4439 3.87 49.64 ****************** 8 0.4256 3.74 53.38 ****************** 9 0.4184 3.64 57.02 ***************** 10 0.4065 3.54 60.56 *****************
Table 4 Description of neighbourhood characteristics of five contextual profiles
Very high: very good social support, high: good social support; low: low social support; very low: very low social support
The first two axes of the MFA explained 29.14% of the variance. From the HAC analysis, 5 clusters or contextual profiles were determined from the coordinates of the cells for the first ten factorial axes of the MFA, so as to preserve all the variability of the initial information
CAF fund for family allocations, RMI minimum insertion income
Class A Class B Class C Class D Class E
Socio economic feature
Proportion of population covered by CAF 42.2% 44.7% 50.24% 51.40% 62.16%
Proportion of population covered by RMI 1.9% 1.5% 5.19% 4.64% 10.88%
Population density 71.13 180.24 556.10 706.04 470.48
Proportion of precarious jobs 8.62% 9.33% 13.32% 14.46% 16.58%
Proportion of stable jobs 76% 75% 68% 65% 59%
Unemployment rate 5.95% 6.61% 10.04% 11% 19.83%
Proportion of blue‑collar workers 18.77% 18% 17% 16% 32%
Proportion of high school graduates 10.38% 10% 6.68% 9.70% 5.29%
Proportion of single‑parent families 8.19% 9.11% 13.01% 13.5% 19.79%
Proportion of foreigners 4.03% 4.5% 8.79% 9.45% 17.60%
Proportion of people without cars 9.02% 10.5% 23.38% 30.6% 29.04%
Proportion of people with 2 cars 43.54% 38.41% 20.69% 17.05% 17.64%
Access to resources
Availability of green space 5.48 2.06 4.75 8.89 6.91
Distance to healthcare facilities (m) −1385.55 478.25 263.71 214.88 399.00
Public transportation coverage 2.28 7.75 20.88 23.19 15.12
Distance to sports facilities (m) 996.96 522.37 353.44 339.95 349.59
Psychosocial environment
Quantity of civic associations Very low Low high Very high Medium
Local school socio‑educational classification Very high High Low Medium Very low
Local retail store score Very low Low High Very high Medium
Urban fabric (housing types) Single‑family
homes Mixed buildings Mixed build‑ings Center‑city homes and Mixed Multiple‑dwelling unit buildings
AA B
C
D
E
The city centre and the old urban cores The first periphery
The second
periphery
Spatial implication of neighbourhood characteristics of the clusters
In the clusters for high MI risk, the population profile is mainly ‘D & E’ which is socioeconomically very disadvan-taged, with weak psychosocial cohesion and good access
to public resources (see Tables 2, 7). Thus, compared to
inhabitants in the rest of the study area, people living in
those clusters identified as high MI risk, which had the highest proportion of population covered by welfare ben-efits (family allowances/child benben-efits, and the French “safety net” welfare allowance for people with resources below the poverty line), high rates of insecure employ-ment, and the highest proportion of foreigners. These spatial units are characterized by good access to sports
Table 5 Distribution of myocardial infarction event rates according to contextual profiles
* Khi2 test
** Significant p value <5% Mean annual event rates,
per 100,000 (CI 95%) A B C D E p values
*
Neighbourhood contextual profiles (years)
Females 35–74 382 (240–523) 383 (333–466) 459 (381–537) 548 (402–694) 720 (600–840) 0.0008** 35–54 88 (2–174) 143 (98–201) 204 (137–271) 175 (72–278) 430 (314–546) 0.0121** 55–74 859 (515–1202) 777 (654–961) 855 (685–1025) 1202 (843–1562) 1241 (977–1505) 0.0320** Males 35–74 1424 (1147–1702) 1612 (1540–1822) 1773 (1610–1936) 1678 (1411–1944) 2171 (1955–2387) 0.0794 35–54 737 (486–989) 834 (743–997) 1230 (1062–1398) 1112 (849–1374) 1283 (1079–1488) 0.2081 55–74 2601 (1983–3219) 2980 (2787–3423) 2785 (2440–331) 2909 (2283–3535) 3880 (3386–4374) 0.2104
Fig. 3 Spatial location of significant Clusters of high risk of myocardial infraction (in red) and low risk of myocardial infarction (in blue) identified in Strasbourg metropolitan area a crude analysis; b adjusted analysis on age and sex
facilities and high retail store scores. This group is distin-guished by the highest availability of green spaces, high public transportation coverage and weak community/ civic fabric.
However, in the low MI risk cluster, the population profile is mainly ‘A’—which describes the most socio-economically advantaged areas having low psychosocial cohesion and very poor access to public resources (see
Tables 2, 7). This most-likely cluster identified for low MI
risk (n = 5018 inhabitants in the significant spatial clus-ters) had a significantly lower proportion of inhabitant rates of unemployment and of insecure (or temporary) jobs: on the contrary, the employment rate is stable and the proportion of high school graduates is highest. This group is characterized by the longest distances to health-care facilities, and very poor access to public transport. It has an extremely favourable socioeconomic profile with low psychosocial cohesion and very poor access to public resources.
Discussion
Our study confirms work we previously conducted on
the SMA [59], which demonstrated that, whatever the
level of deprivation, the rates of events in men were always clearly higher than those in women, at all ages. The literature reported that the relationship between
neighbourhood characteristics may vary by gender, as our findings suggest. For instance, several studies have found stronger associations of neighbourhood charac-teristics with CHD outcomes in women than in men
[60–62]. These gender differences could result from
gen-der differences in health-related behavioural responses to neighbourhood perceptions. In addition, we observed a clear increase to the event rate with age, even after strati-fication by gender and deprivation.
Our study’s data-driven approach has allowed us to provide a fine description of the neighbourhood, using a set of contextual data. It highlights several neighbour-hood profiles and provides us with evidence on the dif-ferent combinations of dimensions within the SMA. In comparison with the literature, our profiles reveal differ-ences—especially with regard to how the socioeconomic, social cohesion and access to amenities dimensions are combined.
Several studies show that individuals living in deprived socioeconomic environments have less access to busi-nesses, sports leisure and other infrastructure. For instance, some have revealed that people living in deprived neighbourhoods are less likely to make use of green spaces because they do not perceive the need
to do so [63, 64]. We revealed an inverse relation in the
SMA: neighbourhoods with a deprived socioeconomic
Table 6 The most likely clusters of high and low risk
a rr Relative risk b LLr Log likelihood ratio
Radius (m) Area included/population Expected cases Observed cases RRa LLrb p value
Most likely cluster of high risk 1207.74 10/11,486 125.68 205 1.70 22.56 0.001
Most likely cluster of low risk 1978.61 5/5018 54.91 2 0.036 46.95 0.001
Table 7 Comparison between neighbourhood characteristics of inhabitant of cluster of high risk and inhabitant of clus-ter of high risk
a Neighbourhood characteristics of profile “E” and “C” which composed cluster of high risk b Neighbourhood characteristic of profile “A” which composed cluster of low risk
c ZEP Priority education zones: where establishments receive additional resources, and have greater autonomy for dealing with educational and social difficulties
* Khi test
Main characteristics Most likely cluster p value*
Cluster of high riska Cluster of low riskb
No civic associations 1.2% 99% <0.0001
No school graded ZEPc 22.11 96% <0.0001
Proportion of population covered by CAF higher that 60% 67% 13.62 <0.0001
Multiple–dwelling unit buildings 58.79 2.90 <0.0001
Single–family homes 24.6 90.43 <0.0001
Distance to healthcare facilities (<500) 76.8 4.93 <0.0001
No public transportation 10 60 <0.0001
environment are characterized by a substantial presence of sports leisure infrastructure, unlike neighbourhoods with an advantaged socioeconomic environment.
Another aspect highlighted by the literature concerns the relationship between social capital and socioeco-nomic deprivation. Research projects have demonstrated that socioeconomic deprivation is associated with
reduced levels of social capital [65]. Our study, however,
shows the opposite result. In the SMA, neighbourhoods with an advantaged socioeconomic environment are characterized by a low level of social cohesion in com-parison with neighbourhoods with a deprived socioeco-nomic environment, which are characterized by a high level of social cohesion.
Regarding the geospatial analysis performed (based on the Kulldorff approach), our study characterized the neighbourhoods of inhabitants living within a cluster of high MI risk, in comparison with those living within a cluster of low MI risk. Although our study allows us to precisely characterize the neighbourhoods included in the cluster with higher MI risk, it was not designed to reveal the MI risk factor among neighbourhood charac-teristics. Our spatial analysis is more suited to the for-mulation of certain hypotheses aimed at improving our understanding of the unequal spatial distribution of MI risk using the contextual data panel.
• First, the neighbourhood characteristics of inhab-itants living within a cluster of high or low MI risk seem to have more disadvantaged and advantaged conditions respectively, confirming the results of
pre-vious studies [66]. Indeed, MI risk was significantly
higher among: those whose education ceased after primary or secondary school, compared with those
with a higher level of education (university) [66]; the
unemployed [67], and men in the lowest
socioeco-nomic group [68].
• Secondly, using only the accessibility and attractive-ness of amenities indicator, our study revealed that within high MI risk clusters, inhabitants have excel-lent access to various amenities (including trans-port, green space and park and sports facilities)—in contrast to the low MI risk clusters. In the literature, results are contrasted depending on the measure used to describe availability/proximity of the infra-structure. For instance, some studies reported pro-tective associations of green space against high blood
pressure [69], coronary heart disease and
cardiovas-cular disease mortality [70]. In New Zealand,
how-ever, Richardson et al. found no evidence that cardio-vascular disease mortality was related to availability of either total or usable green space. In Tamosiunas
et al. [71] found that the prevalence of cardiovascular
risk factors was not related to the distance from peo-ple’s homes to green spaces—but was significantly lower among park users than among non-park-users. • Lastly, the characterization of neighbourhoods of
inhabitants living within a cluster of high MI risk show that they have high psychosocial cohesion in comparison with inhabitants within a cluster of low MI risk. This finding is incoherent with other stud-ies which found that lower neighbourhood cohesion predicted higher coronary artery calcification
preva-lence [72].
What this research adds in public health?
Beyond the geospatial approach applied on the local ter-ritory in France, this study answers to a major problem identified today by WHO to which classical epidemio-logical approaches do not respond. The European Union, supported by the World Health Organization (WHO), recognizes that it is time to move from the research about risk factors of health disparities to actions which aim to reduce them. Research conducted in public health policy issues supply little evidence for effective interven-tions aiming to improve population health and to reduce health inequalities.
This paper is attempts to fill the gap regarding a need for powerful tool to support priority setting and guide policy makers in their choice of health interventions, and that maximizes social welfare.
Today, more and more international and European institutions suggest certain actions on place that could improve health and thus tend to reduce health inequali-ties, such as improving access to, and quality of, green space, particularly in deprived areas—providing places for play, physical activity and favouring social interaction. For instance, the World Health Organization has also announced that access to green spaces can reduce health
inequalities, improve well-being [73]. More recently,
NHS Health Scotland stated, in the “Place and Commu-nities Report” that policy and practice should continue to integrate health, housing, environment, transport, and community and spatial planning to improve health
out-comes and promote sustainability [74].
In the majority of epidemiological research projects investigating health inequalities, sophisticated analyses are implemented to measure the strength of the associa-tion between risk factors and outcomes. These research findings may be pivotal to public health policy, but an attempt to distinguish between correlational and causal associations does not form the basis of effective inter-ventions aimed at improving population health and reducing health inequalities. These classic epidemiologi-cal approaches offer limited guidance to policymakers in their choice of intervention, and suggest the need for
spatial approaches to the investigation of social health inequalities.
Our study describes an approach that may guide poli-cymakers in selecting which priority setting to use, and in choosing and developing the most appropriate local intervention if, for instance, they decide to apply the ‘pro-portionate universalism’ strategy described by Marmot in 2010. Policymakers are thus enabled to plan targeted interventions, choosing one of two appropriate broad approaches to action that are commonly accepted today
as reducing health inequalities [36].
The present paper permits to novel way to investigate the social health inequalities:
1. Our work highlights that the investigation of the spatial distribution of multiple risk factors, includ-ing social, economic and contextual factors, can help policy makers to choose appropriately between two or more broad approaches which will be performed for the whole population, but with a scale and inten-sity proportionate to need.
2. The local diagnosis can assist policy makers to focus the scope of prevention/intervention programs and changes to the health care system, thus providing more effective interventions in order to response to individual needs, and public resources can be distrib-uted more efficiently. Thereby, this spatial tool may assist the policy maker to tackle the social gradient in health if they choose to apply the strategy named ‘proportionate universalism’ and described by
Mar-mot in 2010 [75].
3. In addition, our study show that the use of a rou-tinely-collected data set within a data-driven approach to characterize neighbourhood, alongside a geospatial tool combined with GIS will be particu-larly relevant and of interest to policymakers involved in the identification, definition and promotion of tar-geted health inequality actions at varying spatial lev-els.
4. This study illustrates the usefulness of the geospatial approach using routinely-collected data to support policy makers in planning more focused community interventions in appropriate areas and to choose if public health interventions should be declined either at a national level, at a local level, or both.
Strengths
The areal unit we constructed at a very small scale allowed us to consistently accommodate data produced at different scales. Our use of a single grid allowed us to minimize the effect of scale associated with the
modifia-ble areal unit promodifia-blem (MAUP), [76] because all the basic
spatial units (cells) were constructed to have the same
area. These new spatial units offer three benefits: (1) they make it possible to homogenize the best of the data col-lected, prior to any statistical or spatial analysis; (2) they allow us to spread the value of a piece of geographic information initially noted or represented according to a specific unit, in values calculated according to regular spatial units, while preserving the integrity of the initial information; and finally (3) the point of using these cells as statistical units is to allow an extremely detailed anal-ysis while preserving total health data anonymity in the subsequent analysis.
Weaknesses
Our approach did have certain limitations in terms of the contextual data used. Data availability necessarily con-strains the variables integrated to this analysis, so that the number of contextual dimensions used to characterize neighbourhood context is also constrained.
We acknowledge that some data could not be included in our analysis. This is the case, for example, for violence in neighbourhoods, the presence of exterior annoy-ances and substandard housing. Traffic noise data, for instance, is considered politically sensitive when dis-played at a fine scale, and we were unable to obtain access to this. The collection of data regarding quality of hous-ing and exterior annoyances is available only for the City of Strasbourg, and is not available across the SMA scale. In addition the health data was collected between 2000 and 2008, while the contextual data was mainly avail-able between 2007 and 2008, with the exception of the socioeconomic data, obtained from the 1999 census. The collection of data according to availability may result in a temporal gap between contextual data and its out-come data, which could influence the result observed. In our study, we are however unable to measure this misclassification.
Conclusion
We proposed a data-driven approach developed at fine spatial scale level, aimed at the investigation of neigh-bourhood characteristics capable of explaining geo-graphical distribution of the onset of MI risk. In our study, we characterized the neighbourhood free of any a priori hypothesis, and without weighting certain contex-tual neighbourhood components, privileging the use of diverse contextual neighbourhood profiles and the ad hoc synthetic neighbourhood areal unit. Our spatial approach allowed us to identify the neighbourhood characteristics of inhabitants living within a high MI risk cluster in com-parison with those living within a low MI risk cluster.
Therefore, spatial data-driven analyses of routinely-collected data georeferenced by various sources may serve to guide policymakers in defining and promoting
targeted actions at fine spatial level. Armed with local characterization of the combination between the socio-economic dimension, social cohesion and access to amenities relating to social inequalities in health, policy-makers may be able to promote more accurately-targeted actions aimed at reducing health inequalities, and pro-mote a better understanding of social, healthy behaviour among deprived populations. An open question worthy of further research would be to determine the minimal set of data (according to the principle of parsimony and for the sake of efficiency) needed to appropriately char-acterize neighbourhood influences, given that what holds true in a given area may differ across geographical set-tings having different historical and sociological contexts.
Authors’ contributions
WKT collected all contextual and health data, geocoded the cases to the IRIS level, undertook the statistical and spatial analysis, produced the map, carried out the literature review and drafted the paper. CW, head of the unit TETIS UMR 9000 monitored the general work, helped with the analysis and interpretation of the results and contributed to draft and finalize the paper. GP implemented the data‑driven approach to neighbourhood characteriza‑ tion and helped to finalize the paper. CS helped with the interpretation of the results and contributed finalize the paper. DA head of the Bas‑Rhin coronary heart disease register, were responsible of the collected health data, contrib‑ ute to design of the work and draft and finalize the paper. CES contributed to Synthetic neighbourhood design, the interpretation of the results and helped to draft and finalize the paper. SD contributed to spatial analysis and helped with the interpretation of the results and finalize the paper. DB principal inves‑ tigator of the PAISARC + Project, was responsible for quality assurance and rigor in the data analysis, contributed to interpret the results and reviewed the drafts of the article and contributed to finalize it. All authors read and approved the final manuscript.
Author details
1 LIVE UMR 7362 CNRS (Laboratoire Image Ville Environnement), Univer‑
sity of Strasbourg, Strasbourg 6700, Strasbourg, France. 2 UMR Tetis (Ter‑
ritoires, environnement, télédétection et information spatiale), Montpelier, France. 3 The French National Public Health agency, Saint‑Maurice, France.
4 SEPIA‑Santé, Baud, France. 5 Department of Epidemiology and Public Health,
EA 3430, FMTS, Strasbourg University, Strasbourg, France. 6 School of Geo‑
graphical Sciences, University of Bristol, Bristol BS8 1SS, UK. 7 Department
of Environmental and Occupational Health, School of Public Health (EHESP), Sorbonne Paris Cité, Rennes, France. 8 Department of Social Epidemiology,
Sorbonne Universités, UPMC Univ Paris 06, INSERM, Institut Pierre Louis d’Epidémiologie et de Santé Publique (UMRS 1136), Paris, France. 9 Depart‑
ment of Quantitative Methods in Public Health, School of Public Health (EHESP), Sorbonne Paris Cité, Rennes, Paris, France.
Acknowledgements
The authors gratefully acknowledge the use of the AZTool software, which is copyright David Martin, Samantha Cockings and University of Southampton. Competing interests
The authors declare that they have no competing interests. Availability of data and materials
The confirmed Myocardial infarction cases were collected from the Bas‑Rhin coronary heart disease registry. Access to relevant data is restricted by la commission Nationale informatique et Liberté (CNIL). Requests for the data may be submitted at the following URL: http://www.cnil.fr/vos‑obligations/
declarer‑a‑la‑cnil/.
Consent for publication
All authors read and approved the final manuscript. Ethics approval and consent to participate
The health data were extracted from the Bas‑Rhin coronary heart disease registry that was approved by CNIL (Commission Nationale de l’Information et des Libertés).
Funding
This work was supported by French Agency for Food, Environmental and Occupational Health & Safety (ANSES); Institute for Public Health Research (IRESP); French Environment and Energy Management Agency (ADEME); and SITA Corporation. The funders had no role in study design, data collection and analysis, decision to publish, or preparation of the manuscript.
Appendix
Publisher’s Note
Springer Nature remains neutral with regard to jurisdictional claims in pub‑ lished maps and institutional affiliations.
Received: 5 December 2016 Accepted: 23 May 2017
References
1. Judge K, Platt S, Costongs C, Jurczak K. Health inequalities: a challenge for Europe. Discussion Paper. London: UK Presidency of the EU. 2006. http:// ec.europa.eu/health/ph_determinants/socio_economics/documents/
ev_060302_rd05_en.pdf.
2. Sheiham A. Closing the gap in a generation: health equity through action on the social determinants of health. A report of the WHO Commission on Social Determinants of Health (CSDH) 2008. Community Dent Health. 2009;26:2–3.
3. Marmot M, Allen J, Bell R, Bloomer E, Goldblatt P. Consortium for the European review of social determinants of health and the health divide. WHO European review of social determinants of health and the health divide. Lancet. 2012;380:1011–29.
4. Macintyre S, Ellaway A, Cummins S. Place effects on health: How can we conceptualise, operationalise and measure them? Soc Sci Med. 2002;55:125–39.
5. Diez Roux AV. Neighborhoods and health: Where are we and were do we go from here? Rev Epidemiol Sante Publique. 2007;55:13–21.
6. Diez Roux AV. Residential environments and cardiovascular risk. J Urban Health. 2003;80:569–89.
7. Kawachi IB. Neighborhoods and health. New York: Oxford University Press; 2003.
8. Pickett KE, Pearl M. Multilevel analyses of neighbourhood socioeconomic context and health outcomes: a critical review. J Epidemiol Community Health. 2001;55:111–22.
9. Arcaya MC, Tucker‑Seeley RD, Kim R, Schnake‑Mahl A, So M, Subrama‑ nian SV. Research on neighborhood effects on health in the United States: a systematic review of study characteristics. Soc Sci Med. 2016;168:16–29.
10. Vos AA, Posthumus AG, Bonsel GJ, Steegers EAP, Denktaş S. Deprived neighborhoods and adverse perinatal outcome: a systematic review and meta‑analysis. Acta Obstet Gynecol Scand. 2014;93:727–40.
11. Truong KD, Ma S. A systematic review of relations between neighbor‑ hoods and mental health. J Ment Health Policy Econ. 2006;9:137–54. 12. Corral I, Landrine H, Hall MB, Bess JJ, Mills KR, Efird JT. Residential segrega‑
tion and overweight/obesity among African–American adults: a critical review. Front Public Health. 2015;3:169.
13. Owen N, Humpel N, Leslie E, Bauman A, Sallis JF. Understanding environ‑ mental influences on walking: review and research agenda. Am J Prev Med. 2004;27:67–76.
14. Rose D, Richards R. Food store access and household fruit and vegetable use among participants in the US food stamp program. Public Health Nutr. 2004;7:1081–8.
15. Matthews SA, Yang T‑C. Exploring the role of the built and social neigh‑ borhood environment in moderating stress and health. Ann Behav Med. 2010;39:170–83.
16. Pearce J, Witten K, Hiscock R, Blakely T. Are socially disadvantaged neighbourhoods deprived of health‑related community resources? Int J Epidemiol. 2007;36:348–55.
17. Komeily A, Srinivasan RS. What is neighborhood context and why does it matter in sustainability assessment? Proc Eng. 2016;145:876–83. 18. Niemann H, Bonnefoy X, Braubach M, Hecht K, Maschke C, Rodrigues
C, et al. Noise‑induced annoyance and morbidity results from the pan‑ European LARES study. Noise Health. 2006;8:63–79.
Domain 1: Socioeconomic Domain 2: Community Resources Access to : Recreational facilities Green space Health care Public transport
Hierarchical Ascendant Classification (HAC)
Civic associations Voting rates
Availability of local retail stores
Building types Education environment
Quantitative data : Principal Component Analysis
Qualitative data : Multiple
Correspondance Analysis
Multiple Factor Analysis (MFA)
Spatial neighborhood typology
Demographic and socioeconomic data from the 1999 national population census
Domain 3:
Psychosocial Environment