ANALYSIS OF ISSUES AND TRENDS IN THE GROWTH OF FUEL CELL
FIRMS
by
SRINIVAS CHILUKURI
MS Aerospace Engineering, Indian Institute of Science at Bangalore, India, 1990
Submitted to the Sloan School of Management in Partial Fulfillment of the Requirements for the Degree of
MASTERS OF SCIENCE IN MANAGEMENT OF TECHNOLOGY
at the
MASSACHUSETTS INSTITUTE OF TECHNOLOGY
June 2003
© 2003 Srinivas Chilukuri. All Rights Reserved.
The author hereby grants to MIT permission to reproduce and to distribute publicly paper and electronic copies of this thesis document in whole or in part.
Signature of Author: ______________________________________________________
Sloan School of Management May 9, 2003 Certified by: _____________________________________________________________
Stephen R. Connors, Thesis Supervisor Director, Analysis Group Regional Electricity Alternatives (AGREA) MIT Laboratory For Energy and the Environment Accepted by: ____________________________________________________________
Dave Weber Director, Management of Technology Program
ANALYSIS OF ISSUES AND TRENDS IN THE GROWTH OF FUEL CELL
FIRMS
by
SRINIVAS CHILUKURI
Submitted to the Sloan School of Management on May 9, 2003 in Partial Fulfillment of the Requirements for the Degree of Masters of Science in Management of Technology
ABSTRACT
Recent scientific progress has shown significant signs that fuel cells will become a tremendous and significant part of distributed energy markets in the future. Fuel Cell technology though first discovered in late 1830s by Sir William Grove, a Welsh judge and scientist only took off when NASA first introduced them in the Gemini space program in 1960s. Technology evolution and the need for a clean energy source for the space program caused the renewed interest in Fuel Cells. A significant amount of progress and numerous investments have been made securing a future for Fuel Cells. The question that remains is not if Fuel Cells will develop into an industry, but when might it evolve and deliver on the promises so intrepidly set forth by researchers, corporations, and investors. The question has been debated many times over in the popular press. For certain, no one is exactly sure what ‘when’ really means. What this thesis is more interested in is the “how”. How will Fuel Cells technology and markets evolve? What factors will determine the industry structure that will influence the development of this industry? How large can we expect this industry to grow? What will be the key drivers for growth? How will different members of this industry facilitate the development of this technology? What form will the industry take? What are some of the current challenges facing the fuel cell manufacturing companies in their growth?
This Thesis investigates the formation and growth of Fuel Cell firms in Massachusetts, New York and Connecticut (within 150 miles of Boston) and the current issues facing the upper Management / Founders of these companies. By studying the key factors and developments in these industries different lessons and patterns can be extrapolated which may help answer some of the burning questions surrounding fuel cell industry evolution and where they are on the technology S curve. The basic framework used in this study is taken from the paper written by Gransey to analyze High-tech firms’ growth. Eight firms were interviewed using a questionnaire format developed earlier by Prof Elicia Maine to study the materials industry growth.
The results of this analysis do indeed conclude that the firms felt that fuel cell is a great product, but it has limitations. It is impossible at this point to beat the grid in cost or reliability with a single piece of equipment- the grid has multiple redundant generating devices and is virtually free. The value of a fuel cell is the ability to have much higher power quality at your location to increase your grid reliability an additional 9 times. It is currently expensive to do this, but no other technology has this capability. Several companies have been formed with lot of optimism and potential for a huge payoff. People are less likely to share ideas in this industry compared to
on and seem to have lot of interactions with the local lawyers for IP filing and protection. Most of the firms did not participate in local industry organizations for the fear of exposing their perceived advantage. Currently fuel cell firms are facing economic challenges due to the downturn in the economy which in turn resulted in the slow down in fuel cell technology research investments. Also as the company grows they are realizing that the market risk is higher than what they have anticipated when they started. This may have an interesting consequence related to the sales and marketing strategy of these companies. Risk is still high, less technology risk than economic and market risk.
Thesis Supervisor: Stephen R. Connors
TABLE OF CONTENTS: ABSTRACT... 2 Index of Exhibits:... 6 Acknowledgement ... 7 CHAPTER 1 ... 8 Introduction... 8 Motivation... 8 Objectives ... 9 CHAPTER 2 ... 10 Introduction... 10
Major trends affecting the energy industry... 10
Distributed generation overview... 11
Hydro: ... 12
Thermal:... 12
Nuclear:... 12
Motivation for distributed generation ... 12
Distributed generation... 14
Criteria for success of distributed generation ... 17
Companies currently dominating the DG market ... 17
CHAPTER 3 ... 19
Basics of fuel cell technology ... 19
History of fuel cells... 19
Fuel cell technology... 20
Types of fuel cells... 21
Fuel cell value chain ... 22
Fuel cell versus Carnot efficiency... 23
Fuel cell systems for distributed power generation ... 26
Fuel Cell Benefits: ... 27
CHAPTER 4 ... 29
Innovation and diffusion ... 29
Life cycles for innovation and product development ... 29
Research methodology... 30
Sample selection ... 30
Interview and questionnaire... 30
Geographic location... 30
RESEARCH FINDINGS:... 31
SECTION 1: Company and Entrepreneur’s Background... 31
SECTION 2: Local Influence on Growth ... 31
SECTION 3: Growth model for NTBF’s... 35
SECTION 5: Founders experience ... 39
SECTION 6: Financing... 39
SECTION 7: Firm Growth History... 39
SECTION 8: Intellectual Property Protection ... 39
Sales and distribution channels:... 41
Complementary innovations: ... 41
Disruptive technology or not: ... 42
Cost Reduction:... 42
Industry structure / business model: ... 44
ISSUES FACING THE INDUSTRY: ... 45
Technical Challenges:... 45
Cost of Production: ... 45
Sustained Access to Capital:... 46
Access to Skilled Resources: ... 46
Demonstration of the Benefits: ... 46
Codes and Standards:... 46
Transportation Fuelling Infrastructure:... 47
INDUSTRY DRIVERS: ... 47 Environmental concerns: ... 47 Energy Security:... 47 Electricity reliability ... 47 User savings ... 47 Performance standards ... 47
Fuel stock efficiency ... 48
Sustainability... 48
Off grid power... 48
REFERENCES: ... 49
APPENDIX A:... 51
QUESTIONNAIRE: ... 51
SUPPLEMENTARY QUESTIONNAIRE ... 66
APPENDIX B: ... 68
Comparison of power generation technologies... 68
APPENDIX C: ... 69
Organizations involved in the fuel cell codes and standards: ... 69
APPENDIX D:... 70
Companies involved in fuel cell that exist in 2003:... 70
APPENDIX E: ... 71
History of Fuel Cells:... 71
APPENDIX F: ... 73
State support for the fuel cell industry... 73
APPENDIX G:... 75
Index of Exhibits:
Figure 1 : Electricity Fueled by digital economy... 13
Figure 2 : Distributed generation market growth... 14
Figure 3: Distributed generation Market Share (Revenues) ... 18
Figure 4 : World Order for Generation Equipment ... 18
Figure 5 : Fuel Cell basic configuration ... 20
Figure 6 : Fuel Cell comparisons based on applications... 22
Figure 7 : Fuel Cell Value Chain ... 23
Figure 8 : Energy Conversion of Fuels... 24
Figure 9 : Relative theoretical efficiency change with temperature of a fuel cell and heat engine ... 25
Figure 10 : Energy conversion comparison (Batteries, IC Engines, SOFC) ... 25
Figure 11: Gransey’s Growth Model ... 35
Figure 12: PEM Fuel cell power plant cost breakdown... 43
Table 1: Worldwide installed capacity (GW) by 1 January 2000... 11
Table 2: Cost of electricity... 15
Table 3: Distributed energy capabilities and system interfaces... 16
Table 4: Summary of Cost and Performance Parameters for Distributed Generation Technologies ... 16
Table 5: The list of current and potential applications for fuel cell... 28
Table 6: Installed cost and efficiency numbers in the past and in the future... 44
Acknowledgement
I have received support and guidance from several individuals during the course of this thesis. I am grateful to my advisor Steven R Connors for his many useful comments and insights throughout my research. I am also thankful to Prof. James Utterback and Prof. Elicia Maine for providing several interesting research discussions on the subject of fuel cell firm’s growth and trends in the fuel cell industry. I thank my friend David Tsay with whom I had several stimulating discussions on various topics related to fuel cells throughout the year.
I would like to thank Roberto Cordaro (Nuvera fuel cells), Michael Hsu (ZTek), Radha Jalan (Electrochem), Gary Mook (Acumentrics), Paul Osenar (Protonex), Scott Rackey (CellTech Power), Roger Saillant (Plug Power), Walter (Chip) Schroeder (Proton Energy Systems) for participating in my research and providing inputs without which this research would not have been possible.
CHAPTER 1
INTRODUCTION:
Throughout the history of the US, new enterprises have been important sources of technological innovation and business development. The formation and growth of new enterprises has been studied extensively in various industries. This thesis is focused on investigating enterprises in the emerging area of Fuel Cells.
Unlike in the Clay Christensen book on ‘Disruptive Technologies’ where he describes that almost all disruptive technologies start with a product which is inferior in performance and low cost compared to the technology it is going to displace, Fuel Cells may not strictly fall under this definition because, to start with, Fuel Cells are more expensive and in certain performance metrics better than the existing distributed energy sources or grid electricity. Under these circumstances can the industry still evolve and take off? If so, does it need new business models which are different from the traditional industry structure that exists now? Is there something unique to this industry that will aid or prevent it from taking off?
The present research involves identification of a sample of eight Fuel Cell manufacturing firms and conduct interviews with the top management to understand the growth of their company and the issues facing the industry. A questionnaire, which is the focus of each interview, has been adapted from a similar study done earlier on a different industry by Prof. Elicia Maine of Simon Fraser University. It elicits information on the formation and growth of the enterprise in the following categories: the Entrepreneur’s background, local influence on growth, growth models for these new technology based firms, firm’s growth history, Intellectual property protection and supplementary section dealing with the future trends. The results of the questionnaire are analyzed in an effort to discover success factors in the growth of the Fuel Cell industry.
MOTIVATION:
There are few examples of successful technological innovations that do not build on some predecessor market and technology – although the source market and technology are often quite distinct from one another. The automobile built on the steam engine and the horse and buggy, the telephone built on the telegraph, which built on the postal service. The personal computer replaced the word processor, which replaced the typewriter. The Edison light emulated and replaced gas lamps and candles. New technologies are typically brought to market emulating existing products and services in order to capture the imagination and attention of consumers. The emulated market or industry may see its absolute demise only if the new technology can best the old in most every salient performance metric at a better price, and if it is truly innovative it can eventually replace the old paradigm with an entirely new, hopefully more expansive, one. For example, many of us first used a PC primarily to do word processing, which it does better than its predecessors, but the PC would hardly be described as just a word processor today. It was this dynamic that had motivated me to take on this topic for my thesis, to further understand the technology, which I was quite familiar with, in the broader context of history and the present
My curiosity also stems from the need to understand how the new technologies get adapted and how the early stages of evolution of a new industry is shaped by the players in the industry. This study will shed some light on the different possibilities in the industry direction and an understanding of some of the challenges facing Fuel Cell manufacturing companies.
OBJECTIVES
There are several objectives to be met in the course of this research. The primary objective is to expose the author to a series of enterprises and entrepreneurs that deal routinely with the business and management issues that have been raised in the course of study at the MIT-Sloan School. The comprehensive nature of the questionnaire allows the interviewer to review most of the major business issues that each entrepreneur has faced.
The study is focused on the Fuel Cell industry in an effort to expand on the author’s experience in this industry and to investigate the role of new enterprises in relation to other efforts (by government, by established industry for complementary innovations, and by customers) in this emerging technology.
There is a great opportunity for innovation within this changing industry; thus, it provides a good framework for analyzing the sources and diffusion patterns of innovations developed by these new enterprises. I would start with describing the major trends affecting the energy industry in general and a brief outline about the distributed generation before analyzing the growth of Fuel Cell firms.
CHAPTER 2
INTRODUCTION
:I would like to start with the fact that the lack of access to electricity is a key factor in perpetuating poverty around the world. Conversely, access to energy means more economic opportunity. In South Africa, for example, for every 100 households electrified, 10 to 20 new businesses are created1. Electricity frees human labor from day-to-day survival tasks.
MAJOR TRENDS AFFECTING THE ENERGY INDUSTRY:
Ever since Colonel Drake drilled the first true oil well in the state of Pennsylvania in 1859, the ability of oil and natural gas to power electric generation plants, transportation and industry has created both immense economic advances and significant controversy. Many times it has been assumed that the world would quickly run out of oil. In 1939, and again in 1951, the U.S. Department of the Interior warned that all the world’s oil reserves totaled only enough to fuel the Earth’s nations for about 13 years. In fact, rather than becoming scarcer over time, energy has become much more plentiful. Throughout the history of the energy industry, prices have become lower and lower on an inflation-adjusted basis, while a combination of advancing technologies, determined scientists, exploration firms and utility companies have exponentially expanded the total amount of energy and reserves available for consumption.
In 1892, Thomas Alva Edison established the Pearl Street Station in New York City – the world’s first central electric power station. Today, America is the world’s great energy hog. During 2000 alone, energy consumers in the U.S. spent over $300 billion on electricity and natural gas bills, about one-half of which was for commercial and industrial use. Hundreds of billions more was spent on fuel used by automobiles, trucks, trains and aircraft. There is no end in sight to the appetite for power and fuel. In contrast, as much as one-third of the world’s population either has no access to, or cannot afford, a steady supply of electricity.
Among the major trends shaping the energy industry today are the following: 1) Deregulation of the electric power industry.
2) Continuing global dominance of multi-national oil companies
3) Rapid advances in technology, leading to declining costs for oil and natural gas exploration and production.
4) While energy research & development is lagging, venture capital is slowly nurturing new technologies.
5) Extension of offshore drilling into extreme water depths. 6) Mergers and consolidation.
7) OPEC vs. the global low commodity price environment.
8) Rising demand, new methods and natural gas power growth at electric utilities. 9) In the U.S., a rapidly growing reliance on imported oil to serve growing consumption. 10) Conservation and alternative energy sources are back.
11) Tight energy markets and high demand for investments. 12) Exponential growth in energy trading via e-commerce.
13) Superconductivity comes of age.
14) The industry takes a second look at nuclear power.
The present study is focused on alternative energy sources in the distributed generation. More narrowly the study will be focused on Fuel Cell industry, its growth and trends.
DISTRIBUTED GENERATION OVERVIEW:
As the electric utility industry continues to restructure, driven both by rapidly evolving regulatory environments and by market forces, the emergence of a number of new generation technologies also profoundly influences the industry’s outlook. While it is certainly true that government public policies and regulations have played a major role in the rapidly growing rate at which distributed generation is penetrating the market, it is also the case that a number of technologies have reached a development stage allowing for large-scale implementation within existing electric utility systems.
Since the beginning of the twentieth century, the backbone of the electric power industry structure has been large utilities operating within well-defined geographic territories and within local market monopolies under the scrutiny of various regulatory bodies. Traditionally, these utilities own the generation, transmission and distribution facilities within their assigned service territories; they finance the construction of these facilities and then incorporate the related capital costs in their rate structure which is subsequently approved by the relevant regulatory bodies. The technologies deployed and the siting of the new facilities is generally also subject to regulatory approval.
Three major types of power plants have been constructed primarily: 1) Hydro, either run-of-the-river facilities or various types of dams. 2) Thermal, using fossil fuel either coal, oil, or gas.
3) Nuclear (Thermal using nuclear fuel).
Until the end of the twentieth century, other generation technologies only had an incidental impact. The table below shows the installed capacities on a worldwide basis at the end of the twentieth century.
Table 1: Worldwide installed capacity (GW) by 1 January 2000.
(Source: Energy Information Administration)
Region Thermal Hydro Nuclear Other/Renew Total
North America 642 176 109 18 945
Central & South America 64 112 2 3 181
Western Europe 353 142 128 10 633
Eastern Europe & Former USSR 298 80 48 0 426
Middle East 94 4 0 0 98
Africa 73 20 2 0 95
Asia and Oceania 651 160 69 4 884
Total 2,175 694 358 35 3,262
As we look into the future, all three technologies mentioned above have their own set of problems associated with them.
Hydro: Given their friendly (though many might argue against it) environmental impact, hydro
power plants are most often the preferred generation technology wherever and whenever feasible. However, the identification of feasible new sites in highly industrialized countries is becoming increasingly difficult. In highly developed countries, where the cost-attractive traditional hydro facility sites have been almost entirely built, some power plants could be, and are, reconfigured to become pumped-storage facilities. On the other hand, while hydro electric power production is saturating within industrialized countries, it represents very significant development opportunities in several developing regions of the world. While hydro power plants do not create any pollution related to their daily operation, they do bring significant environmental and often societal upheaval when they are constructed. Recently completed facilities or on-going construction projects in South America and Asia have been, and remain, at the center of controversies that go far beyond the national boundaries of their home nations.
Thermal: Even though several pollution-abatement technologies are being successfully
implemented, often at significant capital and operational costs, fossil fuel thermal power plants bring operating pollution problems that are becoming increasingly difficult to ignore. The emergence of a broad array of “green power” marketing initiatives provides yet another indication of the growing concern regarding air pollution. While some parts of the world have significant coal reserves, a growing concern is the depletion of the world’s increasingly scarce oil and gas reserves for the purpose of electricity production. Future generations will most probably need our remaining carbon resources to fulfill materials production requirements as opposed to as raw energy source.
Nuclear: Except for a few economically emerging regions of the world, it is safe to observe
that nuclear power production, using existing technologies, will decrease during the coming decades as old plants are retired and are not being replaced. Several European countries, such as Germany and Sweden, have enacted laws to accelerate the decommissioning of existing nuclear power plants. However, emerging technologies, such as the pebble bed technology, which allow for a highly standardized manufacturing of the power plants with modular installed capacities, may revive the nuclear power industry as will most probably be required within any generation mix that is free of fossil fuels.
MOTIVATION FOR DISTRIBUTED GENERATION:
As the technologies evolved, ever larger power production units were constructed allowing their operators to take full advantage of construction-cost economies of scale to provide a more cost-attractive generation mix to their customers. However, siting these ever larger facilities has become increasingly difficult. Hydro facilities must be sited as dictated by geography, even if this means displacing very large population centers and /or permanently and seriously affection the local ecology. Since it is more convenient to transport energy in its electric form, fossil thermal plants are generally sited either close to raw fuel sources or to fuel conversion/treatment facilities. The pollution concerns mentioned earlier dictate their siting far away from the
population centers. A broad range of environmental concerns mandate that nuclear power plants be located far away from population centers.
These siting issues, as well as the need to share these large power production facilities within a formalized market structure, have required the construction of large, complex, and capital-intensive electric power transmission networks. These transmission networks have become an increasing source of concern as their sustained development becomes a problem from a right-of-way point of view, and as their economic operation comes in limbo under a deregulated electric utility industry. Ecological and environmental protection concerns, as well as political pressure, also often mandate that new transmission facilities be constructed underground, which even further compounds the issue by imposing often unbearable construction cost impediments.
As the industry enters the competitive arena, fewer and fewer corporations are capable of taking on the financing of the construction of large electric power plants at costs far exceeding a billion dollars. Under the present economic and investment climate, with its almost exclusive focus on short-term results, the justification of a multibillion dollar investment with a pay-back period measured in decades has become virtually impossible. In several industrialized countries, aggressive public policies backed by strict regulatory mandates are such that electric power production within the confines of vertically integrated utilities has most probably been relegated to the past, while a true highly diversified electric power production industry is the future.
The increase market penetration of distributed generation has also been the advent of an electric power production industry. Many, if not most, of the players in this industry are not traditional electric utilities; in fact, several of these new players actually are spin-offs of the traditional utilities. Electric power production facilities that do not belong to electric utilities are referred to as non utility generators (NUGs). The rapid emergence of NUGs is illustrated by the fact that, starting during the early 1990s, more generation capacity is added each year in the United States by NUGs than by traditional utilities. NUGs represented 5% of the installed generation capabilities in the United States at the beginning of the 1990s; by the end of the decade, the proportion had grown to 20% as it grew from less than 40 GW to more than 150 GW. These statistics also take into account the fact that several large electric utilities have actually spun off their generation capabilities within separate corporate entities, while they have remained as what has now been referred to as “wire companies”.
I believe that the acceleration in the broader adoption of distributed power sources would be mainly due to the robust growth in the power consumption (driven by the emergence of the digital economy as illustrated in figure 1), heightened reliability requirements, deregulation, environmental legislation and increasingly stringent government regulation of vehicle and their emissions.
DISTRIBUTED GENERATION:
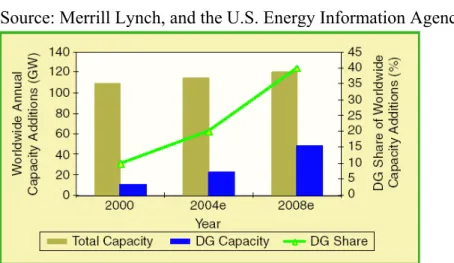
The transformation of the U.S. electricity market has created an opportunity for distributed generation (DG), or sub-5MW power production, near the point of need. DG applications include powering remote locations, resource recovery, backup generation and grid-parallel power production. The market drivers for the growth of DG market are the digital economy, transmission and distribution issues, deregulation, reliability, and air quality. Figure 2 below shows the anticipated growth in this sector.
Figure 2 : Distributed generation market growth.
technologies can immediately address this imbalance through rapid deployment at the point of need.
Transmission and Distribution: A congested and aging grid further constraints supply and
makes it difficult to deliver power to the final consumer. Siting power lines can be almost as troublesome as building new plants. Finally, losses during transmission add to the cost of centralized distribution and reduce efficiency. DG technologies offer the potential to circumvent the troublesome grid entirely.
Deregulation: Much of the underinvestment in both generation and distribution infrastructure
grew out of the uncertain market environment spawned by deregulation. Deregulation has also supported growth of DG by allowing for “peak shaving,” or the employment of onsite generation assets during times of peak energy demand, and “net metering,” which is the selling excess energy back into the grid for a credit.
Reliability: High-quality, reliable power with essentially no downtime has become a necessity
for many commercial and industrial enterprises. The unreliable nature of grid-delivered power has caused many consumers to look at distributed generation as a primary power source while simultaneously stimulating investments in backup power generation.
Air Quality: Increasing stringent air-quality standards have stalled new central power plant
construction and limited installation of diesel generators, or “gensets,” for backup power. Clean alternative energy solutions have emerged as environmentally friendly alternative and opened new market opportunities. Chart below shows the additional external or social cost of electricity due to environmental effects.
Table 2: Cost of electricity
(Sources: International Atomic Energy Agency, ExternE, and Wind Power Monthly, The Wall Street Journal, 27 Aug. 2002)
Resource Generation Cost (c/kWh) External Cost of Generation (c/kWh)*
Coal 3.11-3.41 1.94-14.6
Gas turbine 2.53-3.41 0.97-3.89
Nuclear 3.31-5.74 0.19-0.58
Good wind site 5.84 0.05-0.24
Optimal wind site 3.89 0.05-0.24
* The estimated costs to society and the environment due to their operation, not including nuclear waste and decommissioning costs
Various distributed generation technologies & summary of cost and performance
Some of the distributed generation technologies, its costs, performance and its capabilities are listed in the two charts below. Distributed generation places electricity generation close to the point of need and bypasses the expensive and unreliable transmission and distribution network. Distributed generation consists of relatively small power generation, usually less than 5MW. Cambridge Energy Research Associates (CERA) sizes the global distributed generation market, excluding backup power, at more than 13,000 MW and projects it to grow at approximately 5% annually. The DOE estimates that distributed generation could account for more than 20% of domestic capacity additions by 2020, or between 36-78GW.
Table 3: Distributed energy capabilities and system interfaces
Technology Typical Capability Ranges Utility Interface
Solar, photovoltaic A few W to several hundred kW dc to ac converter Wind A few hundred W to a few MW Asynchronous generator Geothermal A few hundred kW to few MW Synchronous generator Ocean A few hundred kW to few MW Four-quadr. Synchronous
machine
ICE A few hundred kW to tens of MW Synchr. Generator or ac to ac converter
Combined cycle A few tens of MW to several hundred
MW Synchronous generator
Combustion turbine A few MW to hundreds of MW Synchronous generator Microturbines A few tens of kW to a few MW ac to ac converter Fuel cells A few tens of kW to a few tens of MW dc to ac converter
Table 4: Summary of Cost and Performance Parameters for Distributed Generation Technologies
CRITERIA FOR SUCCESS OF DISTRIBUTED GENERATION
Despite the many advantages of distributed power generation, its success depends largely on a number of factors. In addition to government policies, these factors include capital costs, ease of installation and reliability concerns. The following points explore the more critical requirements:
Generators With Very High Reliability
The use of numerous engines raises the concern of higher maintenance costs. Many small engines scattered over a large neighborhood are more troublesome to service than a large engine found at a single point. Moreover, private companies (Non DG) that own distributed generators are unlikely to have the skill and expertise required for service and repair. This makes very high reliability one of the main requirements for distributed power generation.
Low Introductory and Installation Costs
Investment costs determine the rate at which distributed generation is able to gain in acceptance and market share. Due to concerns over funding and quick profitability, privately owned power generators must have low introductory and installation costs.
Interconnect Installation and Operation Costs
A network of wires is used to link power stations and their customers. This is known as the electrical grid. The connection between this grid and distributed power generators is a significant barrier to distributed power generation. Engineers refer to such connections as the distributed generation technology interface [DGTI]. The installation and operation costs of these
connections need to be lowered.
Sociological Factors
For distributed power systems to become popular, the public needs to be comfortable with having power generators sited in their homes and work places. The common notion of a noisy and heavily polluting power station has to be addressed. In the past, construction of overhead transmission lines has been shown to trigger public outcries. This highlights the significance of sociological issues
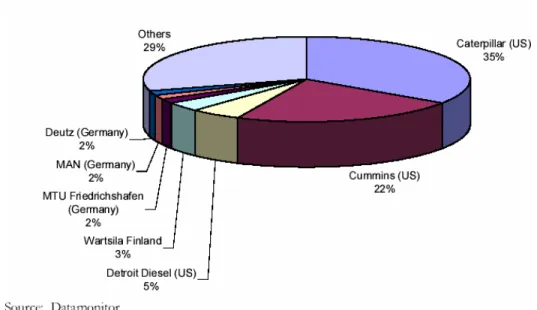
COMPANIES CURRENTLY DOMINATING THE DG MARKET:
If we look at the present market share among distributed generation system manufacturers, Caterpillar and Cummins together have about 60 % market share. This is important because some respondents to the questionnaire felt that there will be a distributed generation industry rather than a fuel cell industry. It remains to be seen if Caterpillar and Cummins will remain the leaders and capitalize on their market dominance when Fuel Cells enter the commercialization phase or whether another company is going to emerge, taking Fuel Cells as the lead source of distributed generation.
Figure 3: Distributed generation Market Share (Revenues)
Figure 4 : World Order for Generation Equipment
CHAPTER 3
BASICS OF FUEL CELL TECHNOLOGY
A fuel cell is an electrochemical device that produces electricity by separating the fuel (generally hydrogen gas) via a catalyst. The protons flow through a membrane and combine with oxygen to form water – again with the help of a catalyst. The electrons flow from the anode to the cathode to create electricity. As long as the reactants – pure hydrogen and oxygen – are supplied to the fuel cell, it will produce electrical energy.
A single fuel cell is basically a piece of plastic between a couple of pieces of carbon plates that are sandwiched between two end plates acting as electrodes. These plates have channels that distribute the fuel and oxygen.
A factor that draws interest to the fuel cell stack is that it can operate at efficiencies two to three times that of the internal combustion engine, and it requires no moving parts. Since it converts the fuel, hydrogen, and oxygen directly to electrical energy, the only by-products are heat and water. Without combustion, hydrogen fuel cell systems are virtually pollution free.
Although hydrogen is the most common fuel used to power a fuel cell, research is being done on a new type of fuel cell that operates using methanol (without using a reformer to convert it to hydrogen) and oxygen. However, this type of fuel cell remains in the early stages of development.
HISTORY OF FUEL CELLS:
As early as 1839, Sir William Grove (often referred to as the "Father of the Fuel Cell") discovered that it may be possible to generate electricity by reversing the electrolysis of water. It was not until 1889 that two researchers, Charles Langer and Ludwig Mond, coined the term “fuel cell” as they were trying to engineer the first practical fuel cell using air and coal gas. While further attempts were made in the early 1900s to develop fuel cells that could convert coal or carbon into electricity, the advent of the internal combustion engine temporarily quashed any hopes of further development of the fledgling technology.
Francis Bacon developed what was perhaps the first successful fuel cell device in 1932, with a hydrogen-oxygen cell using alkaline electrolytes and nickel electrodes – inexpensive alternatives to the catalysts used by Mond and Langer. Due to a substantial number of technical hurdles, it was not until 1959 that Bacon and company first demonstrated a practical five-kilowatt fuel cell system. Harry Karl Ihrig presented his now-famous 20-horsepower fuel cell-powered tractor that same year.
Also in the late 1950s, NASA began to build a compact electricity generator for use on space missions. NASA soon came to fund hundreds of research contracts involving fuel cell technology. Fuel cells now have a proven role in the space program, after supplying electricity to several space missions. Appendix E show the pictorial representation of the history of Fuel cells.
FUEL CELL TECHNOLOGY
Unlike electrochemical batteries, which use chemical reactions to both store and discharge electricity, fuel cells generate electricity from hydrogen fuel. Haul around enough fuel, and the fuel cell will power an electric vehicle as far as the motorist wants to drive or power a home as long as needed.
A fuel cell consists of two electrodes: a positive electrode called an anode and a negative electrode called a cathode. Pure hydrogen gas - or hydrogen extracted (or reformed) from a hydrocarbon fuel such as methanol or gasoline - together with oxygen is fed into the cell. A catalyst at the anode (usually based on a platinum-family element) causes hydrogen atoms to give up their negatively charged electrons, leaving positively charged protons. Negatively charged oxygen ions (from ionized oxygen gas) at the cathode side attract the hydrogen protons. As the protons pass selectively through a semi permeable solid electrolyte membrane (in the most common fuel-cell type), the remaining electrons are redirected to the cathode by way of an external circuit, thus producing current that powers an electric motor. The electrons combine with the hydrogen protons and oxygen ions at the cathode forming the fuel cell's major byproduct, water. The other principal end-product is heat, which can be captured and reused, or released. Because a single cell generally produces only a few volts, fuel cells are typically piled into "stacks" to generate more useful voltage. The exhaust emissions of a pure hydrogen fuel cell are clean, but the extraction of hydrogen from hydrocarbon fuels in reformer systems does release some atmospheric and other pollutants.
TYPES OF FUEL CELLS
Alkaline fuel cells - AFC1. Alkaline fuel cells were first used in the Gemini-Apollo space program to produce drinking water and electrical energy.
2. Operate on compressed hydrogen.
3. Alkaline fuel cells generally use a solution of potassium hydroxide (chemically, KOH) in water as their electrolyte.
4. Output of alkaline fuel cell ranges from 300 watts (W) to 5 kilowatts (kW).
Direct methanol fuel cells - DMFC
1. Direct methanol fuel cells use methanol instead of hydrogen.
2. Operating temperatures of direct methanol fuel cells are in the same range as PEM fuel cells – 50 to 100°C (122 to 212°F).
3. Direct methanol fuel cells are being considered for use in the transportation industry.
Molten carbonate fuel cells - MCFC
1. Molten carbonate fuel cells use a liquid solution of lithium, sodium, and/or potassium carbonates soaked in a matrix.
2. Units with output up to 2 megawatts (MW) have been constructed, and designs exist for units up to 100 MW.
3. The nickel electrode-catalysts of molten carbonate fuel cells are inexpensive compared to those used in other cells, but the high temperature also limits the materials and safe uses of MCFCs.
Phosphoric acid fuel cells - PAFC
1. Phosphoric acid fuel cells use phosphoric acid as the electrolyte to make electricity.
2. Efficiency ranges from 40 to 80 percent and operating temperature is 150 to 200° C (about 300 to 400° F).
3. Existing phosphoric acid cells have outputs up to 200 kW, and 11 MW units have been tested.
Proton exchange membrane fuel cells - PEM
1. PEM fuel cells are the most common type of fuel cell being developed for transportation use. 2. They operate at the one kW per liter of volumetric powered level at a temperature under 100°C (212 °F)
4. PEM fuel cells react quickly to changes in electrical demand and will not leak or corrode. 5. PEM fuel cells use relatively inexpensive manufacturing materials (plastic membrane).
Regenerative fuel cells – RFC
1. Regenerative fuel cells separate water into hydrogen and oxygen by a solar-powered electrolyser.
2. Hydrogen and oxygen are fed into regenerative fuel cells, generating electricity, heat and water.
3. Water is then re-circulated back to the electrolyser of the regenerative fuel cell and the process repeats.
Solid oxide fuel cells - SOFC
1. Solid oxide fuel cells use a hard, ceramic compound of metal (like calcium or zirconium) oxides (chemically, O2) as electrolyte.
2. Output for solid oxide fuel cells is up to 100 kW.
3. Reformer is not required to extract hydrogen from the fuel due to high temperature.
Figure 6 : Fuel Cell comparisons based on applications
FUEL CELL VALUE CHAIN:
PEM Fuel Cell value chain2 shown in the diagram below depicts the fuel cell industry as a whole where significant value can be added in the various segments in the chain.
Figure 7 : Fuel Cell Value Chain
FUEL CELL VERSUS CARNOT EFFICIENCY
The theoretical thermodynamic derivation of Carnot Cycle shows that under ideal conditions, a heat engine cannot convert all the heat energy supplied to it into mechanical energy; some of the heat energy is rejected. In an internal combustion engine, the engine accepts heat from a source at a high temperature (Th), converts part of the energy into mechanical work and rejects the
remainder into a heat sink at a low temperature (Tc). The greater the temperature difference
between source and sink, the greater the efficiency. Basic Material & component supply Fuel cell Manufacture Fuel cell Stack Assembly Power Plant Assembly Repairs and Maintenance Recycling 1. Research & Product development 2. Fuel cell stacks 3. Air delivery systems 4. Fuel storage units 5. Fuel delivery systems 6. Cooling systems 7. Electrical systems 8. Control systems 9. Drivetrains (Vehicles) 10. Testing equipment. 1. Research & Product development 2. Fuel Cells 3. Trays 4. Testing Equipment 1. Research & Product development 2. MEA’s 3. Electrolyte 4. Catalysts 5. Bi-Polar plates 6. Testing Equipment 1. Research & Product development 2. Diagnostics 3. Equipment 4. Shop supplies 5. Replacement parts 6. Refurbished parts 1. Research & Product development 2. Collection depots 3. Dismantling 4. Facilities 5. Resell 6. Infrastructure 1. Research & Product development 2. Aluminum 3. Steel 4. Plastics 5. Platinum 6. Wiring 7. Membranes 8. Electrodes
Maximum efficiency (Carnot),
Note: the temperatures Th and Tc are in degrees Kelvin.
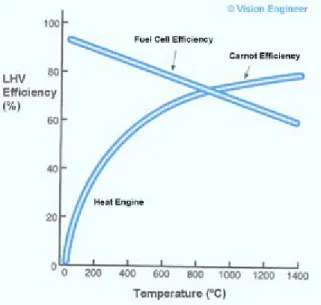
Because fuel cells convert chemical energy directly to electrical energy, this process does not involve conversion of heat to mechanical energy. Therefore, fuel cell efficiencies can exceed the Carnot limit even when operating at relatively low temperature, for example, 80ºC.
The diagram below is a graphical illustration of energy conversion processes from chemical energy in fuels to electrical energy:
Figure 8 : Energy Conversion of Fuels
There are 2 ways in converting chemical energy to electrical energy: green route and orange route.
The orange route is a general route for combustion process plus electricity generation in vehicles and power stations that use fossil fuels. The green route is for fuel cells. Fuel cell generates electricity by electrochemical reactions. It bypasses the thermal and mechanical energies conversions, hence are more efficient.
The theoretical efficiency of a fuel cell is related to the ratio of two thermodynamic properties, namely the chemical energy or Gibbs energy (dG0) and the total heat energy or Enthalpy (dH0) of the fuel.
Fuel cell efficiency,
The variation of hydrogen fuel cell theoretical efficiency versus Carnot efficiency is shown in the figure 9 below:
Figure 9 : Relative theoretical efficiency change with temperature of a fuel cell and heat engine
The hydrocarbon fuels have much higher energy density than batteries which is shown in the diagram below.
FUEL CELL SYSTEMS FOR DISTRIBUTED POWER GENERATION:
Fuel cell technology holds the promise to produce electricity at local sites from a wide range of fuels, and with high efficiency. Most types of fuel cells operate on hydrogen fuel, but this hydrogen can be produced from natural gas, liquid hydrocarbon fuels including biomass fuels, landfill gases, water and electricity (via the process of electrolysis), biological processes including those involving algae, and even from coal. Fuel cells are being proposed for use in powering electric vehicles, providing remote power for buildings and communication facilities, providing power as distributed generation (DG) in grid-connected applications (as either primary power or backup power), and for small electronic devices such as laptop computers and cell phones.
One principal attraction of fuel cell technology, as evidenced by this diverse array of potential applications, is that fuel cells can produce power with high efficiency in a wide range of system sizes. This feature is a function of the modular design of fuel cell systems (where individual cells are compiled into “stacks” to achieve higher voltage and power levels), as well as the fuel cell operating principle that allows electricity to be produced without combustion. There are several potential operating methods for using both stationary fuel cells and fuel cell vehicles (FCVs) as distributed generation resources. These systems could be used to:
1. Produce power to meet the demands of local loads;
2. Provide additional power to the grid in a net-metered or electricity buy-back scenario, helping to meet demands in times of capacity constraints;
3. Provide emergency backup power to residences, offices, hospitals, and municipal facilities; 4. Provide “peak shaving” for commercial sites, reducing demand charges;
5. Provide ancillary services to the grid, such as spinning reserves, grid frequency regulation, power quality support, reactive power, and possibly other services;
6. Provide buffering and additional power for grid-independent systems that rely on intermittent renewables.
Net Metering of Fuel Cell Systems:
There are two basic means by which commercial fuel cell systems could be net metered. First, they could be net-metered in a manner analogous to current net-metering programs, whereby overall billing would be assessed on a monthly or annual basis and the customer could have a zero balance, a negative balance, or in the case where credit is awarded to net excess generation, even a positive balance. One argument against including fuel cell systems in these traditional net metering programs is that while PV and wind systems tend to have peak availability in the daytime and afternoon periods, coincident with the gird peak, much excess fuel cell power may be available off-peak, when the grid is running mainly from base load power plants. However, net metering policies could be designed to work in conjunction with “real time” electricity meters that are currently being installed at many commercial sites to allow excess generation to only be credited at peak hours of the day when the grid is employing peak power plants. In theory, use of fuel cell systems in this way could reduce the need to operate peak power plants and to construct new ones to meet peak demand growth. For this reason, the excess fuel cell power added to the grid is only credited for net metering during hours that coincide with the overall grid peak power demand, rather than at any time during the day or night.
A second type of net metering is “short term” net metering, where the fuel cell system is connected in parallel with the utility grid and relies on grid power to take up the transients in the commercial or residential load. If the fuel cell system does not need to fully “load follow,” for example, a residential load that averages only 1 or 2 kW but can spike to 12-15 kW, then it can likely achieve higher efficiency. In addition, system components can be sized more optimally, backup battery systems would not be needed, and hydrogen “buffer” storage may also not be needed. This use of the utility grid to load-level the fuel cell system, whereby energy that is “borrowed” from the grid to take up transients is then “repaid” with gradual fluctuations in fuel cell power over a 15-30 minute period of time, could significantly improve the economics of fuel cell system operation.
At certain settings net metering may improve the economics of using small fuel cells for distributed generation because it would allow fuel cell operation to be better optimized for high efficiency that is possible with load-following operation. This may be particularly true for the case of FCVs being used to generate power while they are parked at residential settings, due to the fact that the fuel cell systems in the vehicles have been optimized for use as vehicle power, and may not be particularly well suited to powering small building electrical loads. Net metering of these systems may therefore play an important role in allowing the systems to be used in a manner where higher efficiency operation is possible that in the absence of a net-metered operational strategy.
Fuel Cell Benefits:
Fuel cell power offers many benefits like;
1. Cleaner, quieter and more efficient power production than conventional internal combustion engines (ICEs)
2. Operating efficiencies at part load and in all size configurations
3. Few moving parts and thus an anticipated high degree of reliability, lower maintenance and long operating life
4. Modular design, offering flexibility in size and efficiencies in manufacturing 5. Use of multiple fuels, such as hydrogen, natural gas, methanol and gasoline 6. Zero or low emissions, depending on the fuel used.
7. Use in combined heat and power purposes, further increasing the efficiency of energy production.
Table 5: The list of current and potential applications for fuel cell3
Stationary Uses Portable Uses (Including
micro) Transportation Uses
1. Distributed power 2. Off-grid power (uninterruptible) 3. Back-up generator power 4. Co-generation power and heating 5. Cellular telephone towers 6. Data centers 7. Emergency standby • Hospitals • Fire Stations • Airports 8. Building self-generation 9. Residential • Individual homes • Subdivisions 10. Remote industrial operations • Mines • Portable mills
11. Peaking application for grid 1. Small generators • Military • Cottages • Worksites 2. Camping 3. Film industry 4. Off-grid power (uninterruptible) 5. Power tools 6. Laptop computers 7. Cellular phones 8. Personal digital assistant 9. Camera equipment 10. Toys 11. Road signs 12. Wheelchairs 13. Lawnmowers 14. Watches 15. Medical devices • Hearing aids • Neurological
16. Embedded power for miniature devices 1. Buses • School • Transit • Fleet 2. Automobiles
• Fleets (taxi, municipal, military)
• Personal Auxiliary Power units
3. Trucks (light, medium, and heavy) 4. Motorcycles and scooters 5. Locomotives 6. Marine craft • Commercial • Personal 7. Recreation vehicles • ATVs • Snowmobiles 8. Golf Carts 9. Fork lifts 10. Underground mining and tunneling vehicles
Fuel cells will likely be used in certain applications sooner than others. Initial uses will be in markets requiring reliable and secure forms of power where users are prepared to pay a premium, or where the cost of alternatives is already high. As production costs drop and miniaturization technology improves, fuel cells will power an increasing number of consumer applications.
CHAPTER 4
INNOVATION AND DIFFUSION:
In order for society to capture the benefits of technological innovation the new technology must be transferred or diffused to the marketplace. This diffusion phenomenon has been studied elsewhere in an effort to determine the characteristics of an innovation that affect its rate of diffusions. One key characteristic for innovations in the energy industry is the depth of the innovation, or the amount of change to the status quo caused by the innovation. In the energy industry the depth of innovation is measured in relation to existing markets. For example, in 1973 no market existed for terrestrial solar photovoltaic (PV) systems. This innovation required the development of new applications and new markets and can be classified as having great innovation depth. Similarly Fuel Cells have a potential for having great innovation depth.
The performance of new business ventures will be affected by the magnitude of the innovation that it seeks to diffuse. The decision to serve existing markets or to establish new markets will, therefore, have a significant impact on the performance of the firms. Similarly, other innovation characteristics, such as cost-effectiveness and breadth of the innovations (number of users affected by the innovation) will also be investigated.
LIFE CYCLES FOR INNOVATION AND PRODUCT DEVELOPMENT:
The time required to transform new technical information into a well diffused innovation is an important factor for new technical ventures. The ability of the new firm to survive is tied to its ability to generate revenue within a short period. Fuel cell industry is unique in the energy industry in the sense that it has taken a very long time for the innovation to diffuse. This is because of various reasons. The innovation studies have found that a substantial lag (from 8 to 15 years) exists between the generation of new technical information and its use as an innovation4. This period includes an active research and development phase on the basic technology, a product development stage, followed by product introduction and diffusion through market.
After several years of government and private sector involvement, the diffusion of Fuel Cells remains in its earliest stages. This market appears to be developing agonizingly slow because of difficulties with the technology and bringing the overall cost down. Several studies indicate that innovative firms seeking to develop new markets for their technical innovation must commit to a long term development and diffusion process before they expect to capture the benefits resulting from their efforts. “If we can put a man on the moon then surely we can …” attitude may not work always. The new ventures that sought to develop the Fuel Cell technology and market with one or two year of government or private funding is not true anymore.
620-Energy is a commodity today (unless we come up with ideas to de-commoditize). The essential attribute of a commodity is price. Thus, the diffusion of energy innovations is dependent on the cost-effectiveness of the innovation in relation to other available energy options. For most energy innovations life cycle costs which incorporate the first costs and operating costs (or savings) are the only true measure of cost-effectiveness. This greatly complicates the energy innovation pricing and leads to consideration of product life estimates and consumer discount rates.
RESEARCH METHODOLOGY:
The research methodology employed in this work closely follows the paper by Gransey5 on the theory of the early growth of the firms. In particular, the interview and questionnaire technique were adapted to incorporate the ideas in the above paper.
SAMPLE SELECTION:
The initial task faced in this analysis was to develop a list of Fuel Cell Manufactures and experts in New York, Connecticut and Massachusetts. Company names were collected from a number of sources and personal contacts. Since there were not many companies (less than about 20) involved in the manufacturing of Fuel Cells in the above mentioned states, most of the information was available online. Ten companies were short listed from the information gathered earlier.
The ten companies consisted of firms that were involved in the manufacture of stationary fuel cells in the range of 1kW to 50 kW and in one case higher than 50kW. These firms were contacted with an introductory email explaining the nature of the study and subsequently a personal interview was arranged with the Founders, President & CEO or CTO of the companies.
INTERVIEW AND QUESTIONNAIRE:
The interview, which normally ran for one to two hours, were structured in such a way as to insure completion of the questionnaire (Appendix A) and informal enough to allow the interviewee to relate all aspects of the venture formation and growth. The entrepreneurs were a fascinating group, quite willing to relate their experience in this format. Their thoughts ranged from the present and past issues of the company and thoughts about the future of this technology and their predictions. The questionnaire has various sections related to company background information, local industry & research labs influence on company’s growth, various growth phases of the company and critical events during their growth, founder’s experience, financing, firms growth history and intellectual property
GEOGRAPHIC LOCATION:
The Landmark publication of Krugman (1991) and Porter (1990) focused debates in economic geography and business policy on the factors affecting industrial agglomeration and the productivity of national industries and provided critical frameworks for thinking about these issues. Porter’s analysis of national industrial clusters (1990, 1998) has formed the cornerstone of strategy research on the role of the location. In this view, highly competitive local conditions
and policies that support continuous upgrading promotes competitive advantages among the set of firms within a cluster.
RESEARCH FINDINGS:
Interviews were conducted with the nine firms highlighted in the list of Potential Respondents in Appendix G. The interview sample contained both new enterprises and new internal ventures initiated within a large organization to serve newly developing markets.The interviewed firms were all Fuel Cell manufacturing companies in the three states of Massachusetts, New York and Connecticut. There is diversity in terms of different fuel cell technologies adopted by these firms in the study.
SECTION 1: Company and Entrepreneur’s Background
Eight new enterprises were interviewed during the course of this study and backgrounds of these entrepreneurs were investigated. The most significant element of these entrepreneur’s background is the technical expertise that they bring to their new ventures. This is not totally unexpected considering the highly technical nature of the businesses. The length of the time these people were with the company range from 1 year to 19 years.
SECTION 2: Local Influence on Growth
This section dealt with the questions related to the local influence (facilities & infrastructure) on the growth of these firms. It was found that the involvement of these companies with the industry associations activities locally were very minimal and also the presence of the local universities and research labs was not perceived as very important to their growth.
Chart 1:
Importance of local presence of
the following (Q2)
8 7 6 5 4 3 2 1 V al ue ( S ca le 1 -10 ) 12 10 8 6 4 2 0 University Research Lab R&D capabilities of large firmsTo the question of the importance of the local presence of the supporting organizations & establishments like the venture capitalist, legal firms, accounting firms etc, it was found that the Angel investors, legal firms and accounting firms presence locally was important to most firms. This is shown in the graph below. Legal firms were important for patent filing and writing good contracts. Some firms outsourced the accounting function and therefore the local presence was important to them. Apart form the list mentioned in the question 3 in the questionnaire some companies felt that there is a need for the presence of other High-Tech firms locally to outsource components and do the technology transfer where ever appropriate.
Chart 2:
Importance of local presence of various firms
(Q3)
Firms interviewed 8 7 6 5 4 3 2 1 V al ue ( S ca le 1 -1 0) 12 10 8 6 4 2 0 Angel investors VC Legal firms Accounting firms An incubator Science ParkThe importance of these local entrepreneurial service firms to have some knowledge of Fuel Cell industry is critical for the legal firms and to a lesser extent the VC’s and the accounting firms as shown in the chart 3 below.
Chart 3:
Importance of various firms understanding of technology (Q4)
Science Park Incubator Acct firms Legal Firms VC Angle investor M ean ( sc a le 1-10) 8 7 6 5 4 3 2 1
To the question (Q5), if the founders of the firm lived in a remote city which did not have direct access to various resources or had a limited access would the firm have been started there, the majority of them said they would not have started. They sited various reasons such as.
1. Availability of qualified people gets limited if the location is not right.
2. It also becomes easy to find and attract talent from other high tech industries where the firms are currently located.
3. Some of them felt that the access to the financial resources would become limited if the location is a remote city.
4. Some of the companies, due to historical reasons, were located where they are currently and since they were a spin off or a division of a major company; it would not have made sense to move their location to another city which has limited access to resources.
5. Also typically the chances of founders with specific talents meeting in a city with high access to various resources including educational institution are very high compared to a remote location.
The greatest positive impact on the growth of their firms (Q6) has been strong intellectual property and an important technological innovation. The only impact other than IP that was mentioned was getting Government grants & industry partnerships. In one instance a key management individual had a greatest positive impact because the person rescued the company from going bankrupt. To a related question (Q7) of the greatest asset of their firms currently, predominantly it was intellectual property and technology as shown in the chart 4 below.
Chart 4:
Greatest asset of firms (Q7)
IP & Technology
Skilled Workers
Apart from the above one company mentioned that its strong cash position was the firms greatest asset currently in this poor economic environment. One other company mentioned that their strong asset was their leaders with strong technical knowledge, program management skills, relationship building skills, product to market skills and an extended enterprise view.
To the question of the greatest management challenge faced by these firms to date had varied responses such as
o Fundraising
o Focus and reality based thinking o Being sustained visionary
o Making products that work (Going from concept to profits)
o Transition from R&D mentality to product development mentality with customers in mind. o Serial production (move to mass production Vs a single unit production for R&D or demonstration)
o Growing and managing an R&D team from scratch.
o Selling the organization to venture capitalist because these people are making decisions based on incomplete information (which happens most of the time irrespective of the industry). o Managing people – it’s always people who are the cause of either problems or successes.
SECTION 3: Growth model for NTBF’s
This section uses Gransey’s6 model of the growth of NTBFs (New Technology Based Firms).
This mode is used here to see similarities and differences of management focus at various phases of an NTBF’s growth. Gransey’s model represents a firm’s growth path as a series of growth processes which can occur sequentially or simultaneously, and which can occur more than once in the life of a firm. For example, a hypothetical firm’s growth path, arranged sequentially, could be represented as: phase 1, phase 2, phase 5, phase 2&3, phase 4, phase 3, phase 6, and phase 7. Various phases are shown in the figure 11 below.
Figure 11: Gransey’s Growth Model
3 Generate resources 4 reinforcement Growth 2 Mobilise resources 1 Access resources 5 Growth reversal 6 Accumulation Maturity 7 Assets Time Stability Failure
All the companies interviewed agreed that their firm’s experience fits this model. All the firms except two said that they were currently experiencing phase 3. It is also interesting to note that the technology risk and market risk perceived by the firm as it moves into various phase is different. The charts 5 and 6 below depict the technology and market risks during the various phases.
Chart 5:
Technology Risk perceived in various growth
phases
Ac cum ulat ion Gr ow th R eve rsal G row th Re inf or ce ment Gener ate Res our ce Mobi lise R esour ce Ac ces s Re sour ce T ec hn olog y R is k ( M ea n, S cale 1 -10 ) 11 10 9 8 7 6 5 Chart 6:Perceived Market Risk in various growth
phases of the firms
Ac cum ulat ion G row th Rev er sa l G row th R ein forcem ent Gener ate Res our ce Mobi lis e R esour ce Ac cess Re sour ce M ar ket Ri sk ( M ea n, S ca le 1 -10 ) 8.5 8.0 7.5 7.0 6.5 6.0 5.5 5.0 4.5
buy’ does not hold here and companies realized that it is getting difficult to market these products because the fuel infrastructure is not in place, balance of plant improvement are not done at a faster pace than the fuel cell firms would like to and one other issue that was mentioned was with the bleeding edge technology the product obsolesce is very fast and since people are looking and wanting the latest technology makes it difficult for fuel cell firms to productize the technology that is already available because of the reason of obsolesce.
Since most of the firms are in phase 3 (generate resource), the analysis of the managerial expertise focused on during these three phases is described below in the charts.
Chart 7:
Firms focus during the Access Resources phase
Oper ations Produc tion Sa les Ma rkets Te chnol ogy Finan ces Allianc es St rategy M ean ( S ca le 1-10 ) 12 10 8 6 4 2 0
During the Access resources phase (First Phase in the growth) the predominant focus has been on Technology and Finance.
Chart 8:
Firms focus during Mobilise Resource phase
Oper ations Produc tion Sa les Ma rket Te chnol ogy Finan ce Allianc es St rategy M ean ( sc al e 1-10 ) 10 8 6 4 2 0
During the Mobilize resource phase (Phase 2), once again the focus has been on technology and finance. One of the categories that also got attention was alliances as compared to the phase 1. This is explained by the fact that the firms realize that it would need the efforts of other complementary industries to make the fuel cells happen.
Chart 9:
Firms focus during Generate Resources phase
Oper Produc Sa les Ma rke Tech Finan Allianc St rate M ean ( S ca le 1-10 ) 10 8 6 4 2 0
During the Generate resources phase (Phase 3) the predominant focus has been technology, finance and strategy.
SECTION 5: Founders experience
Section 5 dealt with the founder’s experience before establishing the company in terms of education and prior work experience. It was found that all the founders had higher education ranging from PhD in material science, Master’s in Engineering to a master’s degree in Management. The experience range is also pretty broad. One had converted his PhD idea into a fuel cell company where as others had experience in contract R&D, Finance, Engineering, and Operations. It was also found that at least one founder is still active in each of the eight firms that were interviewed. This shows that the industry is pretty much in its early stages. No dominant company has emerged yet.
SECTION 6: Financing
This section dealt with financing issues. Only two of the eight companies that were interviewed were public companies. Others companies are either self-funded or venture backed or Angel backed. Companies are planning to raise public money but right now the window to raise money is pretty much closed because of the downturn in the economy. Unlike just prior to the internet bubble (2000), companies are finding difficult to raise equity because the venture capitalist are looking for companies that already have revenues. This makes it a tough environment for the fuel cell industry and has been pointed out by some companies.
SECTION 7: Firm Growth History
Firm’s growth history showed a steady increase in employee and revenues, though not very substantial. There were four companies in the survey which had employees between 90 and 350. Others had substantially lower than 90 employees. As far as annual revenues are concerned none of the companies had ever crossed $20 million. Most of the revenues are from the government contracts and demonstration projects. None of the companies have been profitable because the cost of goods sold (COGS) plus the R&D expense is greater than the revenues by a considerable degree.
SECTION 8: Intellectual Property Protection
All the companies felt that the intellectual property protection is very high in importance. Most of the companies had at least a few Patents (either filed or pending).