arXiv:0911.4286v1 [hep-ex] 22 Nov 2009
Measurement of the t¯
t
cross section using high-multiplicity jet events
V.M. Abazov37, B. Abbott75, M. Abolins65, B.S. Acharya30, M. Adams51, T. Adams49, E. Aguilo6, M. Ahsan59, G.D. Alexeev37, G. Alkhazov41, A. Alton64,a, G. Alverson63, G.A. Alves2, L.S. Ancu36, M. Aoki50, Y. Arnoud14, M. Arov60, A. Askew49, B. ˚Asman42, O. Atramentov49,b, C. Avila8, J. BackusMayes82, F. Badaud13, L. Bagby50,
B. Baldin50, D.V. Bandurin59, S. Banerjee30, E. Barberis63, A.-F. Barfuss15, P. Baringer58, J. Barreto2, J.F. Bartlett50, U. Bassler18, D. Bauer44, S. Beale6, A. Bean58, M. Begalli3, M. Begel73, C. Belanger-Champagne42,
L. Bellantoni50, J.A. Benitez65, S.B. Beri28, G. Bernardi17, R. Bernhard23, I. Bertram43, M. Besan¸con18, R. Beuselinck44, V.A. Bezzubov40, P.C. Bhat50, V. Bhatnagar28, G. Blazey52, S. Blessing49, K. Bloom67, A. Boehnlein50, D. Boline62, T.A. Bolton59, E.E. Boos39, G. Borissov43, T. Bose62, A. Brandt78, R. Brock65, G. Brooijmans70, A. Bross50, D. Brown19, X.B. Bu7, D. Buchholz53, M. Buehler81, V. Buescher25, V. Bunichev39,
S. Burdin43,c, T.H. Burnett82, C.P. Buszello44, P. Calfayan26, B. Calpas15, S. Calvet16, E. Camacho-P´erez34, J. Cammin71, M.A. Carrasco-Lizarraga34, E. Carrera49, W. Carvalho3, B.C.K. Casey50, H. Castilla-Valdez34, S. Chakrabarti72, D. Chakraborty52, K.M. Chan55, A. Chandra54, E. Cheu46, S. Chevalier-Th´ery18, D.K. Cho62,
S.W. Cho32, S. Choi33, B. Choudhary29, T. Christoudias44, S. Cihangir50, D. Claes67, J. Clutter58, M. Cooke50, W.E. Cooper50, M. Corcoran80, F. Couderc18, M.-C. Cousinou15, D. Cutts77, M. ´Cwiok31, A. Das46, G. Davies44,
K. De78, S.J. de Jong36, E. De La Cruz-Burelo34, K. DeVaughan67, F. D´eliot18, M. Demarteau50, R. Demina71, D. Denisov50, S.P. Denisov40, S. Desai50, H.T. Diehl50, M. Diesburg50, A. Dominguez67, T. Dorland82, A. Dubey29,
L.V. Dudko39, L. Duflot16, D. Duggan49, A. Duperrin15, S. Dutt28, A. Dyshkant52, M. Eads67, D. Edmunds65, J. Ellison48, V.D. Elvira50, Y. Enari17, S. Eno61, H. Evans54, A. Evdokimov73, V.N. Evdokimov40, G. Facini63,
A.V. Ferapontov77, T. Ferbel61,71, F. Fiedler25, F. Filthaut36, W. Fisher50, H.E. Fisk50, M. Fortner52, H. Fox43, S. Fuess50, T. Gadfort70, C.F. Galea36, A. Garcia-Bellido71, V. Gavrilov38, P. Gay13, W. Geist19, W. Geng15,65, D. Gerbaudo68, C.E. Gerber51, Y. Gershtein49,b, D. Gillberg6, G. Ginther50,71, G. Golovanov37,
B. G´omez8, A. Goussiou82, P.D. Grannis72, S. Greder19, H. Greenlee50, Z.D. Greenwood60, E.M. Gregores4, G. Grenier20, Ph. Gris13, J.-F. Grivaz16, A. Grohsjean18, S. Gr¨unendahl50, M.W. Gr¨unewald31, F. Guo72,
J. Guo72, G. Gutierrez50, P. Gutierrez75, A. Haas70,d, P. Haefner26, S. Hagopian49, J. Haley63, I. Hall65, R.E. Hall47, L. Han7, K. Harder45, A. Harel71, J.M. Hauptman57, J. Hays44, T. Hebbeker21, D. Hedin52, J.G. Hegeman35, A.P. Heinson48, U. Heintz62, C. Hensel24, I. Heredia-De La Cruz34, K. Herner64, G. Hesketh63, M.D. Hildreth55, R. Hirosky81, T. Hoang49, J.D. Hobbs72, B. Hoeneisen12, H. Hoeth27, M. Hohlfeld25, S. Hossain75,
P. Houben35, Y. Hu72, Z. Hubacek10, N. Huske17, V. Hynek10, I. Iashvili69, R. Illingworth50, A.S. Ito50, S. Jabeen62, M. Jaffr´e16, S. Jain75, K. Jakobs23, D. Jamin15, R. Jesik44, K. Johns46, C. Johnson70, M. Johnson50,
D. Johnston67, A. Jonckheere50, P. Jonsson44, A. Juste50, E. Kajfasz15, D. Karmanov39, P.A. Kasper50, I. Katsanos67, V. Kaushik78, R. Kehoe79, S. Kermiche15, N. Khalatyan50, A. Khanov76, A. Kharchilava69,
Y.N. Kharzheev37, D. Khatidze77, M.H. Kirby53, M. Kirsch21, J.M. Kohli28, A.V. Kozelov40, J. Kraus65, A. Kumar69, A. Kupco11, T. Kurˇca20, V.A. Kuzmin39, J. Kvita9, F. Lacroix13, D. Lam55, S. Lammers54, G. Landsberg77, P. Lebrun20, H.S. Lee32, W.M. Lee50, A. Leflat39, J. Lellouch17, L. Li48, Q.Z. Li50, S.M. Lietti5,
J.K. Lim32, D. Lincoln50, J. Linnemann65, V.V. Lipaev40, R. Lipton50, Y. Liu7, Z. Liu6, A. Lobodenko41, M. Lokajicek11, P. Love43, H.J. Lubatti82, R. Luna-Garcia34,e, A.L. Lyon50, A.K.A. Maciel2, D. Mackin80, P. M¨attig27, R. Maga˜na-Villalba34, P.K. Mal46, S. Malik67, V.L. Malyshev37, Y. Maravin59, B. Martin14, J. Mart´ınez-Ortega34, R. McCarthy72, C.L. McGivern58, M.M. Meijer36, A. Melnitchouk66, L. Mendoza8, D. Menezes52, P.G. Mercadante4, M. Merkin39, A. Meyer21, J. Meyer24, N.K. Mondal30, R.W. Moore6, T. Moulik58, G.S. Muanza15, M. Mulhearn81, O. Mundal22, L. Mundim3, E. Nagy15, M. Naimuddin29, M. Narain77, R. Nayyar29, H.A. Neal64, J.P. Negret8, P. Neustroev41, H. Nilsen23, H. Nogima3, S.F. Novaes5, T. Nunnemann26, G. Obrant41, D. Onoprienko59, J. Orduna34, N. Osman44, J. Osta55, R. Otec10, G.J. Otero y Garz´on1, M. Owen45, M. Padilla48, P. Padley80, M. Pangilinan77, N. Parashar56, V. Parihar62, S.-J. Park24, S.K. Park32, J. Parsons70, R. Partridge77,
N. Parua54, A. Patwa73, B. Penning50, M. Perfilov39, K. Peters45, Y. Peters45, G. Petrillo71, P. P´etroff16, R. Piegaia1, J. Piper65, M.-A. Pleier73, P.L.M. Podesta-Lerma34,f, V.M. Podstavkov50, Y. Pogorelov55, M.-E. Pol2,
P. Polozov38, A.V. Popov40, M. Prewitt80, S. Protopopescu73, J. Qian64, A. Quadt24, B. Quinn66, M.S. Rangel16, K. Ranjan29, P.N. Ratoff43, I. Razumov40, P. Renkel79, P. Rich45, M. Rijssenbeek72, I. Ripp-Baudot19, F. Rizatdinova76, S. Robinson44, M. Rominsky75, C. Royon18, P. Rubinov50, R. Ruchti55, G. Safronov38, G. Sajot14,
A. S´anchez-Hern´andez34, M.P. Sanders26, B. Sanghi50, G. Savage50, L. Sawyer60, T. Scanlon44, D. Schaile26, R.D. Schamberger72, Y. Scheglov41, H. Schellman53, T. Schliephake27, S. Schlobohm82, C. Schwanenberger45,
R. Schwienhorst65, J. Sekaric58, H. Severini75, E. Shabalina24, M. Shamim59, V. Shary18, A.A. Shchukin40, R.K. Shivpuri29, V. Simak10, V. Sirotenko50, P. Skubic75, P. Slattery71, D. Smirnov55, G.R. Snow67, J. Snow74,
S. Snyder73, S. S¨oldner-Rembold45, L. Sonnenschein21, A. Sopczak43, M. Sosebee78, K. Soustruznik9, B. Spurlock78, J. Stark14, V. Stolin38, D.A. Stoyanova40, J. Strandberg64, M.A. Strang69, E. Strauss72, M. Strauss75, R. Str¨ohmer26, D. Strom51, L. Stutte50, S. Sumowidagdo49, P. Svoisky36, M. Takahashi45, A. Tanasijczuk1, W. Taylor6, B. Tiller26, M. Titov18, V.V. Tokmenin37, I. Torchiani23, D. Tsybychev72, B. Tuchming18, C. Tully68, P.M. Tuts70, R. Unalan65, L. Uvarov41, S. Uvarov41, S. Uzunyan52, P.J. van den Berg35,
R. Van Kooten54, W.M. van Leeuwen35, N. Varelas51, E.W. Varnes46, I.A. Vasilyev40, P. Verdier20, L.S. Vertogradov37, M. Verzocchi50, M. Vesterinen45, D. Vilanova18, P. Vint44, P. Vokac10, R. Wagner68, H.D. Wahl49, M.H.L.S. Wang71, J. Warchol55, G. Watts82, M. Wayne55, G. Weber25, M. Weber50,g, A. Wenger23,h,
M. Wetstein61, A. White78, D. Wicke25, M.R.J. Williams43, G.W. Wilson58, S.J. Wimpenny48, M. Wobisch60, D.R. Wood63, T.R. Wyatt45, Y. Xie77, C. Xu64, S. Yacoob53, R. Yamada50, W.-C. Yang45, T. Yasuda50, Y.A. Yatsunenko37, Z. Ye50, H. Yin7, K. Yip73, H.D. Yoo77, S.W. Youn50, J. Yu78, C. Zeitnitz27, S. Zelitch81, T. Zhao82, B. Zhou64, J. Zhu72, M. Zielinski71, D. Zieminska54, L. Zivkovic70, V. Zutshi52, and E.G. Zverev39
(The DØ Collaboration)
1
Universidad de Buenos Aires, Buenos Aires, Argentina
2
LAFEX, Centro Brasileiro de Pesquisas F´ısicas, Rio de Janeiro, Brazil
3
Universidade do Estado do Rio de Janeiro, Rio de Janeiro, Brazil
4
Universidade Federal do ABC, Santo Andr´e, Brazil
5
Instituto de F´ısica Te´orica, Universidade Estadual Paulista, S˜ao Paulo, Brazil
6University of Alberta, Edmonton, Alberta, Canada; Simon Fraser University,
Burnaby, British Columbia, Canada; York University, Toronto, Ontario, Canada and McGill University, Montreal, Quebec, Canada
7University of Science and Technology of China, Hefei, People’s Republic of China 8
Universidad de los Andes, Bogot´a, Colombia
9
Center for Particle Physics, Charles University, Faculty of Mathematics and Physics, Prague, Czech Republic
10
Czech Technical University in Prague, Prague, Czech Republic
11
Center for Particle Physics, Institute of Physics,
Academy of Sciences of the Czech Republic, Prague, Czech Republic
12
Universidad San Francisco de Quito, Quito, Ecuador
13
LPC, Universit´e Blaise Pascal, CNRS/IN2P3, Clermont, France
14LPSC, Universit´e Joseph Fourier Grenoble 1, CNRS/IN2P3,
Institut National Polytechnique de Grenoble, Grenoble, France
15
CPPM, Aix-Marseille Universit´e, CNRS/IN2P3, Marseille, France
16
LAL, Universit´e Paris-Sud, IN2P3/CNRS, Orsay, France
17
LPNHE, IN2P3/CNRS, Universit´es Paris VI and VII, Paris, France
18
CEA, Irfu, SPP, Saclay, France
19
IPHC, Universit´e de Strasbourg, CNRS/IN2P3, Strasbourg, France
20IPNL, Universit´e Lyon 1, CNRS/IN2P3, Villeurbanne, France and Universit´e de Lyon, Lyon, France 21
III. Physikalisches Institut A, RWTH Aachen University, Aachen, Germany
22
Physikalisches Institut, Universit¨at Bonn, Bonn, Germany
23Physikalisches Institut, Universit¨at Freiburg, Freiburg, Germany 24
II. Physikalisches Institut, Georg-August-Universit¨at G¨ottingen, G¨ottingen, Germany
25
Institut f¨ur Physik, Universit¨at Mainz, Mainz, Germany
26
Ludwig-Maximilians-Universit¨at M¨unchen, M¨unchen, Germany
27
Fachbereich Physik, University of Wuppertal, Wuppertal, Germany
28
Panjab University, Chandigarh, India
29
Delhi University, Delhi, India
30Tata Institute of Fundamental Research, Mumbai, India 31
University College Dublin, Dublin, Ireland
32
Korea Detector Laboratory, Korea University, Seoul, Korea
33SungKyunKwan University, Suwon, Korea 34
CINVESTAV, Mexico City, Mexico
35
FOM-Institute NIKHEF and University of Amsterdam/NIKHEF, Amsterdam, The Netherlands
36Radboud University Nijmegen/NIKHEF, Nijmegen, The Netherlands 37
Joint Institute for Nuclear Research, Dubna, Russia
38
Institute for Theoretical and Experimental Physics, Moscow, Russia
39
Moscow State University, Moscow, Russia
40
41
Petersburg Nuclear Physics Institute, St. Petersburg, Russia
42
Stockholm University, Stockholm, Sweden, and Uppsala University, Uppsala, Sweden
43Lancaster University, Lancaster, United Kingdom 44
Imperial College London, London SW7 2AZ, United Kingdom
45
The University of Manchester, Manchester M13 9PL, United Kingdom
46University of Arizona, Tucson, Arizona 85721, USA 47
California State University, Fresno, California 93740, USA
48
University of California, Riverside, California 92521, USA
49Florida State University, Tallahassee, Florida 32306, USA 50
Fermi National Accelerator Laboratory, Batavia, Illinois 60510, USA
51
University of Illinois at Chicago, Chicago, Illinois 60607, USA
52
Northern Illinois University, DeKalb, Illinois 60115, USA
53
Northwestern University, Evanston, Illinois 60208, USA
54
Indiana University, Bloomington, Indiana 47405, USA
55
University of Notre Dame, Notre Dame, Indiana 46556, USA
56Purdue University Calumet, Hammond, Indiana 46323, USA 57
Iowa State University, Ames, Iowa 50011, USA
58
University of Kansas, Lawrence, Kansas 66045, USA
59Kansas State University, Manhattan, Kansas 66506, USA 60
Louisiana Tech University, Ruston, Louisiana 71272, USA
61
University of Maryland, College Park, Maryland 20742, USA
62
Boston University, Boston, Massachusetts 02215, USA
63
Northeastern University, Boston, Massachusetts 02115, USA
64
University of Michigan, Ann Arbor, Michigan 48109, USA
65
Michigan State University, East Lansing, Michigan 48824, USA
66University of Mississippi, University, Mississippi 38677, USA 67
University of Nebraska, Lincoln, Nebraska 68588, USA
68
Princeton University, Princeton, New Jersey 08544, USA
69State University of New York, Buffalo, New York 14260, USA 70
Columbia University, New York, New York 10027, USA
71
University of Rochester, Rochester, New York 14627, USA
72State University of New York, Stony Brook, New York 11794, USA 73
Brookhaven National Laboratory, Upton, New York 11973, USA
74
Langston University, Langston, Oklahoma 73050, USA
75University of Oklahoma, Norman, Oklahoma 73019, USA 76
Oklahoma State University, Stillwater, Oklahoma 74078, USA
77
Brown University, Providence, Rhode Island 02912, USA
78University of Texas, Arlington, Texas 76019, USA 79Southern Methodist University, Dallas, Texas 75275, USA
80
Rice University, Houston, Texas 77005, USA
81
University of Virginia, Charlottesville, Virginia 22901, USA and
82
University of Washington, Seattle, Washington 98195, USA (Dated: November 22, 2009)
We present a measurement of the t¯t cross section using high-multiplicity jet events produced in p¯p collisions at√s = 1.96 TeV. These data were recorded at the Fermilab Tevatron collider with the D0 detector. Events with at least six jets, two of them identified as b jets, were selected from a 1 fb−1
data set. The measured cross section, assuming a top quark mass of 175 GeV/c2
, is 6.9 ± 2.0 pb, in agreement with theoretical expectations.
PACS numbers: 14.65.Ha
I. INTRODUCTION
The top quark is the most massive fundamental parti-cle ever observed. Its mass, mt= 173.1 ± 1.3 GeV/c2[1], is approximately twice that of the next heaviest elemen-tary particle, the Z boson, and is approximately 35 times that of its weak-isospin partner, the bottom quark. Top quarks are primarily produced in pairs at the Fermi-lab Tevatron p¯p collider via the q ¯q → t¯t (≈ 85%) and gg → t¯t (≈ 15%) quantum chromodynamic (QCD)
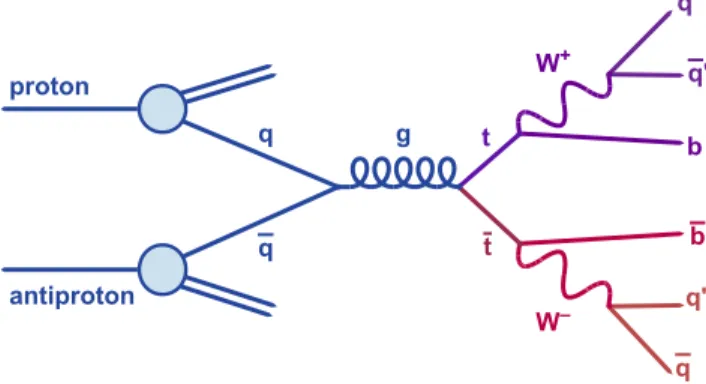
pro-cesses. They decay to a W boson and a b quark with a branching fraction near one according to the standard model (SM). The W boson subsequently decays into a lepton and a neutrino or into a quark-antiquark pair. The decay products of the W bosons are used to clas-sify the top quark decay channel. The all-hadronic decay channel, with a branching fraction of 46% [2], has a fi-nal state containing two b quarks and four lighter quarks and is shown schematically in Fig. 1. The top quark might also decay into non-SM particles (e.g., a charged
Higgs boson) and the decay products of these new par-ticles can change the branching fractions of the leptonic and all-hadronic t¯t decay channels [3]. Comparing the t¯t production cross section between different decay channels directly constrains the existence of beyond the standard model particles lighter than the top quark.
In this paper, we present a new measurement of the p¯p → t¯t+X cross section using events containing at least six jets, two of them identified as b jets. The data sample corresponds to ≈ 1 fb−1 acquired by the D0 experiment at a center-of-mass energy√s = 1.96 TeV. D0 previously published a measurement of the t¯t cross section in multi-jet events with 0.4 fb−1 of integrated luminosity and ob-tained 4.5+2.0−1.9(stat.)+1.4−1.1(sys.) ± 0.3 (lum.) pb [4]. CDF published a similar measurement with 1 fb−1 and ob-tained 8.3±1.0 (stat.)+2.0−1.5(sys.)±0.5 (lum.) pb [5]. Both measurements assumed mt= 175 GeV/c2and agree with the cross section measurement presented in this paper and with the SM expectation of 6.90+0.44−0.62pb [6, 7].
The dominant source of background in the all-hadronic channel is QCD multijet production. Rather than rely-ing on event generators such as pythia [8], herwig [9], or alpgen [10] to reproduce all characteristics of events with six or more jets, we instead derived a background sample from the triggered data (Sec. III B). The back-ground was suppressed compared to signal by requiring at least two of the jets be identified as b jets (Sec. II E). The t¯t signal was simulated by the alpgen event gener-ator that used pythia with the tune A [11] parameter settings for the parton shower, hadronization, and un-derlying event aspects. Kinematic selection criteria were applied to further improve the signal-to-background ra-tio to approximately 1 : 7 (Sec. III D). The t¯t production cross section was extracted using signal and background templates for a likelihood discriminant constructed from topological and kinematic observables. (Sec. IV).
FIG. 1: Dominant Feynman diagram for t¯t production in the all-hadronic decay channel. The t decays into a W+
b and the W+
decays into either u ¯d or c¯s (represented by the q and ¯q′in
the figure); the ¯t and W−decay into the charge conjugates.
The event signature consists of two b jets and at least four other jets.
II. DETECTOR AND RECONSTRUCTION
A. Detector
The D0 detector [12] has a central-tracking system con-sisting of a silicon microstrip tracker (SMT) and a cen-tral fiber tracker (CFT), both located within a 2 T su-perconducting solenoidal magnet, with designs optimized for tracking and vertexing at pseudorapidities |η| < 3 and |η| < 2.5, respectively [13]. Central and forward preshower detectors are positioned just outside of the superconducting coil. The liquid-argon and uranium calorimeter has a central section (CC) covering pseudo-rapidities |η| <∼ 1.1 and two end calorimeters (EC) that extend coverage to |η| ≈ 4.2, with all three housed in separate cryostats [14]. Each calorimeter contains a four-layer electromagnetic (EM) section closest to the inter-action region, followed by finely- and coarsely-segmented hadronic sections. Scintillators between the CC and EC cryostats provide sampling of developing showers at 1.1 <∼ |η|<∼ 1.4. The luminosity is measured using scin-tillators placed in front of the EC cryostats [15]. An outer muon system, covering |η| < 2, consists of a layer of tracking detectors and scintillation trigger counters in front of 1.8 T iron toroids, followed by two similar lay-ers beyond the toroids. The trigger and data acquisition systems were designed to accommodate the high lumi-nosities of Tevatron Run II.
B. Trigger
The events used in this analysis were collected using a multijet trigger. The first level of the trigger used ded-icated hardware and preliminary information from the calorimeter to identify multijet events. This selection was refined in a second level with more complex algorithms. The third trigger level employed a fast reconstruction of the event with a simple cone jet algorithm [16]. This se-lection was further refined using the final reconstruction algorithms which included the midpoint cone jet algo-rithm [16]. Kinematic and jet multiplicity requirements were applied at each stage to reduce the overall data rate. The trigger required at least four reconstructed jets. The specific requirements on the jets, particularly the en-ergy thresholds, were changed several times during data collection to cope with the increasing instantaneous lumi-nosity delivered by the Tevatron. Efficiencies were mea-sured independently for each trigger epoch and combined together weighted by the integrated luminosity of each epoch. Rather than correcting the data for inefficiencies in the trigger, the simulated t¯t signal was weighted by the trigger efficiency. The average trigger efficiency for t¯t signal events that passed all selection criteria used in this analysis is shown in Fig. 2 as a function of HT where HT =P pT over all jets and pT is the transverse momen-tum of a jet. The background sample was created from the triggered data (see Sec. III B) and therefore need no
(GeV/c) T H 200 300 400 500 600 700 800 900 trigger efficiency 0.0 0.2 0.4 0.6 0.8 1.0 arbitrary units -5 10 -4 10 -3 10 -2 10 -1 10 1 (GeV/c) T H 200 300 400 500 600 700 800 900 trigger efficiency 0.0 0.2 0.4 0.6 0.8 1.0
DØ
Signal
t
t
FIG. 2: Average trigger efficiency for simulated all-hadronic t¯t events as a function of HT. The untriggered t¯t HT
distri-bution, normalized to unit area, is also shown (scale shown on the right.) Displayed error bars represent statistical un-certainties only.
additional corrections.
C. Tracks and Vertices
Tracks were reconstructed from hit information in the SMT and CFT. The location of the hard-scatter interac-tion point was reconstructed by means of an adaptive pri-mary vertex algorithm [17, 18]. Only vertices constructed from at least three tracks were considered in this analy-sis; O(40) tracks are associated, on average, with primary vertices in simulated all-hadronic t¯t events. A distribu-tion of the locadistribu-tion of primary vertices along the z axis in triggered events is displayed in Fig. 3. The primary interaction vertex was required to be within 35 cm of the center of the detector along the z axis to keep it within the fiducial volume of the SMT [18]. The distribution in Fig. 3 was fitted within the |zPV| < 35 cm range with the sum of two Gaussians. The fit extrapolation outside this range is also shown. The total primary vertex acceptance was 79.5 ± 2.0%.
D. Jets
Jets were reconstructed from energy deposits in calorimeter cells using the Run II midpoint cone algo-rithm [16] with a cone radius R = p(∆φ)2+ (∆y)2 = 0.5 [19]. Noisy calorimeter cells were suppressed by only including cells that had energies ≥ 4σ above the aver-age electronic noise and that also had adjacent cells with
(cm) PV z -60 -40 -20 0 20 40 60 arbitrary units 0.000 0.002 0.004 0.006 0.008 0.010 0.012 0.014 0.016 0.018 (cm) PV z -60 -40 -20 0 20 40 60 arbitrary units 0.000 0.002 0.004 0.006 0.008 0.010 0.012 0.014 0.016 0.018 (cm) PV z -60 -40 -20 0 20 40 60 arbitrary units 0.000 0.002 0.004 0.006 0.008 0.010 0.012 0.014 0.016 0.018 -1
Data, 1 fb
DØ
FIG. 3: The distribution of the primary vertex z position with respect to the center of the detector in the triggered data. The solid line is a fit to the region with |zPV| < 35 cm, while the
dotted line is an extrapolation of the fit outside that region. Displayed error bars represent statistical uncertainties only. The distribution is normalized to unit area.
energies ≥ 2σ above noise. Jets were required to have < 40% of their energy in the coarse hadronic calorime-ter, have at least half the remaining transverse energy matched to energy depositions identified by the hardware trigger, and have between 5% and 95% of their energy in the EM calorimeter. These requirements were for jets reconstructed in the CC; they were looser at forward ra-pidities.
Jet energies were corrected for the energy response of the calorimeter, for the effect of particles showering out-side the jet cone, for overlaps due to multiple interac-tions and event pile-up, and for calorimeter noise [20]. The calorimeter response was measured using the pT im-balance in γ+jet and dijet events; the response of the calorimeter to electromagnetic showers was calibrated us-ing the Z → e+e− mass peak and a detailed accounting of the material between the calorimeter and the interac-tion point. The jet energy calibrainterac-tion also used Z+jet events and events acquired using low bias triggers. Jets that contained muons, assumed to originate from c- or b-hadron decays, were corrected to account for the energy of the muon and the accompanying neutrino. Muons with pT > 60 GeV/c were treated as having pT = 60 GeV/c to avoid the impact from poorly reconstructed muon mo-menta. Jet energies were calibrated independently in the data and in the simulation using the same methodology. Jets in the simulation required additional corrections to reproduce the reconstruction efficiency and energy res-olution in the data. The uncertainty on the jet energy calibration is ≈ 1.5%.
(GeV/c)
Tp
0
50
100
150
200
250
taggability fraction
0.75
0.80
0.85
0.90
0.95
1.00
1.05
-1Data, 1 fb
Signal
t
t
DØ
FIG. 4: Comparison of taggability fraction in selected mul-tijet data after selection with that in the t¯t simulation as a function of jet pT. Displayed error bars represent statistical
uncertainties only.
two good quality tracks having pT > 1 GeV/c and pT > 0.5 GeV/c, respectively, that included SMT hits and pointed to the primary vertex. These requirements are termed “taggability” and are important for identi-fying heavy-flavor jets (Sec. II E) and to reject jets pro-duced by overlapping p¯p collisions. The taggability frac-tion depends nominally on the jet pT, jet rapidity, zPV, sign(zPV× ηjet) × |zPV|, and the flavor of the jet [18]. The fraction of jets that were taggable was measured us-ing the selected sample of multijet events (Sec. III D) and is shown in Fig. 4 binned in jet pT. Differences between the taggability determined with multijet data and with the t¯t signal simulation could bias the cross section mea-surement. The t¯t simulation yielded the same taggability fraction as a function of jet pT and η as the multijet data within the statistical uncertainties (Fig. 4). The uncer-tainty on the relative difference between data and simu-lation is 2% and is dominated by the limited statistics in the comparison.
E. b Jets
Jets that contain a b hadron are called “b jets” as they typically originate from a b quark. b hadrons have rel-atively long lifetimes and so usually travel several mil-limeters before they decay. Secondary vertices, displaced from the primary vertex, are usually formed by the tracks associated with the decay products of the b hadron.
An artificial neural network (NN) was used to iden-tify b jets [21]. Selected characteristics of secondary
ver-tices and tracks associated with b hadron decays were used as inputs to the NN. These included aspects of the secondary vertex such as its decay length significance, goodness of fit, number of tracks, mass of the system of particles associated with the vertex, and the number of secondary vertices found in the jet. Additionally, the weighted combination of track impact parameter signif-icances and the probability that the jet originated from the primary vertex were also input into the NN.
The probability to identify a b jet, the tag rate tion, was measured in data and parametrized as a func-tion of the jet pT and η. Similar functions were de-termined for charm jets. The fake rate, the probabil-ity to assign a b tag to a non-b jet, was dominated by light jets and long-lived particles (e.g., K0
s, Λ0). The b-tagging efficiency is (57 ± 2)%, the b-tagging efficiency for charm is (15 ± 1)%, and the fake rate is (0.57 ± 0.07)% for the NN output threshold used in this analysis at pT = 40 GeV/c [21].
III. ANALYSIS TECHNIQUES
A. Data Sample
The data used for this analysis were collected between August 2002 and February 2006 with the four-jet trig-ger described in Sec. II B. Quality requirements were im-posed on the selected data; runs or parts of runs in which detector systems essential to this analysis had problems or significant noise were discarded. The integrated lu-minosity of the data sample, including these trigger and quality requirements, is 0.97 ± 0.06 fb−1.
B. Background Model
QCD multijet events that have at least two heavy-flavor jets are the dominant source of background to t¯t production in the all-hadronic decay channel. This large background is distinguished from the t¯t signal by exploit-ing differences between the kinematic and topological dis-tributions of jets in t¯t and multijet events. Correlations between jets, particularly for b jets, must be reproduced for the observables used in this analysis.
The background sample was created using triggered data events. Signal contamination in the background sample was minimized by selecting events with two b-tagged jets and low jet multiplicities. Samples of events with at least four taggable jets having pT > 15 GeV/c were selected from the triggered data. The b-jet iden-tification criteria described in Sec. II E were applied to these samples; events were kept if there were at least two tagged jets. The background sample was then created by attaching low-pT jets selected from events with six or more jets to events with four or five jets. A reasonable distribution of the jets in the available phase space was ensured using a set of matching criteria.
bb R ∆ 0 1 2 3 4 5 arbitrary units 0.00 0.01 0.02 0.03 0.04 0.05
DØ
-1 Data, 1 fb 4-jet 5-jet >15 GeV/c T p (a) bb R ∆ 0 1 2 3 4 5 arbitrary units 0.00 0.01 0.02 0.03 0.04 0.05 0.06 0.07DØ
-1 Data, 1 fb 4-jet 5-jet >40 GeV/c T p (b)FIG. 5: ∆R between the two leading b-tagged jets in 4-jet and 5-jet events with (a) pT > 15 GeV/c; (b) pT> 40 GeV/c. The
peak near ∆R ≈ π is dominated by direct b¯b production while the peak near ∆R ≈ 1 (twice the jet radius) is mainly g → b¯b. Displayed error bars represent statistical uncertainties only. Distributions are normalized to unit area.
One concern with basing the background distributions on a lower jet-multiplicity sample was that the relative contributions of different production diagrams might de-pend strongly on jet multiplicity. This was tested by examining distributions of the ∆R between the b jets. We expect a peak near π for b¯b produced in 2 → 2 hard scatters, whereas we expect a peak near one (twice the jet radius) for b¯b produced via gluon splitting, g → b¯b. This is illustrated for four and five jet events in Fig. 5. Figure 5(a) shows ∆Rbb for b jets with pT > 15 GeV/c while Fig. 5(b) is the ∆Rbbfor b jets with pT > 40 GeV/c. The relative height of the two peaks depends strongly on the pT requirement, but there is little difference between four- and five-jet events. The gluon-splitting contribu-tion is significantly suppressed by increasing the b-jet pT requirement from 15 to 40 GeV/c.
The scheme for creating a background sample was de-veloped in a relatively pure QCD multijet context. A “background” sample was constructed by adding the low-est pT jet from five-jet events to four-jet events. The two sources of jets were matched together to ensure compat-ible phase-space configurations. The leading jets in each sample were required to have a difference in pT (∆pT) within 1 GeV/c. Matches resulting in unphysical config-urations (e.g., spatially overlapping jets) were rejected. The background event statistics were enhanced by run-ning twenty times over the four- and five-jet samples. In each step the ∆pT requirement was relaxed by 1 GeV/c.
One issue with this matching scheme is that an ini-tial four-jet event might not have sufficient phase space
for an additional jet. Since QCD multijet events are not expected to contain significant missing transverse energy (6ET), the presence of 6ET implies the presence of unrecon-structed or mismeasured jets which makes these events more suitable for use in the background sample. How-ever, badly mis-reconstructed events or events containing hard neutrinos can skew the phase space. Requiring the ratio of 6ET to HT 4≡P4i=1pT ito be small reduced these contributions. Agreement between the “signal” (unadul-terated) and “background” five-jet samples was best with 6ET > 5 GeV/c and 6ET/HT 4< 0.1. Variations in this ad-ditional phase space selection were included in the sys-tematic uncertainty evaluation [22].
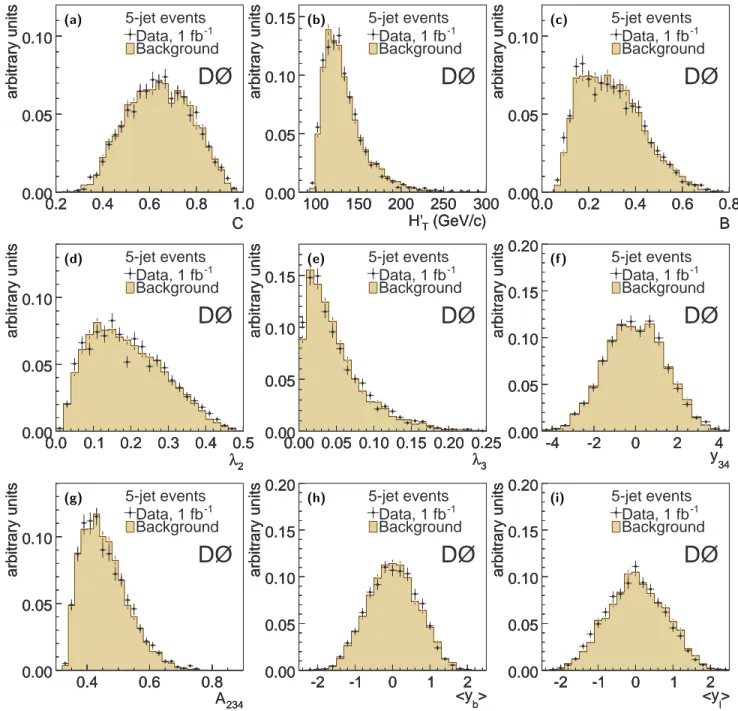
The resulting events were compared with the five-jet sample as illustrated in Fig. 6. Reasonable agreement was achieved with the individual jet pT distributions and with their sum. These manufactured background events are also compared against the five-jet events for several topological variables (defined in Sec. III E) in Fig. 7.
Both the original four-jet sample used to create these five-jet “background” events and the “signal” five-jet sample to which it was compared had little contamination from t¯t (0.2% and 0.7%, respectively), so this tests our ability to use one multijet sample to create a represen-tation of a higher-multiplicity sample. This scheme was extended to produce the background sample for events with six or more jets. In this case, the lowest pT jets were added to either four-jet (fifth and lower pT jets) or five-jet (sixth and lower pT jets) samples. There was no reason to prefer the four-jet-initiated background over the one built from a five-jet sample. Instead, an equal
(GeV/c)
T1p
100
200
300
arbitrary units
-410
-310
-210
-110
1
DØ
5-jet events
-1Data, 1 fb
Background
(GeV/c)
T1p
100
200
300
arbitrary units
-410
-310
-210
-110
1
(GeV/c)
T1p
100
200
300
arbitrary units
-410
-310
-210
-110
1
(a)(GeV/c)
T2p
100
200
300
arbitrary units
-410
-310
-210
-110
1
DØ
5-jet events
-1Data, 1 fb
Background
(GeV/c)
T2p
100
200
300
arbitrary units
-410
-310
-210
-110
1
(GeV/c)
T2p
100
200
300
arbitrary units
-410
-310
-210
-110
1
(b)(GeV/c)
T3p
50
100
150
arbitrary units
-410
-310
-210
-110
1
DØ
5-jet events
-1Data, 1 fb
Background
(GeV/c)
T3p
50
100
150
arbitrary units
-410
-310
-210
-110
1
(GeV/c)
T3p
50
100
150
arbitrary units
-410
-310
-210
-110
1
(c)(GeV/c)
T4p
40
60
80
100
arbitrary units
-410
-310
-210
-110
1
DØ
5-jet events
-1Data, 1 fb
Background
(GeV/c)
T4p
40
60
80
100
arbitrary units
-410
-310
-210
-110
1
(GeV/c)
T4p
40
60
80
100
arbitrary units
-410
-310
-210
-110
1
(d)(GeV/c)
T5p
20
40
60
80
arbitrary units
-410
-310
-210
-110
1
DØ
5-jet events
-1Data, 1 fb
Background
(GeV/c)
T5p
20
40
60
80
arbitrary units
-410
-310
-210
-110
1
(GeV/c)
T5p
20
40
60
80
arbitrary units
-410
-310
-210
-110
1
(e)(GeV/c)
TH
200
400
600
800
arbitrary units
-410
-310
-210
-110
1
DØ
5-jet events
-1Data, 1 fb
Background
(GeV/c)
TH
200
400
600
800
arbitrary units
-410
-310
-210
-110
1
(GeV/c)
TH
200
400
600
800
arbitrary units
-410
-310
-210
-110
1
(f)FIG. 6: Comparisons between the five-jet data and the background created from four-jet data for the pT distributions of each
jet (pT1through pT5) and for HT. The leading four jets were required to have pT> 40 GeV/c. Displayed error bars represent
statistical uncertainties only. Distributions are normalized to unit area.
mix of the two was used for the final background sample and the difference between the two separate background samples and the mixed sample was used when evaluat-ing systematic uncertainties. Variations between the two samples as a function of HT are shown in Fig. 8. Also shown is the change in the background due to systematic variations in the phase-space matching criteria described above.
C. Signal Model
The t¯t signal was simulated with the alpgen event generator. Two inclusive t¯t samples were used in this analysis: one with mt = 170 GeV/c2 and one with mt= 175 GeV/c2[23]. pythia, with the tune A param-eter settings, was used for the parton shower, hadroniza-tion, and underlying event aspects. The resulting events were processed through a geant [24] simulation of the D0 detector and underwent the full reconstruction and analysis procedure. Information from data events se-lected by a random beam crossing trigger were overlayed on the simulated events to reproduce experimental con-ditions including detector noise and overlapping p¯p
in-teractions. The instantaneous luminosity distribution of the simulated events was weighted to match that of the triggered data.
Several additional corrections were applied to the sim-ulated events. First, the event generator used the lead-ing order (LO) parton distribution functions (PDF) from CTEQ6L1 [25, 26]. Events were reweighted to corre-spond to the CTEQ6.5M [27] PDF. Second, the de-fault heavy-flavor fragmentation function in pythia was reweighted to one that described the LEP e+e−data [28]. Additionally, the resolutions of reconstructed objects in the simulation were slightly better than those in the data. so the energies of jets, muons, and electrons were smeared to reproduce the resolutions observed in data [29]. The jet identification efficiency is slightly higher in the sim-ulation than in data. Therefore, jets in the simsim-ulation were randomly removed to make the efficiencies agree.
D. Event Selection
Selection criteria were applied to triggered events to minimize background while retaining a relatively high signal efficiency. The selection criteria, together with
C 0.2 0.4 0.6 0.8 1.0 arbitrary units 0.00 0.05 0.10
DØ
5-jet events -1 Data, 1 fb Background C 0.2 0.4 0.6 0.8 1.0 arbitrary units 0.00 0.05 0.10 C 0.2 0.4 0.6 0.8 1.0 arbitrary units 0.00 0.05 0.10 (a) (GeV/c) T H’ 100 150 200 250 300 arbitrary units 0.00 0.05 0.10 0.15DØ
5-jet events -1 Data, 1 fb Background (GeV/c) T H’ 100 150 200 250 300 arbitrary units 0.00 0.05 0.10 0.15 (GeV/c) T H’ 100 150 200 250 300 arbitrary units 0.00 0.05 0.10 0.15 (b) B 0.0 0.2 0.4 0.6 0.8 arbitrary units 0.00 0.05 0.10DØ
5-jet events -1 Data, 1 fb Background B 0.0 0.2 0.4 0.6 0.8 arbitrary units 0.00 0.05 0.10 B 0.0 0.2 0.4 0.6 0.8 arbitrary units 0.00 0.05 0.10 (c) 2 λ 0.0 0.1 0.2 0.3 0.4 0.5 arbitrary units 0.00 0.05 0.10DØ
5-jet events -1 Data, 1 fb Background 2 λ 0.0 0.1 0.2 0.3 0.4 0.5 arbitrary units 0.00 0.05 0.10 2 λ 0.0 0.1 0.2 0.3 0.4 0.5 arbitrary units 0.00 0.05 0.10 (d) 3 λ 0.00 0.05 0.10 0.15 0.20 0.25 arbitrary units 0.00 0.05 0.10 0.15DØ
5-jet events -1 Data, 1 fb Background 3 λ 0.00 0.05 0.10 0.15 0.20 0.25 arbitrary units 0.00 0.05 0.10 0.15 3 λ 0.00 0.05 0.10 0.15 0.20 0.25 arbitrary units 0.00 0.05 0.10 0.15 (e) 34 y -4 -2 0 2 4 arbitrary units 0.00 0.05 0.10 0.15 0.20DØ
5-jet events -1 Data, 1 fb Background 34 y -4 -2 0 2 4 arbitrary units 0.00 0.05 0.10 0.15 0.20 34 y -4 -2 0 2 4 arbitrary units 0.00 0.05 0.10 0.15 0.20 (f) 234 A 0.4 0.6 0.8 arbitrary units 0.00 0.05 0.10DØ
5-jet events -1 Data, 1 fb Background 234 A 0.4 0.6 0.8 arbitrary units 0.00 0.05 0.10 234 A 0.4 0.6 0.8 arbitrary units 0.00 0.05 0.10 (g) > b <y -2 -1 0 1 2 arbitrary units 0.00 0.05 0.10 0.15 0.20DØ
5-jet events -1 Data, 1 fb Background > b <y -2 -1 0 1 2 arbitrary units 0.00 0.05 0.10 0.15 0.20 > b <y -2 -1 0 1 2 arbitrary units 0.00 0.05 0.10 0.15 0.20 (h) > l <y -2 -1 0 1 2 arbitrary units 0.00 0.05 0.10 0.15 0.20DØ
5-jet events -1 Data, 1 fb Background > l <y -2 -1 0 1 2 arbitrary units 0.00 0.05 0.10 0.15 0.20 > l <y -2 -1 0 1 2 arbitrary units 0.00 0.05 0.10 0.15 0.20 (i)FIG. 7: Comparisons between the five-jet data and the background created from four-jet data for variables used in the likelihood discriminant. The leading four jets were required to have pT > 40 GeV/c. Displayed error bars represent statistical uncertainties
only. Distributions are normalized to unit area.
the number of events after each cut, the cut efficiency ε, and the cumulative selection efficiency εcum, are pre-sented in Table I. Values are given for the all-hadronic t¯t signal, for signal in all other t¯t decay channels, and for the data-based background. The signal fraction in the final selected sample corresponded to a purity of 12.5% (as found in Sec. IV A). As the background was derived from triggered data, the minimum set of requirements on that sample, which also included a reconstructed pri-mary vertex with |zPV| < 35 cm and ≥ 4 jets having pT > 15 GeV/c, are listed as the second line in Table I.
This corresponded to a starting signal-to-background ra-tio of approximately 1 : 7700.
Events with isolated high-pT electrons and muons were removed to avoid overlap with other D0 t¯t cross section measurements [30, 31]. This requirement had little effect on the all-hadronic t¯t signal, but did remove a consider-able number of events from the background.
Events considered in this analysis were required to have at least six jets. Each jet was required to be tag-gable, have pT > 15 GeV/c, and |η| < 2.5. Further-more, at least four of the jets were required to have
(GeV/c)
TH
200
400
600
800
arbitrary units
-410
-310
-210
-110
1
10
DØ
-1Data, 1 fb
Background (mixed)
Background (5+1)
Background (4+2)
(GeV/c)
TH
200
400
600
800
arbitrary units
-410
-310
-210
-110
1
10
(GeV/c)
TH
200
400
600
800
arbitrary units
-410
-310
-210
-110
1
10
(a)(GeV/c)
TH
200
400
600
800
arbitrary units
-410
-310
-210
-110
1
10
DØ
-1Data, 1 fb
Background (mixed)
Background (up)
Background (down)
(GeV/c)
TH
200
400
600
800
arbitrary units
-410
-310
-210
-110
1
10
(GeV/c)
TH
200
400
600
800
arbitrary units
-410
-310
-210
-110
1
10
(b)FIG. 8: Systematic variations in the background sample with six or more jets as a function of HT. (a) Comparisons with the
background samples created using only four-jet (4+2) or five-jet (5+1) events. (b) Comparisons including one-sigma systematic variations in the phase-space matching criteria. The leading four jets were required to have pT > 40 GeV/c. Distributions are
normalized to unit area.
TABLE I: The number of events after each selection requirement. Each selection is inclusive of the ones above it. Shown are the criteria, the number of events that pass the selection, the efficiency of the selection (ε), and the cumulative selection efficiency (εcum) for all-hadronic t¯t, all other t¯t decay channels, and the data-based background. The mt = 175 GeV/c2 sample was
used for the signal expectation. Signal and background numbers have been adjusted, using the 12.5% signal fraction measured in this analysis, to sum to the number of candidate events selected in the data. Statistical uncertainties are included for the overall signal efficiency.
Selection
All Hadronic t¯t Other t¯t Background
Approx.
Num. ε εcum Num. ε εcum Num. ε εcum
S:B
(%) (%) (%) (%) (%) (%)
Total 3024 100.0 100.0 3712 100.0 100.0
Trigger, vertex, ≥ 4 jets with pT > 15 GeV/c 1663 55.0 55.0 773 20.8 20.8 18856263 100.0 100.0 1:7700
Lepton veto 1662 100.0 55.0 558 72.2 15.0 12679185 67.2 67.3 1:5700
≥ 6 jets with pT > 15 GeV/c 913 55.0 30.2 165 29.6 4.5 1734595 13.7 9.2 1:1600
≥ 6 taggable jets with pT> 15 GeV/c 628 68.8 20.8 60 36.3 1.6 506277 29.2 2.7 1:740
≥ 2 b-tagged jets with pT > 40 GeV/c 150 23.8 4.9 13 21.8 0.4 2562 0.5 0.014 1:16
≥ 3 jets with pT > 40 GeV/c 147 98.1 4.9 12 95.2 0.3 2059 80.4 0.011 1:13
≥ 4 jets with pT > 40 GeV/c 122 83.2 4.0 9 70.3 0.2 920 44.7 0.0049 1:7
Efficiency (4.04 ± 0.02)% (0.24 ± 0.01)%
Inclusive t¯t Efficiency (1.94 ± 0.01)%
pT > 40 GeV/c. At least two of these high-pT jets were required to be b tagged. These additional jet require-ments improve the signal-to-background ratio by a factor of 100.
In total, 1051 data events satisfy the selection cri-teria. The efficiency for all-hadronic t¯t events with mt = 175 GeV/c2 is (4.04 ± 0.02)% while the overall efficiency for inclusive t¯t events is (1.94 ± 0.01)% (statis-tical uncertainties only). The equivalent efficiencies with mt= 170 GeV/c2are (3.65 ± 0.04)% and (1.76 ± 0.02)%,
respectively. Given these efficiencies and the standard model branching fractions, ≈ 93% of the selected t¯t events are from the all-hadronic decay channel. The sur-viving leptonic t¯t events were primarily from the ℓ+jets (≈ 60%) and τ+jets (≈ 40%) decay channels. Few dilep-tonic events survived the full selection criteria (≈ 0.05% of t¯t).
The expected signal-to-background ratio, given the 12.5% signal purity extracted during the cross section measurement, is 1 : 7.
C 0.2 0.4 0.6 0.8 1.0 probability 0.00 0.05 0.10 0.15 0.20 0.25
DØ
tBackgroundtBackgroundtt Signal SignalC 0.2 0.4 0.6 0.8 1.0 probability 0.00 0.05 0.10 0.15 0.20 0.25 C 0.2 0.4 0.6 0.8 1.0 probability 0.00 0.05 0.10 0.15 0.20 0.25 (a) (GeV/c) T H’ 100 200 300 400 probability 0.00 0.05 0.10 0.15 0.20 0.25
DØ
tBackgroundtBackgroundtt Signal Signal(GeV/c) T H’ 100 200 300 400 probability 0.00 0.05 0.10 0.15 0.20 0.25 (GeV/c) T H’ 100 200 300 400 probability 0.00 0.05 0.10 0.15 0.20 0.25 (b) B 0.0 0.2 0.4 0.6 0.8 probability 0.00 0.05 0.10 0.15 0.20
DØ
tBackgroundtBackgroundtt Signal SignalB 0.0 0.2 0.4 0.6 0.8 probability 0.00 0.05 0.10 0.15 0.20 B 0.0 0.2 0.4 0.6 0.8 probability 0.00 0.05 0.10 0.15 0.20 (c) 2 λ 0.0 0.2 0.4 probability 0.00 0.05 0.10 0.15 0.20 0.25
DØ
tBackgroundtBackgroundtt Signal Signal2 λ 0.0 0.2 0.4 probability 0.00 0.05 0.10 0.15 0.20 0.25 2 λ 0.0 0.2 0.4 probability 0.00 0.05 0.10 0.15 0.20 0.25 (d) 3 λ 0.0 0.1 0.2 0.3 probability 0.0 0.1 0.2
0.3
DØ
tBackgroundtBackgroundtt Signal Signal3 λ 0.0 0.1 0.2 0.3 probability 0.0 0.1 0.2 0.3 3 λ 0.0 0.1 0.2 0.3 probability 0.0 0.1 0.2 0.3 (e) 34 y -2 0 2 probability 0.00 0.05 0.10 0.15 0.20
DØ
tBackgroundtBackgroundtt Signal Signal34 y -2 0 2 probability 0.00 0.05 0.10 0.15 0.20 34 y -2 0 2 probability 0.00 0.05 0.10 0.15 0.20 (f) 234 A 0.4 0.6 0.8 probability 0.0 0.1 0.2 0.3
DØ
tBackgroundtBackgroundtt Signal Signal234 A 0.4 0.6 0.8 probability 0.0 0.1 0.2 0.3 234 A 0.4 0.6 0.8 probability 0.0 0.1 0.2 0.3 (g) > b <y -2 -1 0 1 2 probability 0.00 0.05 0.10 0.15 0.20
DØ
tt Signal Background Signal t t Background > b <y -2 -1 0 1 2 probability 0.00 0.05 0.10 0.15 0.20 > b <y -2 -1 0 1 2 probability 0.00 0.05 0.10 0.15 0.20 (h) > l <y -2 0 2 probability 0.00 0.05 0.10 0.15 0.20DØ
tBackgroundtBackgroundtt Signal Signal> l <y -2 0 2 probability 0.00 0.05 0.10 0.15 0.20 > l <y -2 0 2 probability 0.00 0.05 0.10 0.15 0.20 (i)
FIG. 9: Probability distributions for the variables input into the likelihood ratio. The signal distributions were extracted from the sample with mt= 175 GeV/c
2
. Displayed error bars represent statistical uncertainties only.
E. Maximum Likelihood
A likelihood discriminant based on topological observ-ables was constructed to separate the all-hadronic t¯t sig-nal from the multijet background. The likelihood ratio, L, for an event i is defined as
L = LS(i) LS(i) + LB(i) , where LS(i) = nvar Y k=1 PS,k[xk(i)]
for signal and similarly for background. Here, PS,kis the signal probability density function, normalized to unit area, for the kth input variable xk, and nvaris the number of variables. The tmva [32] package was used to build the probability distributions and the resulting likelihood ratio.
The criteria for selection of observables to be input into the likelihood were: separation between signal and back-ground, reasonable agreement in the five-jet background validation, little correlation with other chosen variables, and little dependence on jet energies (to minimize sys-tematic uncertainty due to jet energy calibration). The following nine variables were used in the likelihood
deter-L 0.0 0.5 1.0 probability 0.00 0.05 0.10 0.15 0.20 0.25 0.30 0.35
DØ
tt Signal Background L 0.0 0.5 1.0 probability 0.00 0.05 0.10 0.15 0.20 0.25 0.30 0.35 L 0.0 0.5 1.0 probability 0.00 0.05 0.10 0.15 0.20 0.25 0.30 0.35 (a) L 0.0 0.5 1.0 probability 0.00 0.05 0.10 0.15 0.20 0.25 0.30 0.35DØ
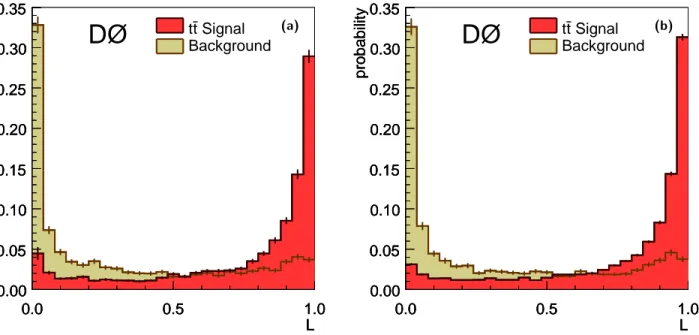
tt Signal Background L 0.0 0.5 1.0 probability 0.00 0.05 0.10 0.15 0.20 0.25 0.30 0.35 L 0.0 0.5 1.0 probability 0.00 0.05 0.10 0.15 0.20 0.25 0.30 0.35 (b)FIG. 10: Probability distributions from the likelihood function, L, for t¯t signal and the data-derived background. Displayed error bars represent statistical uncertainties only. (a) Signal sample with mt= 170 GeV/c2; (b) mt= 175 GeV/c2.
mination and are shown for simulated signal and data-based background events in Fig. 9:
C is the centrality defined as the scalar sum of jet pT divided by the sum of jet energies;
H′
T is the scalar sum of jet pT excluding the two high-est pT jets;
B is the ratio of the dijet mass of the two leading b-tagged jets to the total mass of all the jets; λ2, λ3 are the smallest two eigenvalues of the
momen-tum tensor Mα,β = P ipαip β i/ P i|~pi|2 where i runs over the number of jets and α, β = 1, 2, 3 denote the three spatial components of the jet mo-menta [33];
y34 is the rapidity difference between the third and fourth leading jets;
A234 is the pT asymmetry between the second and third jet and the fourth jet defined as (pT 2 + pT 3 − pT 4)/(pT 2+ pT 3+ pT 4);
hybi is the pT-weighted average of the rapidities of the leading two b-tagged jets;
hyli is the pT-weighted average of the rapidities of the leading two light (not b tagged) jets.
Comparisons are shown in Fig. 7 for these variables in the five-jet background validation sample. The com-bined probability distributions for signal and background are shown in Fig. 10. The probability distributions and likelihoods were extracted independently for the mt = 170 GeV/c2 and 175 GeV/c2samples.
IV. RESULTS
A. Signal Fraction
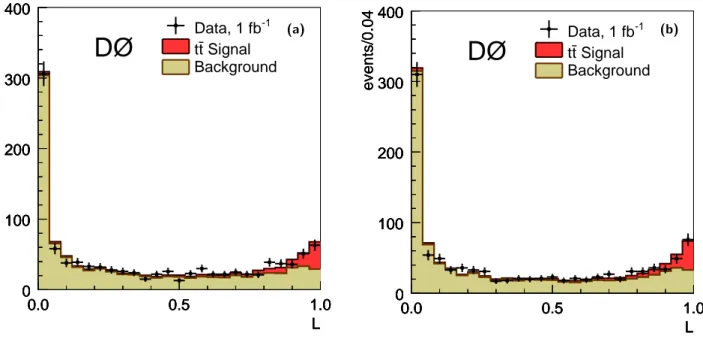
The signal and background likelihood templates were fit to the likelihood output, shown in Fig. 10, for the selected data events using tminuit [34] from root [35]. Results from the fit are shown in Fig. 11 and are in agree-ment with the data. The measured signal fractions are (12.9 ± 2.4)% for mt= 170 GeV/c2and (12.5 ± 2.3)% for mt = 175 GeV/c2. Given 1051 data candidate events, this results in 136 and 131 t¯t events, respectively. Dis-tributions for the observables included in the likelihood, using the signal and background fractions from the fit, are shown in Fig. 12 for mt = 175 GeV/c2. There is reasonable agreement between the data candidates and the sum of signal and background, normalized to the fit results.
Jets in an event can be associated with the decays of individual top quarks. A χ2 was constructed comparing the dijet masses with the W boson mass and the two bjj masses with each other. The combination with the lowest χ2 value was chosen. The results for the dijet mass and the bjj mass are shown in Figs. 13(c) and (d). There is good agreement between data and the sum of signal and background. The comparison is also made in a re-gion of phase space dominated by background (L < 0.2) and one which has a significantly larger signal fraction (L > 0.8), also shown in Fig. 13. The distributions were not renormalized. Both the background-dominated and signal-enhanced distributions show reasonable agreement between data and the sum of signal and background.
L 0.0 0.5 1.0 events/0.04 0 100 200 300 400 0.0 0.5 1.0 0 100 200 300 400
DØ
-1 Data, 1 fb Signal t t Background L 0.0 0.5 1.0 events/0.04 0 100 200 300 400 L 0.0 0.5 1.0 events/0.04 0 100 200 300 400 (a) L 0.0 0.5 1.0 events/0.04 0 100 200 300 400 0.0 0.5 1.0 0 100 200 300 400DØ
-1 Data, 1 fb Signal t t Background L 0.0 0.5 1.0 events/0.04 0 100 200 300 400 L 0.0 0.5 1.0 events/0.04 0 100 200 300 400 (b)FIG. 11: Comparison of the distributions of likelihood output values, L, for the selected data candidates (points) with those from the t¯t signal and data-based background samples. Signal and background were fit to the data candidates and are presented with a normalization equal to the fit purity times the number of candidate events for the signal. Displayed error bars represent statistical uncertainties only. (a) Signal sample with mt= 170 GeV/c2; (b) mt= 175 GeV/c2.
B. Systematic Uncertainties
The effects of systematic uncertainties and variations in input variables were studied using ensemble tests. Ten thousand pseudo-experiments were run for each source of uncertainty. Each pseudo-experiment drew events from the systematically-shifted signal and background distri-butions and was fit using the standard signal and back-ground likelihood templates. With the exception of the two background-related systematics, all of the systematic uncertainties are associated with the signal simulation only. All systematic uncertainties on the t¯t production cross section measured with mt= 175 GeV/c2 are sum-marised in Table II. Many of these are described in more detail in earlier sections of this paper.
This analysis relies on alpgen+pythia for the t¯t sig-nal model used to determine the selection efficiency (Ta-ble I) and the kinematic shapes included in the likelihood determination (Fig. 9). It is possible that the t¯t simula-tion does not properly reproduce the properties of the t¯t system. Other analyses in the lepton+jets and dilep-ton decay channels published by the D0 collaboration have found good agreement between the simulation and the reconstructed data [29, 30, 31, 36]. Nevertheless, the simulation might mis-estimate the jet multiplicity through differences in the QCD radiation or the under-lying event. The measured fraction of reconstructed t¯t events (using the measured signal purities) with seven or more jets is 0.29 ± 0.04. The signal events were weighted up and down by one standard deviation in the statistical
uncertainty on this ratio (15%). The entire analysis was repeated and the resulting difference in the mean cross section applied as a systematic uncertainty. The PDF in the simulation were also reweighted to correspond to CTEQ6.5M. The modified tolerance approach [27, 37] was used to estimate the effects of the PDF uncertainties on the measured cross section. Both of these uncertain-ties, along with those related to the reweighting of the heavy-flavor fragmentation function, luminosity profile, and vertex distribution; are listed as the signal model uncertainty in Table II.
The dominant sources of systematic uncertainty in the t¯t cross section measurement are the jet energy calibra-tion (10.8%), construccalibra-tion of the data-based background (10.7%), b tagging (9.2%), and jet taggability (8.8%). The total systematic uncertainty is 20.5%.
C. Cross Section Measurement
The cross section is defined as
σt¯t= f N
Lε,
where f is the measured fraction of t¯t signal, N is the number of selected data events, L is the integrated lumi-nosity, and ε is the inclusive t¯t efficiency given in Table I.
C 0.2 0.4 0.6 0.8 1.0 events/0.04 0 50 100 150 200 250 0.2 0.4 0.6 0.8 1.0 0 50 100 150 200 250
DØ
-1 Data, 1 fb Signal t t Background Signal t t Background C 0.2 0.4 0.6 0.8 1.0 events/0.04 0 50 100 150 200 250 C 0.2 0.4 0.6 0.8 1.0 events/0.04 0 50 100 150 200 250 (a) (GeV/c) T H’ 100 200 300 400 events/(10 GeV/c) 0 100 200 300 100 200 300 400 0 100 200 300DØ
-1 Data, 1 fb Signal t t Background Signal t t Background (GeV/c) T H’ 100 200 300 400 events/(10 GeV/c) 0 100 200 300 (GeV/c) T H’ 100 200 300 400 events/(10 GeV/c) 0 100 200 300 (b) B 0.0 0.2 0.4 0.6 0.8 events/0.04 0 50 100 150 200 250 0.0 0.2 0.4 0.6 0.8 0 50 100 150 200 250DØ
-1 Data, 1 fb Signal t t Background Signal t t Background B 0.0 0.2 0.4 0.6 0.8 events/0.04 0 50 100 150 200 250 B 0.0 0.2 0.4 0.6 0.8 events/0.04 0 50 100 150 200 250 (c) 2 λ 0.0 0.2 0.4 events/0.04 0 100 200 300 0.0 0.2 0.4 0 100 200 300DØ
-1 Data, 1 fb Signal t t Background Signal t t Background 2 λ 0.0 0.2 0.4 events/0.04 0 100 200 300 2 λ 0.0 0.2 0.4 events/0.04 0 100 200 300 (d) 3 λ 0.0 0.1 0.2 0.3 events/0.02 0 100 200 300 400 0.0 0.1 0.2 0.3 0 100 200 300 400DØ
-1 Data, 1 fb Signal t t Background Signal t t Background 3 λ 0.0 0.1 0.2 0.3 events/0.02 0 100 200 300 400 3 λ 0.0 0.1 0.2 0.3 events/0.02 0 100 200 300 400 (e) 34 y -2 0 2 events/0.40 0 50 100 150 200 -2 0 2 0 50 100 150 200DØ
-1 Data, 1 fb Signal t t Background Signal t t Background 34 y -2 0 2 events/0.40 0 50 100 150 200 34 y -2 0 2 events/0.40 0 50 100 150 200 (f) 234 A 0.4 0.6 0.8 events/0.04 0 100 200 300 400 0.4 0.6 0.8 0 100 200 300 400DØ
-1 Data, 1 fb Signal t t Background Signal t t Background 234 A 0.4 0.6 0.8 events/0.04 0 100 200 300 400 234 A 0.4 0.6 0.8 events/0.04 0 100 200 300 400 (g) > b <y -2 -1 0 1 2 events/0.20 0 50 100 150 200 250 -2 -1 0 1 2 0 50 100 150 200 250DØ
-1 Data, 1 fb Signal t t Background Signal t t Background > b <y -2 -1 0 1 2 events/0.20 0 50 100 150 200 250 > b <y -2 -1 0 1 2 events/0.20 0 50 100 150 200 250 (h) > l <y -2 0 2 events/0.20 0 50 100 150 200 250 -2 0 2 0 50 100 150 200 250DØ
-1 Data, 1 fb Signal t t Background Signal t t Background > l <y -2 0 2 events/0.20 0 50 100 150 200 250 > l <y -2 0 2 events/0.20 0 50 100 150 200 250 (i)FIG. 12: Comparison between the data candidates and the sum of t¯t signal with mt = 175 GeV/c2 and the data-based
background for the variables used in the likelihood discriminant. Displayed error bars represent statistical uncertainties only.
This results in the following cross sections:
σ170 GeV/c 2
t¯t = 7.9 ± 1.5 (stat) ± 1.6 (sys) ± 0.5 (lum) pb σ175 GeV/c
2
t¯t = 6.9 ± 1.3 (stat) ± 1.4 (sys) ± 0.4 (lum) pb The statistical uncertainty includes the statistical uncer-tainties associated with the signal and background tem-plates. The latter was determined by re-fitting the data 100,000 times while allowing the signal and background templates to vary according to their bin-to-bin statisti-cal uncertainties. The resulting uncertainties are sum-marized in Table II. Figure 14 shows the SM prediction together with the measured cross section from this
anal-ysis. The SM expectation [6] is in agreement with the measured cross sections.
V. CONCLUSIONS
We presented the inclusive t¯t cross section measured in 1 fb−1 of p¯p interactions at √s = 1.96 TeV. The cross section was extracted using high-multiplicity jet events, specifically events with at least six jets, two of them b tagged. A model of the multijet background was created from lower jet-multiplicity data. A likeli-hood discriminant was used to separate signal from
back-) 2 (GeV/c jj m 0 100 200 300 400 500 ) 2 events/(10 GeV/c 0 50 100 150 200 0 100 200 300 400 500 0 50 100 150 200
DØ
-1 Data, 1 fb Signal t t Background L < 0.2 Signal t t Background L < 0.2 ) 2 (GeV/c jj m 0 100 200 300 400 500 ) 2 events/(10 GeV/c 0 50 100 150 200 ) 2 (GeV/c jj m 0 100 200 300 400 500 ) 2 events/(10 GeV/c 0 50 100 150 200 (a) ) 2 (GeV/c jj m 0 100 200 300 400 500 ) 2 events/(10 GeV/c 0 100 200 300 400 500 0 100 200 300 400 500 0 100 200 300 400 500DØ
-1 Data, 1 fb Signal t t Background all L Signal t t Background all L ) 2 (GeV/c jj m 0 100 200 300 400 500 ) 2 events/(10 GeV/c 0 100 200 300 400 500 ) 2 (GeV/c jj m 0 100 200 300 400 500 ) 2 events/(10 GeV/c 0 100 200 300 400 500 (c) ) 2 (GeV/c jj m 0 100 200 300 400 500 ) 2 events/(10 GeV/c 0 50 100 0 100 200 300 400 500 0 50 100DØ
-1 Data, 1 fb Signal t t Background L > 0.8 Signal t t Background L > 0.8 ) 2 (GeV/c jj m 0 100 200 300 400 500 ) 2 events/(10 GeV/c 0 50 100 ) 2 (GeV/c jj m 0 100 200 300 400 500 ) 2 events/(10 GeV/c 0 50 100 (e) ) 2 (GeV/c bjj m 200 400 600 ) 2 events/(10 GeV/c 0 50 100 200 400 600 0 50 100DØ
-1 Data, 1 fb Signal t t Background L < 0.2 Signal t t Background L < 0.2 ) 2 (GeV/c bjj m 200 400 600 ) 2 events/(10 GeV/c 0 50 100 ) 2 (GeV/c bjj m 200 400 600 ) 2 events/(10 GeV/c 0 50 100 (b) ) 2 (GeV/c bjj m 200 400 600 ) 2 events/(10 GeV/c 0 50 100 150 200 250 200 400 600 0 50 100 150 200 250DØ
-1 Data, 1 fb Signal t t Background all L Signal t t Background all L ) 2 (GeV/c bjj m 200 400 600 ) 2 events/(10 GeV/c 0 50 100 150 200 250 ) 2 (GeV/c bjj m 200 400 600 ) 2 events/(10 GeV/c 0 50 100 150 200 250 (d) ) 2 (GeV/c bjj m 200 400 600 ) 2 events/(10 GeV/c 0 20 40 60 200 400 600 0 20 40 60DØ
-1 Data, 1 fb Signal t t Background L > 0.8 Signal t t Background L > 0.8 ) 2 (GeV/c bjj m 200 400 600 ) 2 events/(10 GeV/c 0 20 40 60 ) 2 (GeV/c bjj m 200 400 600 ) 2 events/(10 GeV/c 0 20 40 60 (f)FIG. 13: Distributions for the reconstructed W boson (top row) and top quark (bottom row) masses using the mt= 175 GeV/c2
signal sample. There are two entries per event. Displayed error bars represent statistical uncertainties only. (c, d) Result from the purity fit. (a, b) additionally requiring L < 0.2 to enhance background; (e, f) additionally requiring L > 0.8 to enhance signal.
TABLE II: Uncertainties on the t¯t cross section categorized by source for the result corresponding to mt = 175 GeV/c2.
The uncertainties with mt= 170 GeV/c2 are similar.
Source Uncertainty (%)
Candidate statistics ±18.5
Background model ±10.7
Background model statistics ±3.8
Signal model ±3.2
Signal model statistics ±0.5
Trigger −2.0 +3.9
Jet identification efficiency −2.5 +3.0
Jet taggability ±8.8
Jet energy calibration ±10.8
Jet energy resolution −3.1 +2.2
b tagging −8.6 +9.2
Total statistical uncertainty ±18.9
Total systematic uncertainty ±20.5
Luminosity uncertainty ±6.1
ground. The cross section was obtained from a likelihood fit to the discrimant distribution and was measured to be 7.9 ±2.2 pb assuming mt= 170 GeV/c2, and 6.9 ±2.0 pb assuming mt= 175 GeV/c2. Both results agree with the-oretical expectations.
Acknowledgments
We thank the staffs at Fermilab and collaborating institutions, and acknowledge support from the DOE and NSF (USA); CEA and CNRS/IN2P3 (France); FASI, Rosatom and RFBR (Russia); CNPq, FAPERJ, FAPESP and FUNDUNESP (Brazil); DAE and DST (In-dia); Colciencias (Colombia); CONACyT (Mexico); KRF and KOSEF (Korea); CONICET and UBACyT (Ar-gentina); FOM (The Netherlands); STFC and the Royal Society (United Kingdom); MSMT and GACR (Czech Republic); CRC Program, CFI, NSERC and WestGrid Project (Canada); BMBF and DFG (Germany); SFI (Ire-land); The Swedish Research Council (Sweden); and CAS and CNSF (China).
) 2 (GeV/c t m 165 170 175 180 (pb) tt σ 0 5 10 15
Moch and Uwer
PRD 78, 034003 (2008) -1 DØ, 1 fb ) 2 (GeV/c t m 165 170 175 180 (pb) tt σ 0 5 10 15 ) 2 (GeV/c t m 165 170 175 180 (pb) tt σ 0 5 10 15
FIG. 14: The measured t¯t production cross section (• mark-ers) together with the SM prediction (solid line) and uncer-tainty (dashed lines) [6]. Shown with the cross section mea-surements are the corresponding statistical uncertainty (inner error bars) and total uncertainty (outer error bars).
[c] Visitor from The University of Liverpool, Liverpool, UK. [d] Visitor from SLAC, Menlo Park, CA, USA.
[e] Visitor from Centro de Investigacion en Computacion -IPN, Mexico City, Mexico.
[f] Visitor from ECFM, Universidad Autonoma de Sinaloa, Culiac´an, Mexico.
[g] Visitor from Universit¨at Bern, Bern, Switzerland. [h] Visitor from Universit¨at Z¨urich, Z¨urich, Switzerland. [1] Tevatron Electroweak Working Group and CDF and D0
Collaborations, arXiv:0903.2503 [hep-ex].
[2] W.-M. Yao et al. [Particle Data Group], J. Phys. G 33, 1 (2006).
[3] M. Beneke et al., arXiv:hep-ph/0003033.
[4] V. M. Abazov et al. [D0 Collaboration], Phys. Rev. D 76, 072007 (2007).
[5] T. Aaltonon et al. [CDF Collaboration], Phys. Rev. D 76, 072009 (2007).
[6] S. Moch and P. Uwer. Phys. Rev. D 78, 034003 (2008). [7] N. Kidonakis and R. Vogt, Phys. Rev. D 78, 074005
(2008).
[8] T. Sj¨ostrand et al., Comput. Phys. Commun. 135, 238 (2001).
[9] G. Corcella et al., J. High Energy Phys. 0101, 010 (2001). [10] M. L. Mangano et al., J. High Energy Phys. 0307, 001
(2003).
[11] R. Field and R. C. Group, arXiv:hep-ph/0510198. [12] V. M. Abazov et al. [D0 Collaboration], Nucl. Instrum.
Methods in Phys. Res. A 565, 463 (2006).
[13] Pseudorapidity η is defined as η = − ln[tan(θ/2)], where θ is the polar angle with respect to the proton beam direction, with origin at the center of the detector. [14] S. Abachi et al. [D0 Collaboration], Nucl. Instrum.
Meth-ods in Phys. Res. A 338, 185 (1994).
[15] T. Andeen et al., FERMILAB-TM-2365 (2007).
[16] G.C. Blazey et al., in Proceedings of the Workshop:
QCD and Weak Boson Physics in Run II, edited by
U. Baur, R.K. Ellis, and D. Zeppenfeld, Fermilab-Pub-00/297 (2000).
[17] T. Speer et al., Nucl. Instrum. Methods in Phys. Res. A 566, 149 (2006).
[18] V. M. Abazov et al. [D0 Collaboration], Phys. Rev. D 74, 112004 (2006).
[19] Rapidity is defined as y = − ln[(E + pz)/(E − pz)], where
E is the energy and pzis the momentum along the proton
beam direction. φ is defined as the azimuthal angle in the plane transverse to the proton beam direction.
[20] J. Hegeman, J. Phys. Conf. Ser. 160, 012024 (2009). [21] T. Scanlon, Ph.D. thesis, Imperial College London
[Insti-tution Report No. FERMILAB-THESIS-2006-43, 2006]. [22] 6ET/HT4 was varied between 0.12 and 0.08, covering 68%
CL, to allow more or less phase space for additional jets. [23] Two top quark mass values were considered since the world-average mass varied between 170.9 ± 1.8 GeV/c2
and 174.2 ± 3.4 GeV/c2 during the time period covered
by this analysis.
[24] R. Brun and F. Carminati, CERN Program Library Long Writeup W5013, 1993 (unpublished).
[25] J. Pumplin et al., J. High Energy Phys. 0207, 012 (2002). [26] D. Stump et al., J. High Energy Phys. 0310, 046 (2003). [27] J. Pumplin et al., J. High Energy Phys. 0702, 053 (2007). [28] Y. Peters, K. Hamacher, and D. Wicke,
FERMILAB-TM-2425-E (2006).
[29] V. M. Abazov et al. [D0 Collaboration], Phys. Rev. D 78, 012005 (2008).
[30] V. M. Abazov et al. [D0 Collaboration], Phys. Rev. Lett. 100, 192004 (2008).
[31] V. M. Abazov et al. [D0 Collaboration], Phys. Lett. B 679, 177 (2009).
[32] A. Hocker et al., arXiv:physics/0703039.
[33] Aplanarity is defined as (3/2) λ3 and sphericity as
(3/2) (λ2+ λ3).
[34] F. James and M. Roos, Comput. Phys. Commun. 10, 343 (1975).
[35] R. Brun and F. Rademakers, Nucl. Instrum. Methods in Phys. Res. A 389, 81 (1997).
[36] V. M. Abazov et al. [D0 Collaboration], Phys. Rev. Lett. 103, 092001 (2009)
[37] D. Bourilkov, R. C. Group, and M. R. Whalley, arXiv:hep-ph/0605240.