Publisher’s version / Version de l'éditeur:
Vous avez des questions? Nous pouvons vous aider. Pour communiquer directement avec un auteur, consultez la première page de la revue dans laquelle son article a été publié afin de trouver ses coordonnées. Si vous n’arrivez pas à les repérer, communiquez avec nous à [email protected].
Questions? Contact the NRC Publications Archive team at
[email protected]. If you wish to email the authors directly, please see the first page of the publication for their contact information.
https://publications-cnrc.canada.ca/fra/droits
L’accès à ce site Web et l’utilisation de son contenu sont assujettis aux conditions présentées dans le site LISEZ CES CONDITIONS ATTENTIVEMENT AVANT D’UTILISER CE SITE WEB.
Procedia CIRP, 94, pp. 947-950, 2020-09-15
READ THESE TERMS AND CONDITIONS CAREFULLY BEFORE USING THIS WEBSITE.
https://nrc-publications.canada.ca/eng/copyright
NRC Publications Archive Record / Notice des Archives des publications du CNRC :
https://nrc-publications.canada.ca/eng/view/object/?id=f72bbcd6-b707-425a-8026-1bdc62b25478
https://publications-cnrc.canada.ca/fra/voir/objet/?id=f72bbcd6-b707-425a-8026-1bdc62b25478
NRC Publications Archive
Archives des publications du CNRC
This publication could be one of several versions: author’s original, accepted manuscript or the publisher’s version. / La version de cette publication peut être l’une des suivantes : la version prépublication de l’auteur, la version acceptée du manuscrit ou la version de l’éditeur.
For the publisher’s version, please access the DOI link below./ Pour consulter la version de l’éditeur, utilisez le lien DOI ci-dessous.
https://doi.org/10.1016/j.procir.2020.09.090
Access and use of this website and the material on it are subject to the Terms and Conditions set forth at
Preliminary machine learning analysis and high-speed thermographic
visualization of the laser polishing process
ScienceDirect
Available online at www.sciencedirect.com
Available online at www.sciencedirect.com
ScienceDirect
Procedia CIRP 00 (2017) 000–000
www.elsevier.com/locate/procedia
2212-8271 © 2017 The Authors. Published by Elsevier B.V.
Peer-review under responsibility of the scientific committee of the 28th CIRP Design Conference 2018.
28th CIRP Design Conference, May 2018, Nantes, France
A new methodology to analyze the functional and physical architecture of
existing products for an assembly oriented product family identification
Paul Stief *, Jean-Yves Dantan, Alain Etienne, Ali Siadat
École Nationale Supérieure d’Arts et Métiers, Arts et Métiers ParisTech, LCFC EA 4495, 4 Rue Augustin Fresnel, Metz 57078, France * Corresponding author. Tel.: +33 3 87 37 54 30; E-mail address: [email protected]
Abstract
In today’s business environment, the trend towards more product variety and customization is unbroken. Due to this development, the need of agile and reconfigurable production systems emerged to cope with various products and product families. To design and optimize production systems as well as to choose the optimal product matches, product analysis methods are needed. Indeed, most of the known methods aim to analyze a product or one product family on the physical level. Different product families, however, may differ largely in terms of the number and nature of components. This fact impedes an efficient comparison and choice of appropriate product family combinations for the production system. A new methodology is proposed to analyze existing products in view of their functional and physical architecture. The aim is to cluster these products in new assembly oriented product families for the optimization of existing assembly lines and the creation of future reconfigurable assembly systems. Based on Datum Flow Chain, the physical structure of the products is analyzed. Functional subassemblies are identified, and a functional analysis is performed. Moreover, a hybrid functional and physical architecture graph (HyFPAG) is the output which depicts the similarity between product families by providing design support to both, production system planners and product designers. An illustrative example of a nail-clipper is used to explain the proposed methodology. An industrial case study on two product families of steering columns of thyssenkrupp Presta France is then carried out to give a first industrial evaluation of the proposed approach.
© 2017 The Authors. Published by Elsevier B.V.
Peer-review under responsibility of the scientific committee of the 28th CIRP Design Conference 2018. Keywords: Assembly; Design method; Family identification
1. Introduction
Due to the fast development in the domain of communication and an ongoing trend of digitization and digitalization, manufacturing enterprises are facing important challenges in today’s market environments: a continuing tendency towards reduction of product development times and shortened product lifecycles. In addition, there is an increasing demand of customization, being at the same time in a global competition with competitors all over the world. This trend, which is inducing the development from macro to micro markets, results in diminished lot sizes due to augmenting product varieties (high-volume to low-volume production) [1]. To cope with this augmenting variety as well as to be able to identify possible optimization potentials in the existing production system, it is important to have a precise knowledge
of the product range and characteristics manufactured and/or assembled in this system. In this context, the main challenge in modelling and analysis is now not only to cope with single products, a limited product range or existing product families, but also to be able to analyze and to compare products to define new product families. It can be observed that classical existing product families are regrouped in function of clients or features. However, assembly oriented product families are hardly to find.
On the product family level, products differ mainly in two main characteristics: (i) the number of components and (ii) the type of components (e.g. mechanical, electrical, electronical).
Classical methodologies considering mainly single products or solitary, already existing product families analyze the product structure on a physical level (components level) which causes difficulties regarding an efficient definition and comparison of different product families. Addressing this Procedia CIRP 94 (2020) 947–950
2212-8271 © 2020 The Authors. Published by Elsevier B.V.
This is an open access article under the CC BY-NC-ND license (http://creativecommons.org/licenses/by-nc-nd/4.0/) Peer-review under responsibility of the Bayerisches Laserzentrum GmbH
10.1016/j.procir.2020.09.090
© 2020 The Authors. Published by Elsevier B.V.
This is an open access article under the CC BY-NC-ND license (http://creativecommons.org/licenses/by-nc-nd/4.0/) Peer-review under responsibility of the Bayerisches Laserzentrum GmbH
Available online at www.sciencedirect.com
ScienceDirect
Procedia CIRP 00 (2020) 000–000
www.elsevier.com/locate/procedia
2212-8271 © 2020 The Authors. Published by Elsevier B.V.
This is an open access article under the CC BY-NC-ND license (http://creativecommons.org/licenses/by-nc-nd/4.0/) Peer review statement: Peer-review under responsibility of the Bayerisches Laserzentrum GmbH
11th CIRP Conference on Photonic Technologies [LANE 2020] on September 7-10, 2020
Preliminary machine learning analysis and high-speed thermographic
visualization of the laser polishing process
Jack Beyfuss
a,b,†, Evgueni Bordatchev
b,a,†,*, O. Remus Tutunea-Fatan
a,b,*a Department of Mechanical and Materials Engineering, Western University, London, ON, N6A 5B9 Canada b National Research Council of Canada, 800 Collip Circle, London, ON, N6G 4X8 Canada
* Corresponding author. Tel.: +1-226-688-5604; fax: +1-519-430-7064. E-mail address: [email protected], [email protected]
Abstract
Laser polishing (LP) is an advanced manufacturing process for improving surface quality via laser remelting of the surface topography of the material. In this preliminary study, a high-speed thermographic imager was coaxially installed on a LP system and was used to capture the thermo-dynamics of the laser-material interactions under various process conditions. A visualization algorithm was developed and used to monitor the LP process dynamics along the laser path trajectory. This approach enables the analysis of LP process stability by means of reliable informational features of the individual images. Further, unsupervised machine learning analysis (Bayesian classifier) was used to reduce the number of informational variables/statistical characteristics of the images without compromising process predictability. These two techniques were applied for both monitoring and classification of the LP line experiments performed with a laser power of {5, 20, 35} W and a scanning speed of 75 mm/s. The preliminary results demonstrate the high potential of machine learning analysis towards the optimization and control of the LP process. © 2020 The Authors. Published by Elsevier B.V.
This is an open access article under the CC BY-NC-ND license (http://creativecommons.org/licenses/by-nc-nd/4.0/) Peer review statement: Peer-review under responsibility of the Bayerisches Laserzentrum GmbH
Keywords: laser polishing; thermographic imaging; on-line monitoring; machine learning; Bayesian classifier
1. Introduction
Laser polishing (LP) is an emerging manufacturing process that entails the use of laser radiation to melt the surface of functional parts such as tooling inserts [1-4]. During LP, workpiece material melts into a pool and solidifies rapidly into a smooth surface due to complex and overlapping thermodynamic phenomena induced by a constantly travelling laser beam. The quality of the post-LP surface critically depends on several process parameters, such as: laser power, travelling speed, focal distance, and track step over. The synergetic effect of these process parameters contributes to a thermodynamic equilibrium between solid, molten and resolidified material. Along these lines, several research studies have already emphasized the importance of the on-line monitoring of the actual temperature in the laser-material interaction zone. This information is needed for the identification of current process conditions and for further
control and optimization of the LP performance with respect to (wrt) desired and/or best achievable surface quality. Pyrometers have been commonly used for LP process monitoring and control [5, 6]. In this application, process temperature is continuously measured (possibly with a sampling frequency of 600 Hz) in the middle of the focal line and proportional-integral-derivative close-loop control is applied in real-time to laser power in order to maintain a constant surface temperature. Prior studies have shown that LP process temperature can be controlled within ±15…20 K.
Industry 4.0-based next generation manufacturing integrates cyber-physical systems, artificial intelligence, big data analysis, and modern manufacturing technologies with advanced laser processing [7]. Among the numerous technological examples developed and implemented so far, high-speed midwave-infrared (MWIR) camera has been used to monitor and evaluate the laser welding process [8]. For this purpose, a MWIR camera was mounted coaxially with laser
948 Jack Beyfuss et al. / Procedia CIRP 94 (2020) 947–950 2 O. Remus Tutunea-Fatan / Procedia CIRP 00 (2020) 000–000
welding optics and it was used to record thermographic images of the process with a sampling frequency of 500 Hz and within a field of view of 9x9 mm2. From there, principal component analysis under a concept of unsupervised machine learning and image geometry-based parameters were used to extract the image features characterized by a high informational/data analysis value. In this context, it was found that the analyzed geometrical features were highly sensitive to the changes of the experimental conditions and thereby allowed detection and separation of the investigated welding defects with 99.9% accuracy. This welding-focused approach seems suitable to the LP process, especially since the thermodynamic performance of laser-material interactions as well as their thermographic imaging exhibit significant similarities.
The present feasibility study is focused on the thermographic imaging, visualization, analysis, and machine learning-based classification (e.g., Bayesian) of the LP process. Several LP experiments were performed under various process parameters while thermographic images of the laser-material interaction zone were recorded at a high-speed (> 3 kHz). The captured images were then restructured into a spatial 2D process visualization. Furthermore, several image geometry-based features were extracted to evaluate the LP process performance wrt the laser power. Building upon the acquired knowledge, a Bayesian classifier [9] was used to demonstrate the ability to perform unsupervised LP process monitoring, optimization, and control.
2. LP experimental set-up
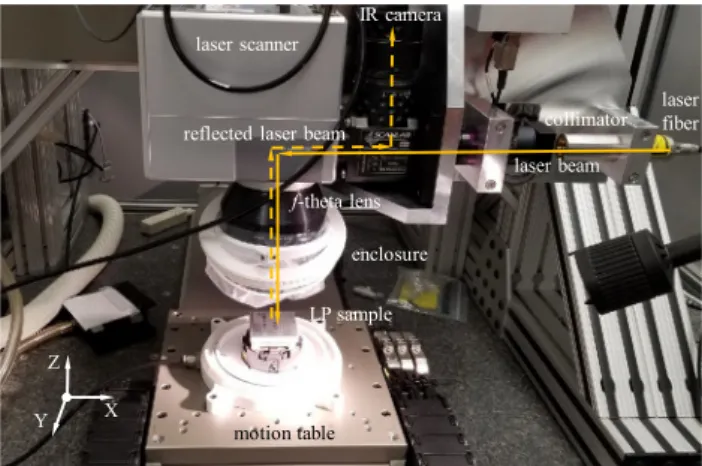
Fig. 1 shows a picture of the LP experimental setup consisting of laser, laser beam delivery optics, laser scanner, and 3-axis motion system. The continuous wave fiber laser (YLR-100-SM-CS, from IPG Photonics Inc., USA), having a maximum power of 100 W, was operated with a wavelength of 1070 nm. Laser beam was collimated and delivered to a 2D galvanometric laser scanner (exelliSCAN 14, from SCANLAB GmbH, Germany) equipped with a 254 mm scan f-theta lens. A camera adapter was placed between the collimator and laser scanner where interchangeable optical and thermographic cameras were mounted. The optical camera was used for visual alignment and precise setting of the laser beam and workpiece. Thermographic imaging was performed using a MWIR camera (TACHYON 16K, New Infrared Technologies, S.L., Spain) capable of acquiring 128x128 pixels images with a maximum of 2000 fps within a wavelength ranging between 1 and 5 µm.
The 55x55x5 mm3 workpiece made of H13 tooling steel was mechanically mounted on a System 3R (from Mikron AGIE Charmilles AG, Switzerland) rapid-clamping feature attached to a Y-axis linear stage. This clamping arrangement enables an advanced ability to position/reposition the workpiece with high repeatability (±1 µm) required for pre- and post-LP surface topography acquisition. In addition, the pre-ground workpiece top surface was aligned along the X- and Y-axes within a ±2 µm deviation by means of a touch probe caliper. To create an oxygen-free processing zone, a constant flow of Ar was directed to the laser-material interaction zone. The 3-axis motion system was made of two linear drives operating along X- and Y-axes and a ball-screw driven Z-axis.
Fig. 1. Experimental set-up.
The laser scanner and optics were mounted on X- and Z-axes and attached to the granite bridge. The workpiece was located on Y-axis and was affixed to a granite table for enhanced thermal stability. All electronic components (motion controllers, laser scanner and laser control unit) were connected to the main motion control unit (Aerotech, Inc., USA).
3. Thermographic image analysis methodology
The thermographic image analysis was divided in three processing steps. At first, LP experiments were performed in such a way that three sets of three 5 mm long lines were polished with scanning speeds of {25, 50, 75} mm/s and laser powers of {5, 20, 35} W, however only experiments with a scanning speed of 75 mm/s were analyzed in this preliminary study. The LP process was recorded with the Tachyon MWIR camera/software for each set of LP lines. Image acquisition was performed with a sampling rate of over 3000 fps and a frame size of 64x64 pixels. The acquired data was saved into a file with a particular structure of common parameters (i.e., temperature range) and comprised of image frames and corresponded time stamps.
The second phase of thermographic image analysis was allotted to the determination of the informational features to be used for further process analysis and classification. In the context of the present feasibility study, only areal image projection (e.g., representing an area of the laser-material interactions including melt pool and heat affected zone) was used. By contrast, spatial and amplitude parameters of the thermographic images were intentionally left out for future analysis. In a more general sense, this step represents nothing but a dimension reduction from a 64x64 data matrix associated with each image to a vector characterized by few informational features. This transformation is important for the augmentation of the computational efficiency as well as for the subsequent on-linemonitoring,optimization, and control of the LP process. Fig. 2 depicts definitions of the temperature contour-based informational features for each image frame. Mathematically, the temperature contour was defined as a 64x64 binary matrix for each of the N thermographic images (after the application of a certain temperature threshold Ttr) as
1, ( , ) ( , ) , 1 64, 1 0, ( , )k tr k k tr when T i j T h i j i, j k N when T i j T ≥ = = … = … < (1) laser fiber LP sample f-theta lens enclosure X motion table laser scanner IR camera collimator Z Y laser beam reflected laser beam
O. Remus Tutunea-Fatan / Procedia CIRP 00 (2020) 000–000 3
Fig. 2. Definition of the temperature contour-based informational features.
It was evident that each temperature contour h(i,j) has an elliptical shape and therefore three most obvious informational features can be used, such as
• area of laser-material interaction zone: ,
( , ), 1 64, 1 N
k k
i j
A =
∑
h i j i, j= … k= … , (2) • length of the laser-material interaction zone calculatedfrom longitudinal temperature profile: ,
( , ), 1 64,
, 1 N
k k k max
i
s
=
∑
h i j i
= …
j of T
k
= …
, (3) • width of the laser-material interaction zone calculated fromtransversal temperature profile: ,
( , ), 1 64, , 1 N
k k k max
j
w =
∑
h i j j= … i of T k= … . (4) During the third phase, a MATLAB-based function was developed to extract all informational features defined in Eqs. 2-4 for each LP experiment. To achieve this, these features were rearranged from a frame-driven index (k = 1…N) into a discrete function related to the travel distance of 5 mm for each LP line. This was accomplished by using a timestamp and a constant scanning speed, a method that enabled the ability to synchronize experimental data in space (i.e., along the LP line) instead of the time domain. Moreover, the data associated with the first and last 0.5 mm of each LP line was removed in an attempt to eliminate any transient behavior as well as to ensure reliable analysis of the steady LP process only. The resulting A(x), s(x), w(x) data were further used for the LP process visualization, analysis, and Bayesian classification.4. Visualization of LP process performance
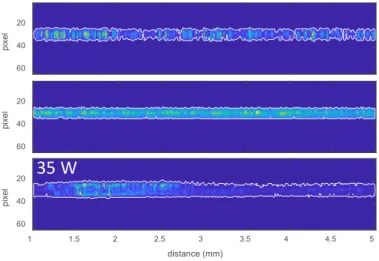
In order to visualize the LP process, the transversal temperature profile hk(i,•) extracted from each k-frame at Tmax
(and all profiles) was generated as a function of the travel distance. Fig. 3 illustrates an image-based LP process visualization characterized by {5, 20, 35} W laser power and 75 mm/s travel speed. At 5 W laser power, the contour of the molten pool/heat affected zone envelope appeared jagged with a highly non-uniform boundary. This is most likely a consequence of the shallow surface melting phenomenon that is inevitably present at low laser power levels.
Fig. 3. LP process visualization with {5, 20, 35} W laser power and 75 mm/s.
By contrast, LP process appears to be more stable at 20 W (more uniform and consistent boundaries of the temperature envelope). Finally, significant variations in the thermodynamic equilibrium of the LP process are present at 35 W and they appear to significantly influence the formation of instabilities in the polished surface topography. Two additional observations can be made in this high power case: i) the temperature envelope is characterized by low frequency variations of its boundaries, and ii) occasional flares in the temperature and contour area are present. This latter aspect may represent an indicator of the LP quality and performance related to the initial surface topography, process parameters, physical-mechanical properties of the workpiece material as well as polished surface topography.
5. Analysis of LP using defined informational features
Fig. 4 shows the functional variation of the informational features defined in Section 3 (i.e., A(x), s(x), and w(x)) that are characteristic to the laser-material interaction zone associated with the three LP lines made with {5, 20, 35} W laser power and 75 mm/s travel speed. Clearly, the geometric properties introduced in Section 3 are strongly correlated with the applied laser power. All three analyzed informational features exhibit a similar behavior wrt laser power: a) the actual values become higher when laser power increases, b) value-power functional is nonlinear: the increase from 20 W to 35 W is significantly larger that from 5 W to 20 W, c) visually/qualitatively, their spatial signature along LP line length correlates with process visualization (Fig. 3), and d) these features are interdependent as their signatures appear to be very similar.
6. Bayesian classification of the applied laser power
In order to determine the applicability of the three analyzed informational features (A(x), s(x), w(x)) for machine learning-based monitoring, optimization and control of the LP process, a classic pattern recognition analysis (aka Bayesian classifier) [9] was applied. In broad strokes, pattern recognition analysis is based on the linear discriminant theory and enables the selection of the best combination of informational features within the n-dimensional informational space. This is meant to
10 20 30 40 50 60 x pixels 10 20 30 40 50 60 y pixels
primary
length s(y)
secondary
length w(x)
x, pix y, p ixtemperature
contour h(x, y)
longitudinal
temperature
profile
transversal
temperature
profile
T
max 1 1.5 2 2.5 3 3.5 4 4.5 5 distance (mm) 20 40 60 pixel 1 1.5 2 2.5 3 3.5 4 4.5 5 distance (mm) 20 40 60 pixel 1 1.5 2 2.5 3 3.5 4 4.5 5 distance (mm) 20 40 60 pixel35 W
Jack Beyfuss et al. / Procedia CIRP 94 (2020) 947–950 949 2 O. Remus Tutunea-Fatan / Procedia CIRP 00 (2020) 000–000
welding optics and it was used to record thermographic images of the process with a sampling frequency of 500 Hz and within a field of view of 9x9 mm2. From there, principal component analysis under a concept of unsupervised machine learning and image geometry-based parameters were used to extract the image features characterized by a high informational/data analysis value. In this context, it was found that the analyzed geometrical features were highly sensitive to the changes of the experimental conditions and thereby allowed detection and separation of the investigated welding defects with 99.9% accuracy. This welding-focused approach seems suitable to the LP process, especially since the thermodynamic performance of laser-material interactions as well as their thermographic imaging exhibit significant similarities.
The present feasibility study is focused on the thermographic imaging, visualization, analysis, and machine learning-based classification (e.g., Bayesian) of the LP process. Several LP experiments were performed under various process parameters while thermographic images of the laser-material interaction zone were recorded at a high-speed (> 3 kHz). The captured images were then restructured into a spatial 2D process visualization. Furthermore, several image geometry-based features were extracted to evaluate the LP process performance wrt the laser power. Building upon the acquired knowledge, a Bayesian classifier [9] was used to demonstrate the ability to perform unsupervised LP process monitoring, optimization, and control.
2. LP experimental set-up
Fig. 1 shows a picture of the LP experimental setup consisting of laser, laser beam delivery optics, laser scanner, and 3-axis motion system. The continuous wave fiber laser (YLR-100-SM-CS, from IPG Photonics Inc., USA), having a maximum power of 100 W, was operated with a wavelength of 1070 nm. Laser beam was collimated and delivered to a 2D galvanometric laser scanner (exelliSCAN 14, from SCANLAB GmbH, Germany) equipped with a 254 mm scan f-theta lens. A camera adapter was placed between the collimator and laser scanner where interchangeable optical and thermographic cameras were mounted. The optical camera was used for visual alignment and precise setting of the laser beam and workpiece. Thermographic imaging was performed using a MWIR camera (TACHYON 16K, New Infrared Technologies, S.L., Spain) capable of acquiring 128x128 pixels images with a maximum of 2000 fps within a wavelength ranging between 1 and 5 µm.
The 55x55x5 mm3 workpiece made of H13 tooling steel was mechanically mounted on a System 3R (from Mikron AGIE Charmilles AG, Switzerland) rapid-clamping feature attached to a Y-axis linear stage. This clamping arrangement enables an advanced ability to position/reposition the workpiece with high repeatability (±1 µm) required for pre- and post-LP surface topography acquisition. In addition, the pre-ground workpiece top surface was aligned along the X- and Y-axes within a ±2 µm deviation by means of a touch probe caliper. To create an oxygen-free processing zone, a constant flow of Ar was directed to the laser-material interaction zone. The 3-axis motion system was made of two linear drives operating along X- and Y-axes and a ball-screw driven Z-axis.
Fig. 1. Experimental set-up.
The laser scanner and optics were mounted on X- and Z-axes and attached to the granite bridge. The workpiece was located on Y-axis and was affixed to a granite table for enhanced thermal stability. All electronic components (motion controllers, laser scanner and laser control unit) were connected to the main motion control unit (Aerotech, Inc., USA).
3. Thermographic image analysis methodology
The thermographic image analysis was divided in three processing steps. At first, LP experiments were performed in such a way that three sets of three 5 mm long lines were polished with scanning speeds of {25, 50, 75} mm/s and laser powers of {5, 20, 35} W, however only experiments with a scanning speed of 75 mm/s were analyzed in this preliminary study. The LP process was recorded with the Tachyon MWIR camera/software for each set of LP lines. Image acquisition was performed with a sampling rate of over 3000 fps and a frame size of 64x64 pixels. The acquired data was saved into a file with a particular structure of common parameters (i.e., temperature range) and comprised of image frames and corresponded time stamps.
The second phase of thermographic image analysis was allotted to the determination of the informational features to be used for further process analysis and classification. In the context of the present feasibility study, only areal image projection (e.g., representing an area of the laser-material interactions including melt pool and heat affected zone) was used. By contrast, spatial and amplitude parameters of the thermographic images were intentionally left out for future analysis. In a more general sense, this step represents nothing but a dimension reduction from a 64x64 data matrix associated with each image to a vector characterized by few informational features. This transformation is important for the augmentation of the computational efficiency as well as for the subsequent on-linemonitoring,optimization, and control of the LP process. Fig. 2 depicts definitions of the temperature contour-based informational features for each image frame. Mathematically, the temperature contour was defined as a 64x64 binary matrix for each of the N thermographic images (after the application of a certain temperature threshold Ttr) as
1, ( , ) ( , ) 0, ( , )k tr , 1 64, 1 k k tr when T i j T h i j i, j k N when T i j T ≥ = = … = … < (1) laser fiber LP sample f-theta lens enclosure X motion table laser scanner IR camera collimator Z Y laser beam reflected laser beam
O. Remus Tutunea-Fatan / Procedia CIRP 00 (2020) 000–000 3
Fig. 2. Definition of the temperature contour-based informational features.
It was evident that each temperature contour h(i,j) has an elliptical shape and therefore three most obvious informational features can be used, such as
• area of laser-material interaction zone: ,
( , ), 1 64, 1 N
k k
i j
A =
∑
h i j i, j= … k= … , (2) • length of the laser-material interaction zone calculatedfrom longitudinal temperature profile: ,
( , ), 1 64,
, 1 N
k k k max
i
s
=
∑
h i j i
= …
j of T
k
= …
, (3) • width of the laser-material interaction zone calculated fromtransversal temperature profile: ,
( , ), 1 64, , 1 N
k k k max
j
w =
∑
h i j j= … i of T k= … . (4) During the third phase, a MATLAB-based function was developed to extract all informational features defined in Eqs. 2-4 for each LP experiment. To achieve this, these features were rearranged from a frame-driven index (k = 1…N) into a discrete function related to the travel distance of 5 mm for each LP line. This was accomplished by using a timestamp and a constant scanning speed, a method that enabled the ability to synchronize experimental data in space (i.e., along the LP line) instead of the time domain. Moreover, the data associated with the first and last 0.5 mm of each LP line was removed in an attempt to eliminate any transient behavior as well as to ensure reliable analysis of the steady LP process only. The resulting A(x), s(x), w(x) data were further used for the LP process visualization, analysis, and Bayesian classification.4. Visualization of LP process performance
In order to visualize the LP process, the transversal temperature profile hk(i,•) extracted from each k-frame at Tmax
(and all profiles) was generated as a function of the travel distance. Fig. 3 illustrates an image-based LP process visualization characterized by {5, 20, 35} W laser power and 75 mm/s travel speed. At 5 W laser power, the contour of the molten pool/heat affected zone envelope appeared jagged with a highly non-uniform boundary. This is most likely a consequence of the shallow surface melting phenomenon that is inevitably present at low laser power levels.
Fig. 3. LP process visualization with {5, 20, 35} W laser power and 75 mm/s.
By contrast, LP process appears to be more stable at 20 W (more uniform and consistent boundaries of the temperature envelope). Finally, significant variations in the thermodynamic equilibrium of the LP process are present at 35 W and they appear to significantly influence the formation of instabilities in the polished surface topography. Two additional observations can be made in this high power case: i) the temperature envelope is characterized by low frequency variations of its boundaries, and ii) occasional flares in the temperature and contour area are present. This latter aspect may represent an indicator of the LP quality and performance related to the initial surface topography, process parameters, physical-mechanical properties of the workpiece material as well as polished surface topography.
5. Analysis of LP using defined informational features
Fig. 4 shows the functional variation of the informational features defined in Section 3 (i.e., A(x), s(x), and w(x)) that are characteristic to the laser-material interaction zone associated with the three LP lines made with {5, 20, 35} W laser power and 75 mm/s travel speed. Clearly, the geometric properties introduced in Section 3 are strongly correlated with the applied laser power. All three analyzed informational features exhibit a similar behavior wrt laser power: a) the actual values become higher when laser power increases, b) value-power functional is nonlinear: the increase from 20 W to 35 W is significantly larger that from 5 W to 20 W, c) visually/qualitatively, their spatial signature along LP line length correlates with process visualization (Fig. 3), and d) these features are interdependent as their signatures appear to be very similar.
6. Bayesian classification of the applied laser power
In order to determine the applicability of the three analyzed informational features (A(x), s(x), w(x)) for machine learning-based monitoring, optimization and control of the LP process, a classic pattern recognition analysis (aka Bayesian classifier) [9] was applied. In broad strokes, pattern recognition analysis is based on the linear discriminant theory and enables the selection of the best combination of informational features within the n-dimensional informational space. This is meant to
10 20 30 40 50 60 x pixels 10 20 30 40 50 60 y pixels
primary
length s(y)
secondary
length w(x)
x, pix y, p ixtemperature
contour h(x, y)
longitudinal
temperature
profile
transversal
temperature
profile
T
max 1 1.5 2 2.5 3 3.5 4 4.5 5 distance (mm) 20 40 60 pixel 1 1.5 2 2.5 3 3.5 4 4.5 5 distance (mm) 20 40 60 pixel 1 1.5 2 2.5 3 3.5 4 4.5 5 distance (mm) 20 40 60 pixel35 W
950 Jack Beyfuss et al. / Procedia CIRP 94 (2020) 947–950 4 O. Remus Tutunea-Fatan / Procedia CIRP 00 (2020) 000–000
Fig. 4. Functional dependence of informational features wrt the laser power.
provide mathematical rules as linear decision functions to be embedded into control hardware for real-time monitoring, diagnostics and control of the LP process. Three Bayesian classifiers were computed for the informational spaces {A(x), s(x)}, {A(x), w(x)}, and {s(x), w(x)}, with a quality of classification of 79.3%, 84.9%, and 78.2%, respectively. The classification results are presented in Fig. 5.
7. Summary and conclusions
This study demonstrates both the feasibility and applicability of high-speed thermographic imaging for visualization, analysis, and machine learning-based Bayesian classification of the LP process. In this context, several conclusions became apparent:
• The three proposed informational features reliably correlate with laser power variations and they can be used in the Bayesian classification for on-line monitoring, optimization, and control of the LP process. • Pattern recognition analysis grants the ability to choose
the most adequate informational features
• This study sets the informational foundation towards the future integration of the LP process into the Industry 4.0 framework
Acknowledgements
This study is the result of collaboration between the National
Fig. 5. Bayesian classifiers for {A(x), s(x)}, {A(x), w(x)}, and {s(x), w(x)}.
Research Council of Canada (London, Ontario) and Western University (London, Ontario). Partial financial support was also provided by the Natural Sciences and Engineering Research Council (NSERC) of Canada.
†these authors contributed equally to this study
References
[1] Willenborg E. Polishing with laser radiation. In: Poprawe R, editor: Tailored Light 2: Laser Allication Technology; 2011. p. 196-202. [2] Temmler A, Willenborg E, Wissenbach K. Laser polishing. Proceedings
of SPIE 2012; vol. 8243, paper 82430W, 13 p.
[3] Pfefferkorn FE, Duffie NA, Li X, Vadali M, Ma C. Improving surface finish in pulsed laser micro polishing using thermocapillary flow. CIRP Annals – Manuf Tech 2013;62:203-6.
[4] Bordatchev EV, Hafiz AMK, Tutunea-Fatan OR. Performance of laser polishing in finishing of metallic surfaces. International Journal of Advanced Manufacturing Technologies 2014;73:35–52.
[5] Heidrich S, Richmann A, Schmitz P, Willenborg E, Wissenbach K, Loosen P, Poprawe R. Optics manufacturing by laser radiation, Optics and Lasers in Engineering 2014;59:34-40
[6] Weigarten C, Schmickler A, Willenborg E, Wissenbach K. Laser polishing and laser shape correction of optical glass, Journal of laser applications 2017;29(1): paper 011702, 9 p.
[7] Lotzman T, Wenzel F, Karsunke U, Kozak, K. For Industry 4-0, visualization and machine learning can be combined to enhance laser processing. Laser Focus World 2017;January:87-9.
[8] Knaak C, Thombansen U, Abels P, Kröger M. Machine learning as a comparative tool to determine the relevance of signal features in laser welding. Procedia CIRP 2018;74:623-7
[9] Tou JT, Gonzalez RC. Pattern recognition principles. Addison-Wesley, Reading, MA, 1974. 0 1 2 3 4 5 distance (mm) 0 100 200 300 400
spot area (pixels)
5W 20W 35W 0 1 2 3 4 5 distance (mm) 0 5 10 15 20 25
spot area (pixels)
y g 5W 20W 35W 0 1 2 3 4 5 distance (mm) 0 5 10 15 20
spot area (pixels)
Seco da y e gt at a ous o e s 5 /s 5W 20W 35W wi dth , p ix a) b) c) 0 10 20 30 0 100 200 300 400 le ng th, pi x area, pix2 5 W 20 W 35 W 2 4 6 8 10 12 14 16 18 20 0 100 200 300 400 w idt h, pi x area, pix2 5 W 20 W 35 W a) b) 2 4 6 8 10 12 14 16 18 20 0 10 20 30 w idt h, pi x length, pix 5 W 20 W 35 W c)