HAL Id: hal-02623317
https://hal.inrae.fr/hal-02623317
Submitted on 26 May 2020
HAL is a multi-disciplinary open access
archive for the deposit and dissemination of
sci-entific research documents, whether they are
pub-lished or not. The documents may come from
teaching and research institutions in France or
abroad, or from public or private research centers.
L’archive ouverte pluridisciplinaire HAL, est
destinée au dépôt et à la diffusion de documents
scientifiques de niveau recherche, publiés ou non,
émanant des établissements d’enseignement et de
recherche français ou étrangers, des laboratoires
publics ou privés.
Distributed under a Creative Commons Attribution| 4.0 International License
Prospect for increasing grain legume crop production in
East Africa
Marloes P. van Loon, Nanyan Deng, Patricio Grassini, Juan I. Rattalino
Edreira, Endalkachew Wolde-Meskel, Frederick Baijukya, Hélène Marrou,
Martin K. van Ittersum
To cite this version:
Marloes P. van Loon, Nanyan Deng, Patricio Grassini, Juan I. Rattalino Edreira, Endalkachew
Wolde-Meskel, et al.. Prospect for increasing grain legume crop production in East Africa. European Journal
of Agronomy, Elsevier, 2018, 101, pp.140-148. �10.1016/j.eja.2018.09.004�. �hal-02623317�
Contents lists available atScienceDirect
European Journal of Agronomy
journal homepage:www.elsevier.com/locate/eja
Prospect for increasing grain legume crop production in East Africa
Marloes P. van Loon
a,⁎,1, Nanyan Deng
b,c,1, Patricio Grassini
c, Juan I. Rattalino Edreira
c,
Endalkachew Wolde-meskel
d, Frederick Baijukya
e, Hélène Marrou
f, Martin K. van Ittersum
aaPlant Production Systems Group, Wageningen University, P.O. Box 430, 6700AK Wageningen, the Netherlands
bNational Key Laboratory of Crop Genetic Improvement, MOA Key Laboratory of Crop Ecophysiology and Farming System in the Middle Reaches of the Yangtze River, College of Plant Science and Technology, Huazhong Agricultural University, No. 1 Shizishan Street, Hongshan District, Wuhan, Hubei 430070, China
cDepartment of Agronomy and Horticulture, University of Nebraska-Lincoln, Lincoln, NE 68583-0915, USA dInternational Livestock Research Institute, P.O. Box 5689, Addis Ababa, Ethiopia
eInternational Institute of Tropical Agriculture (IITA), P. O. Box 34441, Dar es Salaam, Tanzania fSYSTEM, Montpellier SupAgro, INRA, CIRAD, IAMM, Univ. Montpellier, Montpellier France
A R T I C L E I N F O Keywords: Yield potential Yield gap Legumes Sub-Saharan Africa Common bean Cowpea Groundnut Chickpea Pigeonpea Food self-sufficiency A B S T R A C T
Agricultural production in East Africa (E-Afr) has to increase drastically to meet future food demand. Yield gap assessment provides important information on the degree to which production can be increased on existing cropland. Most research on yield gap analysis has focussed on cereal crops, while legumes have received less attention despite of their relatively large area, and their importance as source of protein in smallholder farming systems in E-Afr. The objectives of this study were to (i) estimate water-limited yield potential (Yw) and yield
gaps (Yg) for major grain legume crops in E-Afr, and (ii) estimate how narrowing the current legume Ygcan
contribute to food self-sufficiency by the year 2050. We focussed on Ethiopia, Kenya, and Tanzania, and five legumes crops including chickpea, common bean, cowpea, groundnut, and pigeonpea. A bottom-up approach which entails that local weather, soil and agronomic data was used as input for crop modelling (SSM-legumes) in a spatial framework, to estimate Yw, actual on-farm yield (Ya), and Ygfrom local to regional scale. Future legume
self-sufficiency was assessed for 2050 demand assuming different Ygclosure scenarios. On average, Yawas 25%
of Ywacross all legume-county combinations, being 15% for Kenya, 23% for Tanzania and 41% for Ethiopia. On
average, common bean had the largest Ygof 2.6 Mg ha−1and chickpea the smallest (1.4 Mg ha−1). Closure of the
exploitable Yg(i.e., 80% of Yw) can help to meet future legume demand in both Kenya and Tanzania, while it
seems not to be sufficient in Ethiopia.
1. Introduction
About 220 million people suffer from chronic hunger in sub-Saharan Africa (SSA) (United-Nations, 2016). East Africa (E-Afr) is the most populated region, accounting for around 42% of SSA population. Pre-vious assessments on the potential to increase food production in E-Afr indicated that domestic grain demand is not met with current produc-tion, and food scarcity is expected to be exacerbated in the future, driven by high population growth and changes in diets (van Ittersum et al., 2016).
Yield potential (Yp) is the yield achieved by a well-adapted cultivar
without water and nutrient limitations and no yield reduction due to incidence of weeds, insect pests, and diseases (Cassman et al., 2003;
Van Ittersum and Rabbinge, 1997). Yp is determined by
growth-defining factors, i.e. temperature, radiation, CO2and genetic traits of a
crop cultivar. In rainfed conditions, water-limited yield potential (Yw) is
determined, next to growth-defining factors, by water supply amount and distribution, and by soil properties influencing the crop water balance, such as rootable soil depth, available water holding capacity, and terrain slope. Understanding how much extra food can be produced on existing (rainfed) cropland is thefirst step towards reducing the yield gap (Yg), i.e., the difference between Ywand average farmer yield
(Ya).
Most research on Yganalysis in E-Afr (and elsewhere) has focussed
on cereal crops (e.g. Gobbett et al., 2016; Kassie et al., 2014; van Ittersum et al., 2016), while grain legumes have received little attention (e.g. Aramburu-Merlos et al., 2015;Sinclair et al., 2014;Soltani et al., 2016), despite their relatively large area (ca. 20% of cropland area in
https://doi.org/10.1016/j.eja.2018.09.004
Received 24 May 2018; Received in revised form 7 September 2018; Accepted 11 September 2018
⁎Corresponding author. 1Sharedfirst authorship.
E-mail address:marloes.vanloon@wur.nl(M.P. van Loon).
Available online 25 September 2018
1161-0301/ © 2018 The Authors. Published by Elsevier B.V. This is an open access article under the CC BY license (http://creativecommons.org/licenses/BY/4.0/).
Ethiopia, Kenya and Tanzania (FAO, 2018)) and their importance as source of protein, energy, vitamins, and minerals of poor farmers in SSA (Giller et al., 2013; Temba et al., 2016). Opportunities exist for in-tensifying grain legume crop production in E-Afr (Giller, 2001;Franke et al., 2017), because legumesfix atmospheric N and thereby also have benefits for other crops. For example, legume crops may enhance yield of cereal crops within the sequence by improving N nutrition of this subsequent crop (e.g.Franke et al., 2008,2017;Giller, 2001;Kamanga et al., 2010; Ojiem et al., 2014; Sanginga, 2003). However, there is clearly a dearth of knowledge in relation with the potential for legume crops production increase in E-Afr.
The objectives of this study were to (i) calculate water-limited yield potential (Yw) and yield gaps for major legume crops in E-Afr, and (ii)
estimate how narrowing the current legume yield gap can contribute to food self-sufficiency in the region. We focussed here on three countries, Ethiopia, Kenya and Tanzania, andfive legumes crops, chickpea (Cicer arietinum L.), common bean (Phaseolus vulgaris L.), cowpea (Vigna un-guiculata (L.) Walp.), groundnut (Arachis hypogaea L.) and pigeonpea (Cajanus cajan (L.) Millsp.).
2. Material and methods
2.1. Description of legume cropping systems in East Africa
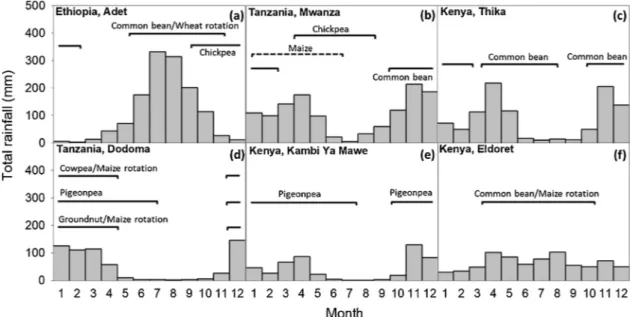
We performed yield-gap analysis for five grain legume crops (chickpea, common bean, cowpea, groundnut, and pigeonpea) for three countries in E-Afr (Ethiopia, Kenya, and Tanzania), considering, for each crop, only countries with an annual harvested area≥50,000 ha. These three countries account for 50% and 16% of area sown with these five crops in E-Afr and SSA, respectively. Selected crop-country com-binations included common bean (Ethiopia, Kenya, and Tanzania), chickpea (Ethiopia and Tanzania), pigeonpea (Kenya and Tanzania), cowpea (Tanzania), and groundnut (Tanzania) (Table 1). Overall, common bean is the most important legume crop in the region with ca. 2 million ha across the three countries (FAO, 2018). We focus on bush bean only, as this is the main common bean variety sown in E-Afr. Chickpea is mainly grown in north-west and central Ethiopia and in some regions in north Tanzania, while groundnuts, pigeonpea, and cowpea are mostly grown in Tanzania and/or Kenya (Fig. S1). To il-lustrate the legume cropping system in E-Afr,Fig. 1shows dominant legume-based crop sequences at six selected locations in Ethiopia, Tanzania, and Kenya. In most cases, legume crops are rotated with cereal crops (e.g., teff, maize, sorghum, and rice) and are grown during the wet season for a period of 4–5 months. An exception is chickpea, which is commonly sown by the end of the wet season, growing mostly during the dry season and relying on the residual soil water (Fig. 1a). Another exception is pigeonpea in Kenya, where it is sown all year round, with a crop cycle ranging from 8 to 10 months (Fig. 1e).
2.2. Site selection and data sources
We followed the protocols of the Global Yield Gap Atlas (www. yieldgap.org) to determine Ywand Ygfor legume crops in Ethiopia,
Kenya, and Tanzania (Grassini et al., 2015b;van Bussel et al., 2015). Briefly, we selected sites for each crop-country combination based on (i) a climate zone (CZ) scheme that accounts for variation in growing degree days, temperature seasonality, and aridity index (Van Wart et al., 2013), (ii) distribution of crop area as reported by SPAM 2005 maps (You et al., 2014a,2014b), and (iii) availability of meteorological stations with daily weather data. Within each country, CZs with > 5% of total national harvested area for each crop were selected. Within each CZ, a 100-km radius‘buffer’ surrounding each weather station was created and clipped by the borders of the CZ to ensure that the buffer zone is located within a unique CZ. Buffer zones were sequentially se-lected based on their contribution to national crop harvested area until ca. 50% national crop area coverage was achieved. If needed, addi-tional buffers were added to include regions with high crop area density but without a weather station. In our set of 3 countries, there were 14, 22, 11, 10 and 13 buffers selected for, in the same order, chickpea, common bean, cowpea, groundnut and pigeonpea. In turn, these buffers were located in, respectively, 6, 11, 7, 6, and 6 different climate zones, which, overall, accounted for respectively 52, 43, 75, 89, and 70% of E-Afr harvested area with these crops.
In the selected buffers, long-term (1998–2012) daily weather data were retrieved from the National Meteorology Agency of Ethiopia (NMA, 1998), Tanzania Meteorological Agency (TMA, 1998-2012;
TMA, 1998), and Kenya Meteorological Department (KMD, 1998-, 2012KMD, 1998KMD, 1998-, 2012). Since 52% of the buffers had less than 10 years of weather data but at least 3 years, long weather data records were generated using the method described byVan Wart et al. (2015). In short, this method corrects long-term daily gridded NASA-POWER maximum and minimum temperature based on correlations between measured and gridded weather and uses uncorrected NASA-POWER solar radiation and TRMM rainfall to generate long-term syn-thetic weather files. Finally, for buffer zones without any measured weather data (48% of total buffers), we used uncorrected gridded weather data from NASA-POWER.
Within each buffer zone, up to three dominant soil types were se-lected, based on the distribution of the harvested area of the target crop within the buffer.
Soil data were retrieved from both AfSIS-GYGA functional soil in-formation of sub-Saharan Africa database (maximum effective depth of water extraction from soil by roots, maximum soil depth, volumetric soil water content available for extraction by crop roots) (Leenaars et al., 2015, 2018) and ISRIC-World soil information, WISE interna-tional soil profile dataset (drainage) (Batjes, 2012). Information about dominant legume-based cropping systems in each buffer (e.g., sowing and harvest windows, plant density) was provided by local agrono-mists. Average on-farm yield (Ya) for Ethiopia was based on nine year
district level data obtained from the Central Statistical Agency Ethiopia
Table 1
Total harvested area, average water-limited potential yield (Yw,), temporal variation of Yw(CVtemporal), average farmer yield (Ya), relative yield gap (ReYg, i.e., [1-Ya/
Yw] x 100), yield potential (Yp), water limitation index (WLI) for each crop-country combination.
Country Crop Harvested area (1000 ha) Yw (Mg ha−1) CV (%) Ya (Mg ha−1) ReYg (%) Yp (Mg ha−1) WLI (%) Ethiopia Chickpea 197 2.7 23 1.4 49 5.7 52 Common bean 215 3.4 2 1.1 68 3.4 1
Kenya Common bean 944 3.4 10 0.6 81 4.0 13
Pigeonpea 190 2.9 35 0.3 88 5.6 49 Tanzania Chickpea 65 2.2 24 0.5 80 5.2 57 Common bean 859 3.1 4 0.6 79 3.2 4 Cowpea 155 3.2 7 0.6 82 3.5 8 Groundnut 421 2.3 14 0.7 71 3.7 37 Pigeonpea 155 2.5 17 0.6 75 7.1 64
M.P. van Loon et al. European Journal of Agronomy 101 (2018) 140–148
(CSA-Ethiopia, 2004,2005,2006,2007,2008,2009,2010,2011,2012,
2013,2014,2015,2016); for Kenya a 5-year average centered on year 2005 was obtained from SPAM 2005 (You et al., 2014a,2014b); and for Tanzania four years (2003, 2008, 2013, 2015) of district level data from the National Bureau of Statistics Tanzania were used (NBS-Tanzania, 2012,2016a,b).
2.3. Simulation of legume crop yield potential
We considered Ywas the relevant benchmark for estimating Ygsince
legumes in E-SSA are mainly grown under rainfed conditions. Still, to understand the degree of limitation by water, we also simulated non-water limited Yp. Yp and Yw were estimated using the generic crop
growth model Simple Simulation Model for legumes (SSM-legumes) (Soltani and Sinclair, 2012; https://sites.google.com/site/ cropmodeling/-7-ssm-soybean). The SSM model has been used to si-mulate growth and yield potential of a wide range of legume crops, including soybean (Sinclair et al., 2014,2010), chickpea (Soltani and Sinclair, 2011;Vadez et al., 2013), common bean (Marrou et al., 2014), lentil (Ghanem et al., 2015), cowpea (Hissene et al., 2016), and groundnut (Halilou et al., 2016). Briefly, SSM-legumes is a simple,
transparent, and mechanistic crop model structured in five modules informed with 57 parameters (including crop description, soil, and management) (Soltani and Sinclair, 2012). Thesefive modules cover 1) development, based on cumulative photo-thermal days; 2) leaf area development, which is calculated from phyllochron and an exponential relation between leaf number on the main stem and total plant leaf area; 3) dry matter production; 4) dry matter allocation, as determined by N balance in the different plant organs, and 5) soil water balance, where transpiration is calculated as a function of daily dry matter production and daytime vapour pressure deficit using Sinclair et al. (1984) equation.
We collected the value of general plant parameters from previous model applications (Sinclair et al., 2010, 2014;Soltani and Sinclair, 2011; Vadez et al., 2013; Marrou et al., 2014; Ricaurte et al., 2016;
Guiguitant et al., 2017). In each of these studies, genotypes have been sampled to represent the diversity of genotypes used in each study environment, covering temperate, dry tropical, and humid tropical climates. Most plant parameters are known from preceding studies not to vary significantly within species. For the crop specific parameters, phenology and photoperiod sensitivity, we calculated them to portray
the varieties grown in E-Afr, by using the parameter values of genotypes of the same variety in preceding studies, or calculating them from the phenology reported by local agronomists. The list of crop parameters is provided for each crop in Table S1.
Selected plant densities for the simulations were 50 (chickpea, common bean, and pigeonpea), 40 (cowpea), and 30 (groundnut) plants m−2. These densities compared well with the range of plant densities used in field experiments that aimed to maximize legume yields in different regions (Dapaah et al., 2014;Halilou et al., 2016;Mligo and Craufurd, 2007; Soltani et al., 2016). Our simulations also assumed that, in each year, sowing was triggered when cumulative rainfall was > 20 mm within 7 consecutive days in the sowing window as de-fined for each buffer by the local agronomist (Dobor et al., 2016;Wolf et al., 2015) (Table S2).
As for soil variables, the soil albedo (degree of soil reflectance de-pending on soil colour and moisture) was calculated following the method ofSoltani and Sinclair (2012). Soil curve numbers were esti-mated based onfield slope and drainage class reported for each soil (Yang et al., 2016). Chickpea, known by its deep and prolific root
system, is typically grown in Vertisols during the dry season in Ethiopia and Tanzania (Fig. 1a); due to the specific soil structure, these soil types can hold more water than other soils, which allows chickpea to com-plete its crop cycle relying on residual soil water from the wet season (Woldeab, 1988). In order to simulate these characteristics, we changed both soil depth (830–1270 mm originally) and maximum effective depth of water extraction from soil by roots (1000 mm originally) parameter to 1500 mm for chickpea in Ethiopia, and the maximum soil depth to 2000 mm (Woldeab, 1988). Besides, we set the volumetric soil water content available for extraction by crop roots at 0.15 (0.111–0.134 originally) to reflect the effect of vertisols on chickpea growth in Ethiopia. Since legume crops (except chickpea) are mostly grown during the wet season and no crop is planted during dry season (Fig. 1), we assumed that there was a 6 month fallow period before sowing and initiated the water balance module at that time with 50% of extractable soil water. An exception was chickpea in Ethiopia, which is sown at the end of the wet season; here, the soil water balance was initiated one week before sowing assuming a fully recharged soil pro-file.
Fig. 1. Average (1998–2012) monthly total rainfall and dominant legume-based crop sequences in selected sites in East Africa. Horizontal solid lines and dashed lines represent the crop growth duration (i.e., from sowing until physiological maturity) for, respectively, each legume crop cycle and cereal crop cycle in each crop sequence.
2.4. Estimation of yield gaps for legume crops and data analysis
For each buffer, Ywwas simulated for each of three dominant soil
types. Average Yw was calculated for each buffer using a weighted
average based on the proportion of soils within the buffer. Yg was
calculated as the difference between long-term average Yw and Ya.
Relative yield gap (ReYg; expressed as percentage of Yw) was calculated
as one minus the ratio between Yaand Yw times 100. Results were
upscaled from buffer to CZ and from CZ to country level using the bottom-up approach described byvan Bussel et al. (2015). In short, the weighted average of the yields per soil type was taken to obtain the yield per crop cycle for a buffer. In case of multiple crop cycles per year the average was taken to obtain the yield per crop (Van Bussel et al., 2015). Finally, the average of all years was calculated to obtain the yield per bufferzone. We upscaled the potential yield, actual yield and yield gap from buffer zone to CZ. This was done by taking per CZ the harvested area-weighted average yields of the included bufferzones. The CZ yields were further upscaled to country level by taking the harvested area-weighted average yield per CZ (Van Bussel et al., 2015). Two parameters were used to assess the degree of crop water lim-itation: crop water availability (CWA), which was derived from the si-mulated crop evapotranspiration, and the water limitation index (WLI, in %), which was calculated as one minus the ratio between Ywand Yp
times 100. Quantile regression was used to derive a boundary function for the relationship between simulated Ywand CWA based on the 95th
percentile. The boundary function used an x-intercept (i.e., minimum soil evaporation) that corresponds to the 5th percentile of simulated soil evaporation for each individual crop across country-years-sites. Analysis was performed using the “quantreg” package in R (RCore Team, 2018). Water-use efficiency derived from the slope of the
boundary functions fitted to simulated data were compared against maximum water-use efficiency reported in the literature (Halilou et al., 2015; Miriti et al., 2012; Ramírez Builes, 2011; Zhang et al., 2000;
Connor et al., 2011), except for pigeon pea for which we are not aware of robust estimates of water-use efficiency.
We investigated opportunities for Yg closure by identifying sites
with (i) large relative yield gap (ReYg), (ii) large harvested area, and
(iii) low yield risk (Van Oort et al., 2017). We used the inter-annual coefficient of variation (CV, %) of Ywas a proxy to yield risk.
2.5. Extra production potential due to intensification of existing legume cropping systems
Current domestic grain legume demand was calculated for each legume and country as the product of 2010-population (United-Nations, 2015) and the legume demand per capita derived from the IMPACT model (Robinson et al., 2015). In order to compute a total legume de-mand that aggregates the dede-mand of all legumes in this study, the do-mestic demand of each legume was expressed as common bean equivalent (Ceq) using the crop-specific grain caloric contents (FAO food balances) as follows:
∑
=
Di D x Ceqi j j (1)
where D represents total domestic legume demand, i represents either current or future scenarios, and j represents the legume crop. Future legume demand per capita was estimated based on IMPACT (Robinson et al., 2015) and the projected 2050 population established for the medium fertility variant ofUnited Nations (2015).
Followingvan Ittersum et al. (2016), legume self-sufficiency ratio (SS) was calculated as:
=
SS P
D
i i
i (2)
Which is the quotient of total domestic legume production (P) and demand (D) for current (2010) and future (2050) scenarios, where i
represents either current or future scenarios of legume production. Future production scenarios include (1) legume yield is equal to current production (Ya), (2) legume yield equals 50% of Yw, and (3) legume
yield equals 80% of Yw(exploitable Yg). Data from previous studies
showed that 80% of Ywis a reasonable maximum goal in commercial,
intensive legume cropping systems (Rattalino Edreira et al., 2018). Current legume production was calculated per country as the pro-duct of mean actual crop yield and the 2010-harvested area per crop (FAO, 2018). Future legume production was estimated for the three production scenarios assuming no future changes in legume area. Note, that we do not include the effects of climate change in our study, be-cause of the large uncertainty in the degree and impact of climate change in E-Afr, as discussed invan Ittersum et al. (2016).
3. Results
3.1. Yield potential of legume crops in East Africa
Yw varies across countries and legumes (Table 1). The highest
average (area-weighted average across legumes in a country) Ywwas
found in Kenya, i.e. 3.3 Mg ha−1, which was 18% and 8% higher than that in Ethiopia and Tanzania, respectively (Table 1). Of all simulated legumes in East Africa, highest Yw’s were found for common bean
(3.3 Mg ha−1) and cowpea (3.2 Mg ha−1) and these two crops also exhibited the lowest year-to-year yield variation as measured using the coefficient of variation (CV of respectively 5 and 7%). Groundnut ex-hibited the lowest Yw, with a CV of 14%. For dry season crops such as
chickpea, the average Yw was 2.6 Mg ha−1, with a CV three times
higher than that in common bean, indicating unstable yields across years. Although pigeonpea has the longest growth duration in our study (Fig. 1d,e), the Ywof pigeonpea was 17% less than that of common
bean, and the CV was highest (27%). Ywvaried across countries, i.e., Yw
for common bean and pigeonpea was respectively 12% and 14% higher in Kenya than in Tanzania, and Yw for chickpea was 22% higher in
Ethiopia than in Tanzania.
A negative relationship was found between Ywand WLI ( r2= 0.68,
p < 0.05). Legumes with a high Yw, such as common bean and cowpea,
had the smallest limitation by water (WLI = 8%). For common bean, WLI in Ethiopia and Tanzania was even less than 5%, revealing common bean growth experiences hardly any water limitation in those countries. In contrast, legumes with a low Yw such as chickpea,
groundnut, and pigeonpea had substantially higher WLI (range: 37%–64%).
3.2. Average farmer yield and yield gaps of legume crops in East Africa
The highest, area-weighted, average actual legume yield was 1.2 Mg ha−1in Ethiopia, two times larger than that in Tanzania and Kenya (Table 1). Across different legume species, Yaof chickpea was 1.2 Mg
ha−1, which was around twice the Yaof common bean, cowpea and
groundnut, and three-fold greater than that of pigeonpea. Contrary to Yw, the variation of Yaacross countries was greater than that across
species.
Our results showed a large legume yield gap in East Africa (E-Afr), i.e. the relative yield gap (ReYg) was on average 76% for all the legumes
across the three countries, ranging from 49 to 88% for the different crop-country combinations. Comparing ReYg across countries, ReYg
decreased in this order: Kenya, Tanzania, and Ethiopia (ReYg: 82%,
77%, and 59%, respectively). Pigeonpea and cowpea had the highest ReYg(82%), followed by common bean (79%) and groundnut (71%).
ReYgfor chickpea was 80% in Tanzania and 49% in Ethiopia. Except for
chickpea in Ethiopia, ReYgfor all legume-country combinations was
higher than 50%, (68–88%).
M.P. van Loon et al. European Journal of Agronomy 101 (2018) 140–148
3.3. Legume yield differences in different regions within a country Yield gaps differed across regions within a country (Table S2). For example, in Ethiopia, chickpea cropping area is mainly situated in the central and north-western part of the country, and Yw and Ya of
chickpea was higher in the north-western region than in the central region (Fig. 2). ReYgin the north-west was approx. 57%, and in the
centre it was 48% or lower (Fig. 2). For common bean, ReYg was
20–30% lower in the central than in the north-western region. This is because Ywwas the highest in the north-west, while Yawas higher in
the central region. In Tanzania, a relatively high Ywwas found in the
north-western region for chickpea, common bean and groundnut, and in the central region for pigeonpea and cowpea. In Kenya, for common bean the highest Ywand lowest Yawas found in southwest Kenya near
the rift valley, resulting in a higher yield gap than in other regions. For pigeonpea, Ywhad a small range of 2.5–3.1 Mg ha−1, while the average
Yawas less than 0.4 Mg ha−1. Therefore, a large ReYg(86–92%) was
found. Differences in Ygand Ywacross regions within a country likely
reflect differences in the biophysical environments as well as farmers’ access to inputs, markets and extension.
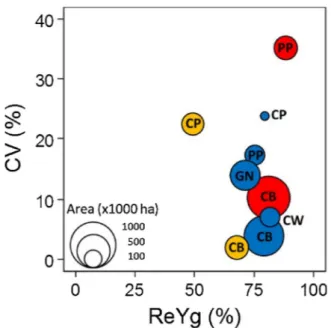
Yield-gap analysis performed for thefive legume crops can help identifying country-crop combinations with greatest potential for crop intensification based on the size of the gap (REYg%), risk levels (CV) and harvested area (Fig. 3). Common bean in Tanzania has the largest harvested area, with a relatively high ReYg (79%) and low CV (4%) (Table 1andFig. 3). In contrast, chickpea in Ethiopia had a relatively high CV (23%) and low ReYg (49%), with a small harvested area (Table 1andFig. 3). The CV of chickpea is relatively high, because of
Fig. 2. Water-limited yield potential (Yw),average farmer yield (Ya), yield gap (Yg), and relative yield gap (ReYg) for the selected climate zones in East Africa for the
the large variability in rainfall across years during the dry season. Pi-geonpea had the highest CV (35%), which is mainly due to the low temperatures within the season and regions it is growing and therefore it has a long and variable growth duration.
3.4. Relationships between crop water availability and yield among different legume crops
There was large variation in CWA across countries, sites, and years for all legumes (Fig. 4). The 5th and 95th percentiles for CWA were, in the same order, 260 and 460 mm (chickpea), 400 and 820 mm (common bean), 450 and 730 mm (cowpea), 470 and 860 mm (groundnut), and 380 and 830 (pigeonpea). Highest yields were linearly related to CWA, as illustrated by the boundary functionsfitted across countries and years separately for each crop (Fig. 4a–e). The slope of those boundaries represents the upper limit of water-use efficiency, which varied from 13 to 21.5 Mg ha−1mm−1 for groundnut and common bean, respectively. For any level of CWA, there was a wide variation in Ywfor all crops and regions. Boundary functionsfitted to
simulated Yw and CWA were (chickpea) or were not (cowpea and
groundnut) in reasonable agreement with boundary functions derived from the literature (Fig. 4a–e). No boundary function was fitted
be-tween Yaand CWA, as there was no significant relationship (p > 0.25
for all crops except common bean [p = 0.02]).
3.5. Yield gap closure and potential impact on food self-sufficiency Currently, Ethiopia and Kenya are self-sufficient in legumes, and Tanzania is almost self-sufficient (Fig. 5a). However, population is ex-pected to double in both Ethiopia and Kenya, and to triple in Tanzania by the year 2050 compared with 2010, and the per capita domestic grain legume demand is expected to increase by 62% (Ethiopia), 13% (Kenya), and 33% (Tanzania) (Table 2). If actual yields do not increase, the legume self-sufficiency would be only ca. 0.4 in the three countries in 2050 (Fig. 5b). If legume yields would increase up to 50% of Yw,
Kenya will be almost self-sufficient, while Tanzania and Ethiopia will still not be self-sufficient in legume production. If legume yields in-crease up to 80% of Yw, Tanzania will also be self-sufficient in legumes
and Ethiopia will still not be self-sufficient (Fig. 5b). Compared with cereal self-sufficiency (van Ittersum et al., 2016), Ethiopia had lower
Fig. 3. Relative yield gap (ReYg) versus coefficient of variation of Yw (CV) for
chickpea (CP), common bean (CB), cowpea (CW), groundnut (GN), and pi-geonpea (PP) of Ethiopia (yellow symbols), Kenya (red symbols), and Tanzania (blue symbols). Size of the symbols indicates the size of the harvested area of the crop. (For interpretation of the references to colour in thisfigure legend, the reader is referred to the web version of this article.)
Fig. 4. Water-limited yield potential (Yw, a– e) and average farm yield (Ya, f– j) plotted against seasonal crop water availability for Ethiopia (yellow), Kenya (red)
and Tanzania (blue) for thefive legume crops. Ywand Yafor each buffer-year combination are shown (small symbols) as well as Ywand Yaaverages for each
crop-country combination (large symbols). In all panels, solid lines represent potential water-use efficiency from literature (black line) and estimated by quantile re-gression analysis of simulated data based on 95th percentile (red lines), with minimum soil evaporation set for each individual crop at the 5th percentile of simulated soil evaporation across country-years-sites (chickpea: 93 mm; common bean: 218 mm; cowpea: 284 mm; groundnut: 292 mm; pigeon pea: 229 mm). Slopes of potential water-use efficiency are shown next to reference lines and expressed as kg ha−1mm−1(For interpretation of the references to colour in thisfigure legend,
the reader is referred to the web version of this article.)
M.P. van Loon et al. European Journal of Agronomy 101 (2018) 140–148
self-sufficiency ratio in legumes than in cereals, while Kenya and Tan-zania had higher self-sufficiency ratio in legumes than in cereals (Fig. 5b,c). While Ethiopia cannot meet legume demand in S3, Kenya can meet legume demand in S3 and S2 and Tanzania can meet the demand only in S3.
4. Discussion
4.1. Data on benchmarking legume production in SSA
This study was thefirst to assess, at a regional level, the yield gaps (Yg) of legume crops in East Africa (E-Afr), and to investigate
oppor-tunities of different levels of yield gap closure to achieve future (2050) legume self-sufficiency on existing cropland. We followed the protocols of the Global Yield Gap Atlas to map Ygin an agronomically robust and
reproducible manner, based on a bottom-up approach using local data as input and involving local experts to evaluate model results. For a robust analysis, one of the requirements is that all input data meets the minimum quality standards at the appropriate spatial scale (Grassini et al., 2015a). Given the known data limitations in SSA, our assessment helps in identifying priority data gaps that need attention. In particular actual yield estimates for Kenya are highly uncertain, since they are based on only one year data, obtained from SPAM 2005 (You et al., 2014a,b), as national statistical data were not available. Second, while parameterization of the phenological parameters of the SSM-legumes model resulted in good reproduction of observed phenology and spatial yield variation as reported by local agronomists, model evaluation based on experiments was challenging. Our review of the existing lit-erature indicated a very few experiments carried out under (rainfed) potential conditions for legumes crops in E-Afr (Tesfaye et al., 2006). There was also very little information in the literature on potential water use efficiency of legume crops (except for soybean) in SSA and elsewhere. Our results presented inFig. 4should therefore be seen as a first attempt to benchmark such values. Differences in potential water-use efficiency between our results and those reported in literature (Fig. 4) might be attributable to (i) different evaporative demands, soil
evaporation, crop evapotranspiration afterflowering, and intensity of water stress aroundflowering that all affect potential water-use effi-ciency (Rattalino Edreira et al., 2018), but (ii) also to the fact that we are comparing boundary functions derived from simulations for po-tential growth under rainfed conditions while data from literature are from field experiments that might have been affected also by other limitations or reducing factors (i.e., deficient nutrition, poor weed management, insect and disease damage). The latter may (partly) ex-plain why we simulated higher water-use efficiencies for chickpea and common bean than found in experiments results reported in the lit-erature; it can however not explain that we found lower potential water-use efficiencies for cowpea and groundnut than reported in lit-erature. Finally, to estimate potential legume yields we assumed sole cropping, despite the substantial but unknown legume area under in-tercropping (Muthoni Andriatsitohaina et al., 2015). Better data on the shares of legumes grown as sole crop and intercrop (well characterized) will be helpful. Once this is known, it may also be of interest to estimate the consequences of growing legumes as a sole or intercrop (Gou et al., 2017), if the necessary model complexity and experimental data to si-mulate legume intercropping is available (Probert et al., 1998).
4.2. Scope to increase legume production and achieve self-sufficiency This paper shows the substantial potential to increase rainfed le-gume production on existing cropland area in E-Afr. Actual farmers yields were very low (i.e., on average across all crops and countries 0.7 Mg ha−1, equivalent to only 25% of Yw), with lowest Yain Kenya
(15% of Yw), then Tanzania (23% of Yw), and highest in Ethiopia (41%
of Yw). These findings are consistent with relative yield reported for
cereal crops in E-Afr (i.e., on average 26%) (Global Yield Gap Atlas,
www.yieldgap.org;Van Ittersum et al., 2016), but substantially lower than relative yields reported for soybean in the USA (ca. 80%;Edreira et al., 2017; Grassini et al., 2015a), Argentina (ca. 70%; Aramburu Merlos et al. 2015), India (ca. 40%; Bhatia et al., 2009, 2008) and chickpea in Iran (ca. 47%;Ahmadi et al., 2014;Soltani et al., 2016).
The inter-annual coefficient of variation (CV) of Ywwas lower for
the legumes in E-Afr (i.e., on average 15%) compared with that of le-gumes in Argentina and India, to chickpea in Iran, and to cereals in E-Afr (respectively, on average 22, 29, 46 and 23%). This suggests that legume crops are relatively interesting crops for strategic investments in E-Afr (Van Oort et al., 2017), as they are relatively secure crops in terms of yield variability due to variation in weather while relatively large yield gains can be made.
Recent research suggests large opportunities for closing the legume Yg.. In particular for common bean there is experimental evidence that
improved management increases yields highly (Checa et al., 2006;
Fig. 5. Grain legume self-sufficiency on existing legume area for the legumes jointly per country for a) 2010 and b) for the different scenarios in 2050: scenario 1 (S1), no change in yield in 2050 compared to 2010; scenario 2 (S2), yields in 2050 will be 50% of limited yield; scenario 3 (S3), yields in 2050 will be 80% of water-limited yield; c) compared with cereal self-sufficiency for the same scenarios and countries (van Ittersum et al., 2016).
Table 2
Increase in population and per capita legume demand from 2010 to 2050 for Ethiopia, Kenya and Tanzania.
Country Population 2050 (% of 2010)
Per capita legume demand 2050 (% of 2010)
Ethiopia 216 162
Kenya 233 113
Ronner et al., 2017). We showed that this crop is hardly limited by water during the growing season, and a large yield increase may be obtained by alleviating other limiting factors such as nutrients, and biotic stress, e.g. by increasing P fertilizer use and use of inoculants (Rurangwa et al., 2017). There also exists a large potential for closure of cowpea Yg; also this crop is hardly limited by water during the growing
season. This contrasts with pigeonpea and groundnut, which are more water-limited and, consequently, have lower Yw. Chickpea on the other
hand, has the advantage that it can enhance legume production in the dry season without competing for crop area with other major legumes; it has the highest water use efficiency of all crops considered in this study. The increase of common bean production could have major implications for human nutrition in E-Afr, as common bean is the major legume crop in the region (Katungi et al., 2010). This is especially true for Kenya and to a lesser extent for Tanzania and Ethiopia because of the large area of this crop in Kenya.
Our analysis revealed that in Kenya and Tanzania closure of the exploitable Yg(80% of Yw) is needed to fulfil future (2050) legume
demand as a result of the expected large population increase and to achieve self-sufficiency. In contrast, intensification of legume produc-tion is not enough to obtain self-sufficiency on existing cropland in Ethiopia. Thisfinding is clearly different than that for cereal crops as reported by (van Ittersum et al., 2016), who found that closure of the exploitable Ygfor cereal crops would lead to cereal self-sufficiency in
Ethiopia, and not in Kenya and Tanzania (Fig. 5c). Obviously, legume areas are currently only small in Ethiopia. The relatively favourable potentials to achieve cereal self-sufficiency in Ethiopia (van Ittersum et al., 2016) suggest there may be scope to increase the legume areas in this country, either at the expense of cereals or combined with cereal in intercropping systems.
5. Conclusions
To our knowledge, this is thefirst assessment of yield gaps of the main grain legume crops in East sub-Saharan Africa. Results reveal substantial legume yield gaps, i.e., largest in Kenya, then Tanzania and finally Ethiopia. There is thus large room for improvement of legume production on existing cropland, in particular for common bean. Furthermore, it was shown that closing the exploitable legume yield gaps on existing cropland is necessary to fulfil the future (2050) legume demand, which is projected to increase a lot due to the expected large population growth and increased per capita consumption. Self-su ffi-ciency may be achievable in both Kenya and Tanzania through yield gap closure on existing cropland, but in Ethiopia yield gap closure on existing cropland alone would not be enough to obtain legume self-sufficiency by 2050.
Acknowledgments
This work was implemented as part of the CGIAR Research Program on Climate Change, Agriculture and Food Security (CCAFS), which is carried out with support from CGIAR Fund Donors and through bi-lateral funding agreements. For details please visithttps://ccafs.cgiar. org/donors. The views expressed in this document cannot be taken to reflect the official opinions of these organisations. We thank Tom Sinclair from North Carolina State University, Raleigh USA, for his support in using the SSM, and Ken Giller from Wageningen University and leader of the N2Africa project and Lieven Claessens from IITA for establishing contacts with several local agronomists and for discussing the results with us. We thank local agronomists of Ethiopia (Kindie Tesfaye), Tanzania (Abubakari Mzanda and Musa Tamba) and of Kenya (John Ojiem, Joyce Maling’a and Ganga Rao) for providing data and evaluating model results. We thank Daniel Mason-D’Croz and Keith Wiebe from the IMPACT Modeling Team of the International Food Policy Research Institute (IFPRI) for providing data on legume demand per capita.
Appendix A. Supplementary data
Supplementary material related to this article can be found, in the online version, at doi:https://doi.org/10.1016/j.eja.2018.09.004.
References
Ahmadi, S.R.A.D., Parsa, M., Bannayan, M., Mahallati, M.N., Deihimfard, R., 2014. Yield gap analysis of chickpea under semi-arid conditions: a simulation study. Int. J. Plant
Prod. 8 (4), 531–548.
Aramburu Merlos, F., et al., 2015. Potential for crop production increase in Argentina
through closure of existing yield gaps. Field Crops Res. 184, 145–154.
Batjes, N.H., 2012. ISRIC-WISE Derived Soil Properties on a 5 by 5 Arc-Minutes Global
Grid (Ver. 1.2), ISRIC-World Soil Information.
Bhatia, V.S., et al., 2008. Analysis of potential yields and yield gaps of rainfed Soybean in
India using CROPGRO-Soybean model. Agric. For. Meteorol. 148 (8-9), 1252–1265.
Bhatia, V.S., Singh, P., Kesava Rao, A.V.R., Srinivas, K., Wani, S.P., 2009. Analysis of water non‐limiting and water limiting yields and yield gaps of groundnut in India
using CROPGRO‐Peanut Model. J. Agron. Crop Sci. 195 (6), 455–463.
Cassman, K.G., Dobermann, A., Walters, D.T., Yang, H., 2003. Meeting cereal demand while protecting natural resources and improving environmental quality. Annu. Rev.
Environ. Resour. 28 (1), 315–358.
Checa, O., Ceballos, H., Blair, M.W., 2006. Generation means analysis of climbing ability
in common bean (Phaseolus vulgaris L.). J. Heredity 97 (5), 456–465.
Connor, D.J., Loomis, R.S., Cassman, K.G., 2011. Crop Ecology: Productivity and
Management in Agricultural Systems. Cambridge University Press.
Core Team, R., 2018. R: A Language and Environment for Statistical Computing. R
Foundation for Statistical Computing, Vienna, Austria.
CSA-Ethiopia, 2004. Agricultural Sample Survey 2003/2004 (1996 E.C.): Report on Area and Production of Crops (Private Peasant Holdings, Meher Season). Central Statistical
Agency Ethiopia, Addis Ababa, Ethiopia.
CSA-Ethiopia, 2005. Agricultural Sample Survey 2004/2005 (1997 E.C.): Report on Area and Production of Crops (Private Peasant Holdings, Meher Season). Central Statistical
Agency Ethiopia, Addis Ababa, Ethiopia.
CSA-Ethiopia, 2006. Agricultural Sample Survey 2005/2006 (1998 E.C.): Report on Area and Production of Crops (Private Peasant Holdings, Meher Season). Central Statistical
Agency Ethiopia, Addis Ababa, Ethiopia.
CSA-Ethiopia, 2007. Agricultural Sample Survey 2006/2007 (1999 E.C.): Report on Area and Production of Crops (Private Peasant Holdings, Meher Season). Central Statistical
Agency Ethiopia, Addis Ababa, Ethiopia.
CSA-Ethiopia, 2008. Agricultural Sample Survey 2007/2008 (2000 E.C.): Report on Area and Production of Crops (Private Peasant Holdings, Meher Season). Central Statistical
Agency Ethiopia, Addis Ababa.
CSA-Ethiopia, 2009. Agricultural Sample Survey 2008/2009 (2001 E.C.): Report on Area and Production of Crops (Private Peasant Holdings, Meher Season). Central Statistical
Agency Ethiopia, Addis Ababa, Ethiopia.
CSA-Ethiopia, 2010. Agricultural Sample Survey 2009/2010 (2002 E.C.): Report on Area and Production of Crops (Private Peasant Holdings, Meher Season). Central Statistical
Agency Ethiopia, Addis Ababa, Ethiopia.
CSA-Ethiopia, 2011. Agricultural Sample Survey 2010/2011 (2003 E.C.): Report on Area and Production of Crops (Private Peasant Holdings, Meher Season). Central Statistical
Agency Ethiopia, Addis Ababa, Ethiopia.
CSA-Ethiopia, 2012. Agricultural Sample Survey 2011/2012 (2004 E.C.): Report on Area and Production of Crops (Private Peasant Holdings, Meher Season). Central Statistical
Agency Ethiopia, Addis Ababa, Ethiopia.
CSA-Ethiopia, 2013. Agricultural Sample Survey 2012/2013 (2005 E.C.): Report on Area and Production of Crops (Private Peasant Holdings, Meher Season). Central Statistical
Agency Ethiopia, Addis Ababa, Ethiopia.
CSA-Ethiopia, 2014. Agricultural Sample Survey 2013/2014 (2006 E.C.): Report on Area and Production of Crops (Private Peasant Holdings, Meher Season). Central Statistical
Agency Ethiopia, Addis Ababa, Ethiopia.
CSA-Ethiopia, 2015. Agricultural Sample Survey 2014/2015 (2007 E.C.): Report on Area and Production of Crops (Private Peasant Holdings, Meher Season). Central Statistical
Agency Ethiopia, Addis Ababa, Ethiopia.
CSA-Ethiopia, 2016. Agricultural Sample Survey 2015/2016 (2008 E.C.): Report on Area and Production of Crops (Private Peasant Holdings, Meher Season). Central Statistical
Agency Ethiopia, Addis Ababa, Ethiopia.
Dapaah, H.K., Mohammed, I., Awuah, R.T., 2014. Growth yield performance of groundnuts (Arachis hypogaea L.) in response to plant density. Int. J. Plant Soil Sci. 3
(9), 1069–1082.
Dobor, L., et al., 2016. Crop planting date matters: estimation methods and effect on
future yields. Agric. For. Meteorol. 223, 103–115.
Edreira, J.I.R., et al., 2017. Assessing causes of yield gaps in agricultural areas with
di-versity in climate and soils. Agric. For. Meteorol. 247, 170–180.
FAO, 2018. Production/Crops and Resource/Fertilizer. FAOSTAT Database Collections, Rome.
Franke, A.C., Laberge, G., Oyewole, B.D., Schulz, S., 2008. A comparison between legume technologies and fallow, and their effects on maize and soil traits, in two distinct environments of the West African savannah. Nutr. Cycl. Agroecosyst. 82 (2),
117–135.
Franke, A.C., van den Brand, G.J., Vanlauwe, B., Giller, K.E., 2017. Sustainable in-tensification through rotations with grain legumes in sub-saharan Africa: a review.
Agric. Ecosyst. Environ.
Ghanem, M.E., Marrou, H., Biradar, C., Sinclair, T.R., 2015. Production potential of Lentil
M.P. van Loon et al. European Journal of Agronomy 101 (2018) 140–148
(Lens culinaris Medik.) in East Africa. Agric. Syst. 137, 24–38.
Giller, K.E., 2001. Nitrogen Fixation in Tropical Cropping Systems. Cabi.
Giller, K.E. et al. (Editors), 2013. N2Africa: Putting nitrogenfixation to work for small-holder farmers in Africa. Agro-ecological Intensification of Agricultural Systems in the African Highlands. Routledge, London, London, 156-174 pp.
Gobbett, D., et al., 2016. Yield gap analysis of rainfed wheat demonstrates local to global
relevance. J. Agric. Sci. 1–18.
Gou, F., et al., 2017. On yield gaps and yield gains in intercropping: opportunities for
increasing grain production in northwest China. Agric. Syst. 151, 96–105.
Grassini, P., et al., 2015a. Soybean yield gaps and water productivity in the western US
Corn Belt. Field Crops Res. 179, 150–163.
Grassini, P., et al., 2015b. How good is good enough? Data requirements for reliable crop
yield simulations and yield-gap analysis. Field Crops Res. 177, 49–63.
Guiguitant, J., et al., 2017. Relevance of limited-transpiration trait for lentil (Lens culinaris
Medik.) in South Asia. Field Crops Res. 209, 96–107.
Halilou, O., Hamidou, F., Taya, B.K., Mahamane, S., Vadez, V., 2015. Water use, tran-spiration efficiency and yield in cowpea (Vigna unguiculata) and peanut (Arachis
hypogaea) across water regimes. Crop Past. Sci. 66 (7), 715–728.
Halilou, O., et al., 2016. Determination of coefficient defining leaf area development in different genotypes, plant types and planting densities in peanut (Arachis hypogeae
L.). Field Crops Res. 199, 42–51.
Hissene, H.M., et al., 2016. Quantifying leaf area development parameters for cowpea
[Vigna unguiculata (L.) Walpers]. Crop Sci. 56 (6), 3209–3217.
Kamanga, B.C.G., Waddington, S.R., Robertson, M.J., Giller, K.E., 2010. Risk analysis of maize-legume crop combinations with smallholder farmers varying in Resource
en-dowment in Central Malawi. Exp. Agric. 46 (1), 1–21.
Kassie, B.T., et al., 2014. Climate-induced yield variability and yield gaps of maize (Zea
mays L.) in the Central Rift Valley of Ethiopia. Field Crops Res. 160, 41–53.
Katungi, E., et al., 2010. Improving Common Bean Productivity: An Analysis of Socioeconomic Factors in Ethiopia and Eastern Kenya. Baseline Report Tropical
Legumes II. Centro Internacional de Agricultura Tropical-CIAT, Cali, Colombia.
KMD, 1998-2012. Kenya Meteorological Department. Weather data, KMD, Nairobi, Kenya.
Leenaars, J., et al., 2015. Root Zone Plant-Available Water Holding Capacity of the Sub-Saharan Africa Soil, Version 1.0. Gridded Functional Soil Information (Dataset
RZ-PAWHC SSA v. 1.0).
Leenaars, J.G.B., et al., 2018. Mapping rootable depth and root zone plant-available water
holding capacity of the soil of sub-Saharan Africa. Geoderma 324, 18–36.
Marrou, H., Sinclair, T.R., Metral, R., 2014. Assessment of irrigation scenarios to improve performances of lingot bean (Phaseolus vulgaris) in southwest France. Eur. J. Agron.
59, 22–28.
Merlos, F.A., et al., 2015. Potential for crop production increase in Argentina through
closure of existing yield gaps. Field Crops Res. 184, 145–154.
Miriti, J.M., et al., 2012. Yield and water use efficiencies of maize and cowpea as affected by tillage and cropping systems in semi-arid Eastern Kenya. Agric. Water Manag. 115,
148–155.
Mligo, J.K., Craufurd, P.Q., 2007. Productivity and optimum plant density of pigeonpea in
different environments in Tanzania. J. Agric. Sci. 145 (4), 343–351.
Muthoni Andriatsitohaina, R., Farrow, A., Ojara, M., 2015. Version II of the Atlas of the
Common Bean in Africa.
NBS-Tanzania, 2012. National Sample Census of Agriculture 2007/2008: Smallholder
Agriculture, National Bureau of Statistics Tanzania. United Republic of Tanzania..
NBS-Tanzania, 2016a. 2014/15 Annual Agricultural Sample Survey Report, National
Bureau of Statistics Tanzania. United Republic of Tanzania..
NBS-Tanzania, 2016b. Large Scale Farm Survey Report, 2012/13, National Bureau of
Statistics Tanzania. United Republic of Tanzania..
NMA, 1998-2012. National Meteorological Agency. Weather data, NMA, Addis Ababa, Ethiopia.
Ojiem, J.O., Franke, A.C., Vanlauwe, B., de Ridder, N., Giller, K.E., 2014. Benefits of legume-maize rotations: assessing the impact of diversity on the productivity of
smallholders in Western Kenya. Field Crops Res. 168, 75–85.
Probert, M.E., Carberry, P.S., McCown, R.L., Turpin, J.E., 1998. Simulation of
legume-cereal systems using APSIM. Aust. J. Agric. Res. 49 (3), 317–327.
Ramírez Builes, V., 2011. Genotypic differences in water use efficiency of common bean under drought stress, 103, 1206:1215 pp.
Rattalino Edreira, J.I., Guilpart, N., Sadras, V.O., Cassman, K.G., van Ittersum, M.K.,
Grassini, P., 2018. Water productivity of rainfed maize and wheat: a local to global
perspective. Agric. For. Meteorol. 259, 364–373.
Ricaurte, J., Michelangeli, J.A.C., Sinclair, T.R., Rao, I.M., Beebe, S.E., 2016. Sowing
density effect on common bean leaf area development. Crop Sci. 56 (5), 2713–2721.
Robinson, S. et al., 2015. The International Model for Policy Analysis of Agricultural Commodities and Trade (IMPACT): Model description for version 3. In: I.F.P.R. Institute (Editor), Washington DC.
Ronner, E., Descheemaeker, K., Almekinders, C., Ebanyat, P., Giller, K., 2017. Farmers’ use and adaptation of improved climbing bean production practices in the highlands
of Uganda. Agric. Ecosyst. Environ.
Rurangwa, E., Vanlauwe, B., Giller, K.E., 2017. Benefits of inoculation, P fertilizer and manure on yields of common bean and soybean also increase yield of subsequent
maize. Agric. Ecosyst. Environ.
Sanginga, N., 2003. Role of biological nitrogenfixation in legume based cropping
sys-tems; A case study of West Africa farming systems. Plant Soil 252 (1), 25–39.
Sinclair, T.R., Messina, C.D., Beatty, A., Samples, M., 2010. Assessment across the United
States of the benefits of altered soybean drought traits. Agron. J. 102 (2), 475–482.
Sinclair, T.R., Marrou, H., Soltani, A., Vadez, V., Chandolu, K.C., 2014. Soybean
pro-duction potential in Africa. Glob Food Secur.-Agric. 3 (1), 31–40.
Soltani, A., Sinclair, T.R., 2011. A simple model for chickpea development, growth and
yield. Field Crops Res. 124 (2), 252–260.
Soltani, A., Sinclair, T.R., 2012. Modeling Physiology of Crop Development, Growth and
Yield. CABI, London, UK.
Soltani, A., Hajjarpour, A., Vadez, V., 2016. Analysis of chickpea yield gap and
water-limited potential yield in Iran. Field Crops Res. 185, 21–30.
Temba, M., Njobeh, P.B., Adebo, O.A., Olugbile, A.O., Kayitesi, E., 2016. The role of compositing cereals with legumes to alleviate protein energy malnutrition in Africa.
Int. J. Food Sci. Technol. 51 (3), 543–554.
Tesfaye, K., Walker, S., Tsubo, M., 2006. Radiation interception and radiation use effi-ciency of three grain legumes under water deficit conditions in a semi-arid
en-vironment. Eur. J. Agron. 25 (1), 60–70.
TMA, 1998-2012. Tanzania Meteorological Agency. Weather data, TMA, Dar es Salaam, Tanzania.
UnitedNations, 2015. World Population Prospects, the 2015 Revision. United Nations
-Department of Economic and Social Affairs. New York..
United-Nations, 2016. The sustainable development goals report, 2016, New York, USA.
Vadez, V., Soltani, A., Sinclair, T.R., 2013. Crop simulation analysis of phenological
adaptation of chickpea to different latitudes of India. Field Crops Res. 146, 1–9.
Van Bussel, L.G., et al., 2015. Fromfield to atlas: upscaling of location-specific yield gap
estimates. Field Crops Res. 177, 98–108.
van Ittersum, M.K., et al., 2016. Can sub-saharan Africa feed itself? Proceedings of the National Academy of Sciences of the United States of America 113 (52),
14964–14969.
Van Ittersum, M.K., Rabbinge, R., 1997. Concepts in production ecology for analysis and quantification of agricultural input-output combinations. Field Crops Res. 52 (3),
197–208.
Van Oort, P.A.J., et al., 2017. Can yield gap analysis be used to inform R&D prioritisation?
Global Food Secur. 12, 109–118.
Van Wart, J., et al., 2013. Use of agro-climatic zones to upscale simulated crop yield
potential. Field Crops Res. 143, 44–55.
Van Wart, J., et al., 2015. Creating long-term weather data from thin air for crop
simu-lation modeling. Agric. For. Meteorol. 209, 49–58.
Woldeab, A., 1988. Physical Properties of Ethiopian Vertisols. Management of Vertisols in
Sub-Saharan Africa.
Wolf, J., Ouattara, K., Supit, I., 2015. Sowing rules for estimating rainfed yield potential
of sorghum and maize in Burkina Faso. Agric. For. Meteorol. 214, 208–218.
Yang, H., Dobermann, A., Cassman, K.G., Walters, D.T., Grassini, P., 2016. Hybrid-Maize:
A simulation model for corn growth and yield. Nebraska Coop. Ext. CD.
You, L. et al., 2014a. Spatial Production Allocation Model (SPAM) 2000, Version 3, Release 2.
You, L.Z., Wood, S., Wood-Sichra, U., Wu, W.B., 2014b. Generating global crop
dis-tribution maps: from census to grid. Agric. Syst. 127, 53–60.
Zhang, H., Pala, M., Oweis, T., Harris, H., 2000. Water use and water-use efficiency of chickpea and lentil in a Mediterranean environment. Aust. J. Agric. Res. 51 (2),