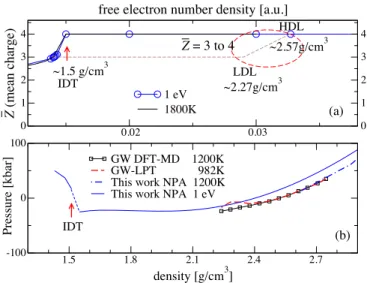
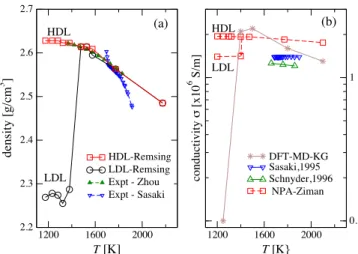
Liquid-liquid phase transitions in silicon
Texte intégral
Figure


Documents relatifs
scheduled times of arrival at the departure runway (rf) for departing aircraft, the objective is to find surface trajectories and pushback times for all flights such that the
A new phase field model is introduced, which can be viewed as a nontrivial generalisation of what is known as the Caginalp model. It involves in particular nonlinear diffusion terms.
L’archive ouverte pluridisciplinaire HAL, est destinée au dépôt et à la diffusion de documents scientifiques de niveau recherche, publiés ou non, émanant des
We use the HIPSE (Heavy-Ion Phase-Space Exploration) Model to discuss the origin of the bi- modality in charge asymmetry observed in nuclear reactions around the Fermi energy.. We
By collecting the main literature results and completing them with an indirect method based on the light attenuation observation of early sedimentation, we have achieved a
Theoretical equation of state for the maximal interaction model (dotted line) compared with numerical pressure measurements.. Complete equation of state for the simplified
local effective interaction is justified by the fact that in the range of relatively high temperatures explored.. in the present work, the effective mass is expected
response can be understood with a simple harmonic theory when the contact line is