HAL Id: hal-01604039
https://hal.archives-ouvertes.fr/hal-01604039
Submitted on 8 Jun 2021HAL is a multi-disciplinary open access archive for the deposit and dissemination of sci-entific research documents, whether they are pub-lished or not. The documents may come from teaching and research institutions in France or abroad, or from public or private research centers.
L’archive ouverte pluridisciplinaire HAL, est destinée au dépôt et à la diffusion de documents scientifiques de niveau recherche, publiés ou non, émanant des établissements d’enseignement et de recherche français ou étrangers, des laboratoires publics ou privés.
Distributed under a Creative Commons Attribution| 4.0 International License
Modeling spatial expansion of invasive alien species:
relative contributions of environmental and
anthropogenic factors to the spreading of the harlequin
ladybird in France
Sophie Veran, Sylvain Piry, Vincent Ternois, Christine Meynard, Benoit
Facon, Arnaud Estoup
To cite this version:
Sophie Veran, Sylvain Piry, Vincent Ternois, Christine Meynard, Benoit Facon, et al.. Modeling spatial expansion of invasive alien species: relative contributions of environmental and anthropogenic factors to the spreading of the harlequin ladybird in France. Ecography, Wiley, 2016, 39 (7), pp.665-675. �10.1111/ecog.01389�. �hal-01604039�
almost exclusively in islands (Veitch and Clout 2002), it is now widely accepted that eradication over large areas is extremely difficult when species have been established for a long time and have already modified the ecosystem (Vilà et al. 2011, Simberloff et al. 2013). The alternate approach consists of predicting and understanding invasion pathways and processes in order to prioritise strategies to control the arrival and spread of invasive alien species into their invaded ranges (Hulme 2009, 2011).
Species distribution models (SDMs) have been often employed as a tool to investigate the potential impact of invasive alien species (Weber 2001, Strubbe and Matthysen 2009). SDMs relate species occurrence to different predic-tors, mostly environmental conditions to predict the poten-tial distribution of a species across an area of interest (Guisan and Thuiller 2005, Elith and Leathwick 2009). SDMs rely on the assumption of equilibrium which states that occu-pancy has reached a stable state with respect to the relevant environmental gradients (Guisan and Zimmermann 2000).
Ecography 38: 001–011, 2015
doi: 10.1111/ecog.01389 © 2015 The Authors. Ecography © 2015 Nordic Society Oikos Subject Editor: Thorsten Wiegand. Editor-in-Chief: Miguel Araújo. Accepted 5 July 2015
Human-assisted dispersal has allowed species to cross bio-geographical barriers, introducing them to new environ-ments where they interact with native species (Williamson 1996). A subset of those species, termed invasive alien species (Williamson 1996), established successfully and expand their range rapidly in the invaded area. Some of those species pose major threats to ecosystems by modify-ing native diversity and the services they provide, and can have consequences on human health by spreading diseases or becoming agricultural pests (Pyšek and Richardson 2010). Overall, invasive alien species are acknowledged as a source of tremendous cost to the global economy (Cook et al. 2007).
Invasive alien species have been a focus of research in both natural and managed ecosystems as scientists, manag-ers, conservation biologists, and restoration biologists test various approaches for managing the impacts of these taxa (Sakai et al. 2001). Eradicating invasive alien species and restoring ecosystems has been attempted (D’Antonio and Meyerson 2002). However, despite a few successful results
Modeling spatial expansion of invasive alien species: relative
contributions of environmental and anthropogenic factors to the
spreading of the harlequin ladybird in France
Sophie Veran, Sylvain Piry, Vincent Ternois, Christine N. Meynard, Benoit Facon and Arnaud Estoup S. Veran (veran@tourduvalat.org), S. Piry, C. N. Meynard, B. Facon and A. Estoup, INRA UMR Centre de Biologie pour la Gestion des Populations, Montpellier, France, and Campus international de Baillarguet, FR-34988 Montferrier-sur-Lez, France. CNM also at: Virginia Inst. of Marine Science, College of William and Mary, PO Box 1346, Gloucester Point, VA 23062, USA. – V. Ternois, CPIE du Pays de Soulaines, Domaine de Saint-Victor, FR-10200 Soulaines-Dhuys, France.
Species distribution models (SDM) have often been used to predict the potential ranges of introduced species and prioritize management strategies. However, this approach assumes equilibrium between occurrences and environmental gradients, an assumption which is violated during the invasion process, where many suitable sites are empty because the species has not yet reached them. Here we considered the invasive ladybird Harmonia axyridis as a case study to show the benefits of using a dynamic colonization–extinction model that does not assume equilibrium. We used a multi-year occupancy model incorporating environmental, anthropogenic and neighborhood effects, to identify factors that explained spread-ing variation of this species in France from 2004, when only a few occupied sites were detected, to 2011. We found that anthropogenic factors (urbanization, agriculture, vineyards, and presence/absence of highways) explained more varia-tion in the diffusion process than environmental factors (winter and summer temperatures, wind-speed, and rainfall). The surface of urbanization was the major anthropogenic factor increasing the probability of colonization. The average summer temperature was the main environmental factor affecting colonization, with a negative effect when high or low. The neighborhood effect revealed that colonization was mostly influenced by contributions coming from a radius of 24 km around the focal cell. The contribution of neighborhood decreases over time, suggesting that H. axyridis is reaching its equilibrium in France. This is confirmed by the small discrepancy observed between the performance of our approach and a SDM approach when predicting a single year occupancy pattern at the end of the study period. Our approach has the advantage of explicitly modelling the state of the biological system during the spatial expansion and identifying colonization constraints. This allows managers to explore the effect of different actions on the system at key moments of the invasion process, hence providing a powerful approach to prioritize management strategies.
However, out of equilibrium, a site can also be empty because of dispersal limitations, which temporary prevent the species reaching such a stable state after a perturbation or at the beginning of an invasion (Pulliam 2000). Therefore SDMs can be used to predict the potential distribution of a species by analyzing its distribution in its native environ-ment, where the assumption of equilibrium is reasonable, and projecting the potential distribution at equilibrium in the invaded area (Araújo and Pearson 2005). SDMs are more problematic to use, however, when modeling the distribu-tion of a species shifting its range (i.e. when equilibrium has not yet been reached) and when making inferences about the factors affecting the dynamic process of spreading (Marco et al. 2008, Elith et al. 2010, Gallien et al. 2010).
Multi-season occupancy models represent an alternative approach for modeling a dynamic process (MacKenzie et al. 2003). They allow relaxing the assumption of equilibrium inherent of SDMs by modeling explicitly the colonization and extinction process (MacKenzie 2006). Furthermore, a recent extension of occupancy models incorporating a component accounting for spatial autocorrelation, allows modelling a contagious-type process (Bled et al. 2010, Yackulic et al. 2012). This extension is of particular inter-est for modelling the spatial spread of invasive alien species over continuous years and for assessing the relative impact of environmental or anthropogenic factors in the diffusion process.
In this study, we applied multi-season occupancy models to investigate the spread of the harlequin ladybird Harmonia
axyridis in France. This insect, native to Asia, was originally
introduced into North America and Europe as a biological control agent against aphids (Koch 2003). It is now invasive in four different continents including Europe since 2001 (Brown et al. 2011). The species has widely spread and is still spreading in these areas where it has become a harm-ful predator of non-target arthropods, a competitor of some local coccinellid species, a household invader, and a pest of fruit production (Koch 2003, Roy et al. 2012). In France,
H. axyridis was first introduced for biological control in
1982 but very few records exist until 2004, when the species started to spread across the country (Coutanceau 2006, Brown et al. 2008a, b).
Maps of first observations in France suggest a hetero-geneous process of diffusion, with some regions rapidly colonized while others were colonized after a long delay or remain uncolonized (see maps in < http://vinc.ternois. pagesperso-orange.fr/cote_nature/Harmonia_axyridis >). Population genetics data show that this heterogeneous diffusion is not due to multiple introductions, as it is the case in several other countries (Lombaert et al. 2014a, b). It is worth noting, however, that a biocontrol strain of H.
axyridis has been recurrently introduced for many years in
different areas in Europe (including France) for biocontrol use (Brown et al. 2011). Population genetics studies have shown that, although this strain was not at the origin of the main invasive population in France (the initial invasive propagule originating from eastern North America), individuals from European biocontrol introductions introgressed genetically with those from North America (Lombaert et al. 2014b). The heterogeneous process of diffusion observed in France may be explained by (un)suitable environmental conditions and/
or by (un)favorable diffusion factors. In particular, the dif-fusion of many invasive alien species might be facilitated by anthropogenic factors such as the land use homogenization caused by agricultural practices, landscape features (includ-ing urbanization) or the acceleration of trade and transport (Olden et al. 2004, Hufbauer et al. 2012). Disentangling the relative contributions of both environmental and anthropo-genic factors during the diffusion is a key step for designing management actions.
Our study, using the case of the spread of H. axyridis in France, aims at 1) modeling the expansion of an invasive alien species integrating both anthropogenic and environ-mental factors; 2) understanding the spatial and temporal variation of the diffusion pattern; 3) measuring the relative contributions of the different factors affecting the diffusion process and 4) predicting further spread of H. axyridis in France.
Methods
Observation dataObservation data of H. axyridis were collected by the ‘observatoire permanent pour le suivi de la Coccinelle asia-tique en France’ (Permanent observatory for the monitoring of the harlequin ladybird in France), a network composed of regional coordinators compiling the observations made by about 1800 voluntary participants from all over the French territory (Ternois et al. 2012). A total of 5206 observations of H. axyridis individuals or populations and their given locations were reported between 2004 and 2011. We divided the surface of France into a regular grid with square cells of 8 by 8 km, corresponding to the grid cell of the meteorologi-cal data SAFRAN from Meteo France (the French national meteorological service). The final partition of the studied area included 9891 cells. In order to model the expansion of its distribution area, we needed to discriminate between colonized and non-colonized cells over time and space. The network coordinating the monitoring of H. axyridis included observers distributed evenly over the entire French country Thus, although the sampling design did not properly cor-respond to a design of presence–absence, we assumed that the large number of evenly distributed observers allowed us to consider as true absence data the cells with no H. axyridis observed in it, and as presence a cell with one or more obser-vations of the species in it. To test and account for a possible bias in detecting the species due to uneven sampling effort, with regions densely inhabited being potentially more sur-veyed than less populated areas, we included in the analysis a covariate of density of human population (see also Isaac et al. 2014). To this end, we used data of density of French popu-lation provided by the French National Inst. of Statistics and Economic Studies ( www.insee.fr/ ).
Environmental factors
Harmonia axyridis survival is known to be strongly affected
by temperature, with survival of the different stages and eggs hatching following a quadratic response: H. axyridis survival decreasing at low and high temperatures (Lamana and Miller
1998, Koch 2003). We here tested more specifically for an effect of average winter temperature (January to March) and average summer temperature (June to August) per cell per year. Wind is also expected to influence the probability and distance of dispersal of flying individuals (Jeffries et al. 2014), but because H. axyridis diapauses during cooler periods, we included in the models a covariate of average wind speed from May to October (Majerus 1994). Finally, we included a covariate of average precipitation between May to October because rainfall results in an advantage to growing plants and therefore production of aphids, a preferred food source of
H. axyridis (Roy et al. 2012, Purse et al. 2014). All
environ-mental data (average winter and summer temperature, wind speed, and average precipitation in each cell and for each year, as described above) were obtained from the SAFRAN climate database (Meteo-France).
Anthropogenic factors
Biological invasions are often human-induced events (Williamson 1996). To account for human-related diffusion of H. axyridis in France, we used as a proxy for the likeli-hood of human transportation the presence of a highway in a cell and tested if cells with highways were more likely to be colonized. A highway in France corresponds to a main road (with at least four lanes) connecting major towns or cities. The highway network in France is dense (i.e. 142 dif-ferent highways with a total length of 13 000 km in 2014). Highways concentrate the largest part of middle to long distance transportation of produce and people within the country. We hence considered that the presence/absence of highways might represent a sensible proxy to account for human related diffusion of H. axyridis in France. The disturbance of natural habitats by human activities (mainly agriculture and urbanization) is also thought to facilitate bioinvasions, for instance by homogenising the environ-ment over large geographical scales (Hufbauer et al. 2012). To test for this hypothesis we included covariates of human-altered habitats where H. axyridis has been found: in crops (Vandereycken et al. 2013), in vineyards (Koch 2003) and in urban areas (Adriaens et al. 2008). All these covariates were quantified by their surface within a cell, this informa-tion being provided by Corine Land Cover data (< www.eea. europa.eu/data-and-maps >).
The different environmental and anthropogenic covari-ates used in our modeling are summarized in Table 1.
Modeling
We followed the multi-season occupancy approach described in Yackulic et al. (2012) to model the dynamics of the inva-sion process. We modelled the state of occupancy of a cell as a function of extinction and colonization. The probability of extinction ei,t, is defined as the probability of a cell i not
occupied at time t 1 conditional on the cell being occu-pied at time t. The probability of colonization gi,t, is defined
as the probability of a cell i occupied at time t 1 condi-tional on the cell being non-occupied at time t (MacKenzie et al. 2003). The probability that a cell i is occupied at time
t 1, yi,t 1 is then :
yi,t 1 yi,t (1 – ei,t) (1 – yi,t) gi,t
To account for the spatial expansion process, an autologis-tic component can be added in either the colonization or extinction parameters (Bled et al. 2010, Yackulic et al. 2012). During its expansion, an invasive alien species will diffuse to neighboring sites and thus an empty site will be more likely colonized if the species already occupies its neighborhood. As defined in Yackulic et al. (2012), if a focal site i has ni sites
in its neighborhood, the average probability of occupancy of this neighborhood can be estimated by πn ∈ ψ∧
i j t j n i t i n , 1
∑
{ } ,where ψ∧j t, is the estimated probability that a neighboring
site j is occupied at time t. To test for several hypotheses about the capacity of diffusion, we considered different sizes of neighborhood. The smallest neighborhood considered included the first layer of surrounding cells, and thus a maxi-mum diffusion distance of about 16 km corresponding to the most distant points from two adjacent cells. The largest neighborhood considered included a possible diffusion of insects distant from up to 5 cells from the focal site i, which corresponds to a maximum diffusion distance of about 48 km. Then, colonization can be modeled as a function of the neighborhood occupancy such as for example:
logit ( )γi,t β0,t+β π1,tni t,
Anthropogenic and environmental factors also affect the dynamic by increasing or decreasing the rates of coloniza-tion. To model their impact, we included them as covariates in the model as following:
logit ( ) ( ) ( )2
, , ,
γi,t β0t+β π1t$ni t+
λ
Y Y +µ
Y Ywhere m and l are the estimated vectors of parameters of a quadratic response to the vector of anthropogenic and environmental covariates Y.
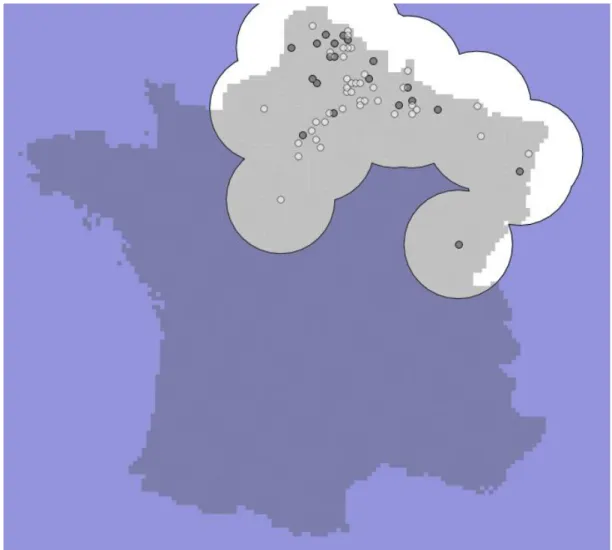
Defining the absence area in case of invasion requires additional assumptions. As a matter of fact, during the phase of expansion, only a proportion of the study area has the potential to be invaded, this proportion being a function of the dispersal rate of the invader. Therefore, only sites within that study area that could potentially be invaded were inte-grated in the model. We included this potentially invaded region in the following way. At time t, nt sites have been
recorded as colonized. At time t 1 Δ new sites are colonized. These Δ new sites are obviously part of a region invaded at time t. We then included a buffer zone around these Δ sites to account for other potential sites, and those new sites were added to the older sites already included in the poten-tial invaded zone (see Supplementary material Appendix 1, Fig. A1 for an illustration). The buffer zone depends on the capacity of dispersion of the species. In the case of H.
axy-ridis, we used a buffer zone of 50 km around the new
colo-nized sites, approximately corresponding to the maximum neighborhood effect tested. Therefore, the study area varies over time. To account for this, we coded data in the grid cells as follows: inside the potential invaded zone, each site is coded with 0 or 1 to account for the species observed or not observed, whereas outside the potential invaded zone, each site is simply considered as not surveyed (no data value).
of neighborhood effect over time (pi) versus a time varying
component of neighborhood effect (pi,t).
Model validation and forecasting H. axyridis’s distribution
We used observation data from 2004 to 2010 to estimate the different parameters of the models and to perform model selection. Data of year 2011 was kept apart and used to measure model performance using the following approach: starting from the observations of 2004, we projected the prob-ability of presence in each cell and for each year until 2010, the last year of data used in the model. We then predicted the distribution of H. axyridis over the period 2011–2020. We compared the predictions for 2011 with the observations for the same year. We calculated the area under the receiver operating characteristic curve, known as AUC and the Kappa statistic, two standard methods used to estimate the predic-tive accuracy of distributional models derived from presence– absence data. We set the threshold that maximizes the aver-age of the sensitivity and the specificity, using the R packaver-age ‘PresenceAbsence’ (Freeman and Moisen 2008).
Comparison with classical niche modeling approaches
We compared the above measures of model performance with the same ones estimated from a classical (and hence static) approach of niche modelling (also called species distribution modeling; SDM). For this we used Boosted Regression Trees (BRT) (Elith et al. 2008) with the same environmental and anthropogenic covariates pooled over the 2004–2010 period. We then estimated the same indices of model validation (respectively AUCBRT and KappaBRT) by
comparing predictions of H. axyridis’ distribution in 2011 with the observations of 2011.
Data available from the Dryad Digital Repository: http://dx.doi.org/10.5061/dryad.jg613 (Veran et al. 2015).
It is worth stressing that here we assumed the absence of local extinction. In other words, once a cell has been colonized it remained occupied for the following years. This pattern of low to null local extinction is often observed in invasive populations during the diffusion stage (Facon and David 2006) and is confirmed by our own experience of recurrent annual collection in the field of H. axyridis in France for the last five years. Raw observation data compiled in the analyzed database also supported this assumption to a large extent. As a matter of fact, we found that when a cell was first colonized, it remained colonized the following years. We note however that for a few cells, observations were not continuous over time. Those few years without observa-tions were likely due to a lack of report rather than to a local extinction. As a matter of fact, once a given observer had reported a colonized site, he/she was unlikely to report the same site the following year but reported new sites instead. This bias is to a large extent compensated by the presence of multiple observers within a cell.
We used the software PRESENCE (< www.mbr-pwrc. usgs.gov/software/presence.html >) to perform model selec-tion and estimate the different parameters of the models using a maximum-likelihood approach. Two covariates, den-sity of human population and surface of urbanization, were highly correlated between them (r 0.726). Including both of them in the analysis would have increased instability when estimating regression coefficients (Graham 2003). Therefore, we first compared full models incorporating either density of human population or surface of urbanization, and kept for the following steps of model selection the covariate from the model with lowest AIC. In a second step, we selected among models considering different sizes of neighborhood (pi), from one layer of cells (p1) to five layers of cells (p5).
We then tested among the different models for the relative contribution of anthropogenic versus environmental factors and estimated a relative contribution of each factor using a likelihood ratio test (LRT), comparing the deviance between the full model and the full model without one factor at a time. The different LRT were then transformed to sum 1 and used as a measure of relative contribution. Lastly, we built a model to test for the hypothesis of a constant component
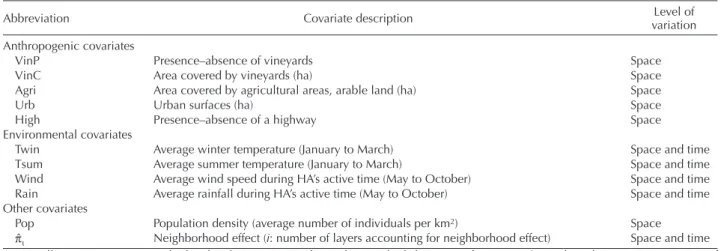
Table 1. Covariates used for modeling g the probability of colonization of H. axyridis.
Abbreviation Covariate description variationLevel of Anthropogenic covariates
VinP Presence–absence of vineyards Space
VinC Area covered by vineyards (ha) Space
Agri Area covered by agricultural areas, arable land (ha) Space
Urb Urban surfaces (ha) Space
High Presence–absence of a highway Space
Environmental covariates
Twin Average winter temperature (January to March) Space and time Tsum Average summer temperature (January to March) Space and time Wind Average wind speed during HA’s active time (May to October) Space and time Rain Average rainfall during HA’s active time (May to October) Space and time Other covariates
Pop Population density (average number of individuals per km2) Space
pˆi Neighborhood effect (i: number of layers accounting for neighborhood effect) Space and time
Notes: all covariates were standardized to have a mean of 0 and a standard deviation of 1 except pˆi, High and VinP. Time variation of
Table 2. Model selection results for the H. axyridis dataset. The probability of colonization g is decomposed into environmental covariates and/or anthropogenic covariates and an autologistic component. Models are arranged following the different hypothesis tested: a – contribution of urban areas versus density of population, b – number of layers of the autologistic component (pˆi: effect of i layers of cells),
c – contribution of the different covariates, d – time varying autologistic component – (pˆi t). Models are compared with ΔAIC and Akaike
weight (w). k indicates the number of parameters of the model. Abbreviations of the different covariates are explained in Table 1. Square power indicates a quadratic response.
Probability of colonization g
Autologistic component Environmental factors Anthropogenic factors ΔAIC w k AIC
Time varying g 0 1 9 12625
Null model : g constant 716 0.01 4 13341 a – Urban area versus density of population
– Twin2 Tsum2 Wind2 Rain2 Urb2 VinP VinL Agri2 High 0 1 19 11947
– Twin2 Tsum2 Wind2 Rain2 Pop2 VinP VinL Agri2 High 116 0.01 19 12163
b – Selection of the auto-logistic component for a full model with urban area
pˆ3 Twin2 Tsum2 Wind2 Rain2 Urb2 VinP VinL Agri2 High 0 0.86 20 11590
pˆ2 Twin2 Tsum2 Wind2 Rain2 Urb2 VinP VinL Agri2 High 4 0.11 20 11594
pˆ4 Twin2 Tsum2 Wind2 Rain2 Urb2 VinP VinL Agri2 High 7 0.02 20 11597
pˆ5 Twin2 Tsum2 Wind2 Rain2 Urb2 VinP VinL Agri2 High 17 0.01 20 11607
pˆ1 Twin2 Tsum2 Wind2 Rain2 Urb2 VinP VinL Agri2 High 37 0.01 20 11627
c – Contribution of the different environmental and anthropogenic covariates
pˆ3 Twin2 Tsum2 Wind2 Rain2 Urb2 VinP VinL Agri2 0 0.73 19 11607
pˆ3 Twin2 Tsum2 Rain2 Urb2 VinP VinL Agri2 High 2 0.26 18 11609
pˆ3 Twin2 Tsum2 Wind2 Urb2 VinP VinL Agri2 High 17 0.01 18 11624
pˆ3 Tsum2 Wind2 Rain2 Urb2 VinP VinL Agri2 High 36 0.01 18 11643
pˆ3 Twin2 Tsum2 Wind2 Rain2 Urb2 Agri2 High 43 0.01 18 11650
pˆ3 Twin2 Tsum2 Wind2 Rain2 Urb2 VinP VinL High 50 0.01 18 11657
pˆ3 Twin2 Wind2 Rain2 Urb2 VinP VinL Agri2 High 173 0.01 18 11780
pˆ3 Twin2 Tsum2 Wind2 Rain2 VinP VinL Agri2 High 503 0.01 18 12110
d – Temporal variation of the autologistic component
pˆ3 t Twin2 Tsum2 Wind2 Rainé Urb2 VinP VinL Agri2 High 0 1 12 10880
Results
Relative contributions of environmental and anthropogenic factors
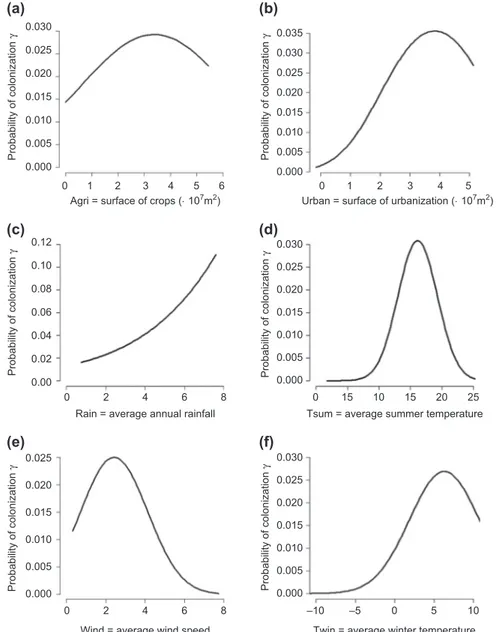
We found that the rate of colonization of H. axyridis in France is heterogeneous in time and space. This heterogene-ity is better accounted for when incorporating a covariate of urbanization rather than a covariate of density of human population (Table 2a). We found that urbanization is the covariate which contributes the most to the full model (53.0%), followed by summer temperature (19.6%), surface of agriculture (7.2%), of vineyards (6.5%) and winter tem-perature (5.8%) (Table 2c and Fig. 1). Rainfall, wind and presence of highways only slightly contributed to the full model ( 5% for all covariates). Overall, the relative con-tribution of anthropogenic factors to the variation of colo-nization explained by the full model reaches 68.5% whereas environmental factors contribute the complementary 31.5% (Table 2c and Fig. 1). The response curves of colonization to the different predictors (Fig. 2) point to an optimal range of several environmental conditions: an average summer temperature around 15°C, an average winter temperature around 5°C and an average wind speed around 2 m s–1,
whereas the rate of colonization increases with increasing rainfall. Regarding the anthropogenic factors, colonization is highest for a surface of crops per cell of 3000 ha (about 46% of the cell) and for a surface of urbanization of about 4000 ha per cell (about 62% of the cell), whereas it increases steadily with the surface of vineyards. The presence of a highway in a cell only slightly increases the rate of colonization (i.e. an
increase of 0.285 in the logit scale), which corresponds to a 7% increase of the probability of colonization.
Neighborhood effect
Adding a component of spatial autocorrelation increases the fit of the model. Among the different levels of neigh-borhood considered, the model composed of three rows of cells performs better. Adding more rows increases the AIC, indicating a lower fit of the model (Table 2b). This implies that sites located within 3 neighboring cells (about 24 km) from a focal site represent the main contribution to colonization. Interestingly, the intensity of spatial correlation
0 10 20 30 40 50 60
Highways (High) Wind Rainfall (Rain) Winter temperature (Twin) Vineyards (VinP+Vinc) Agriculture (Agri) Summer temperature (Tsum) Urban area (Urb)
Relative contribution
Figure 1. Relative contribution of the different covariates included in the model of colonization of France by H. axyridis. Black bars represent anthropogenic covariates, white bars environmental ones.
0.000 0.005 0.010 0.015 0.020 0.025 0.030
Rain = average annual rainfall Tsum = average summer temperature Agri = surface of crops (× 107m2) Urban = surface of urbanization (× 107m2)
Wind = average wind speed Twin = average winter temperature
0 1 2 Probability of colonization γ 0.000 0.005 0.010 0.015 0.020 0.025 0.035 0.030 Probability of colonization γ 0.00 0.02 0.04 0.06 0.08 0.10 0.12 Probability of colonization γ 0.000 0.005 0.010 0.015 0.020 0.025 Probability of colonization γ 0.000 0.005 0.010 0.015 0.020 0.025 0.030 Probability of colonization γ 0.000 0.005 0.010 0.015 0.020 0.025 0.030 Probability of colonization γ 3 4 0 2 4 6 8 5 6 0 1 2 3 4 5 0 15 10 15 20 25 0 2 4 6 8 –10 –5 0 5 10 (a) (b) (c) (d) (e) (f)
Figure 2. Response curves of the probability of colonization g of a cell by H. axyridis as a function of the different covariates. Covariates are: (a) Agri surface of crops (in m2), (b) Urb surface of urbanized area (in m2) in a cell, (c) Rain average annual amount of rainfall
from May to October (in mm), (d) Tsum average summer temperature (in celsius), (e) Wind average wind speed (in m s–1) and (f)
Twin average winter temperature (in celsius).
varies in time (Table 2d). The estimated parameter bˆ 1,t of the
autologistic component decreased from 19.52 (SE 4.50) in 2005 to 0.69 (SE 0.37) in 2010 (Fig. 3a). This repre-sents a strong shift over time towards a lower sensitivity of a cell to its neighboring ones (Fig. 3b).
Model validation
We evaluated the model accuracy by projecting the diffusion of H. axyridis over time, starting from the observations of 2004 and modeling the probability of presence over time using the different parameters estimated from the best occu-pancy model (Supplementary material Appendix 1, Fig. A2). To predict the distribution of H. axyridis in 2011, we pre-dicted the coefficient of autocorrelation for 2011 based on an exponential regression of the estimated parameters bˆ 1,t
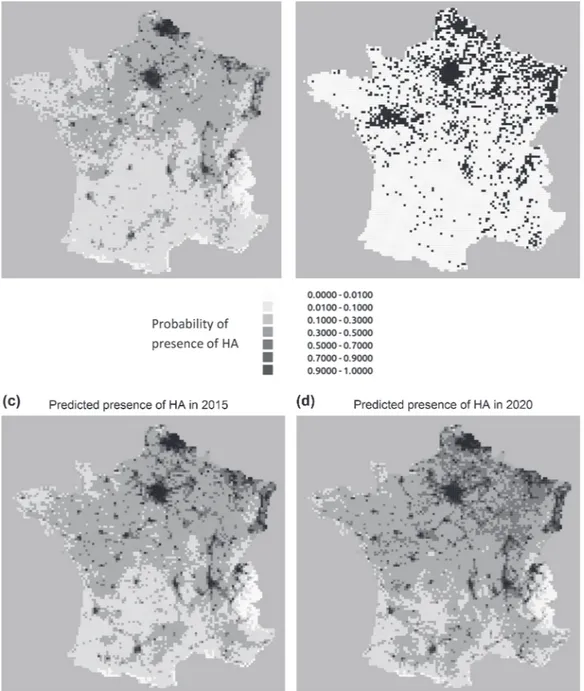
from 2004 to 2010 (Fig. 3a). The AUC from comparing the predictions of the distribution of H. axyridis in 2011 (Fig. 4a) with the observations made in 2011 (Fig. 4b) equals 0.792. Kappa equals 0.317 for a maximum average sensitiv-ity and specificsensitiv-ity of, respectively, 0.728 and 0.706.
Comparison with classical niche modeling approaches
We compared the above measures of model performance with the same ones estimated from a classical approach of niche modeling using boosted regression trees (BRT). The indices calculated from the BRT approach give similar but slightly lower values: AUCBRT 0.786 and a KappaBRT 0.299 for
a maximum average sensitivity and specificity of 0.713 and 0.707, respectively.
0 5 10 15 20 25 30 (a) (b) 0.0 0.0 0.2 0.4 0.6 0.8 1.0 0.2 0.4 0.6 0.8 1.0 2005 2006 2007 2008 2009 2010 2011 Year Autologistic component
Average probability of occupancy within the neighborhood π^3 at time t
Probability of colonization
γ at time
t+
1
Figure 3. (a) Estimates and confidence intervals of the neighbor-hood parameters of a model of colonization with autologistic time varying coefficients. The line represents the fit of an exponential regression based on the estimated parameters from 2005 to 2010 (x) whereas 2011 (•) is predicted from the exponential regression. (b) Response curves of the probability of colonization g at time t 1 of a cell by H. axyridis as a function of its neighborhood occupancy at time t. The x-axis is the average probability of occu-pancy within the neighborhood (pˆ3) of a site i at the previous time
step. Plain lines represent the response curve at the first time inter-val (2004–2005), dash lines – at the second time interinter-val (2005– 2006), dot lines (…) at the third one (2006–2007), dash-dot (-.-.) at the fourth (2007–2008), long dash (– – –) at the fifth (2008– 2009) and long dash dot (–.–.–.) at the sixth one (2009–2010).
Predictions of the future distribution of H. axyridis
The predictions of the future spatial distribution of H.
axyridis in France from 2012 to 2020 using our dynamic
model indicate a strong deceleration of the species expan-sion in the south of France and increasing probabilities of presence in the north east of France (Fig. 4c and d).
Discussion
We found that the spatial spread of H. axyridis in France is heterogeneous in space and time, and therefore does not only
depend on its capacity of dispersal but also on environmen-tal and anthropogenic factors that increase or decrease its dif-fusion ability. The response of H. axyridis to climatic factors follows, as predicted by its biology, a quadratic response for summer and winter temperatures, with a substantial decrease at low and high temperatures (Lamana and Miller 1998). In the same way, too slow and too fast wind speed appear disadvantageous for H. axyridis dispersal. Finally, we found that rainfall is a favorable factor, probably by increasing food availability.
Interestingly, our results show that anthropogenic factors represent strong components in the process of diffusion of H. axyridis. Among anthropogenic factors, the surface of urbanization explains more than half of the variation of colonization induced by external factors. More specifically, we found that low urban densities, corresponding to rural areas, are not favorable habitats. Harmonia axyridis mostly feeds on aphids, whose highest densities are found in plants and trees of parks and gardens in urban and peri-urban zones (Majerus 1994, Adriaens et al. 2008). Moreover, the urban environment provides buildings, which are the pre-ferred overwintering location for this species (Brown et al. 2008a, Roy et al. 2012). In agreement with this, higher H.
axyridis densities in urban areas was found in other parts
of the invasive range, for example in Great Britain (Brown et al. 2008b) and Belgium (Adriaens et al. 2008), and the species was found to spread more rapidly into areas con-taining a high proportion of urban land cover (Purse et al. 2014). We found, however, that very high levels of urban-ization appear unfavorable to colonurban-ization. Although
H. axyridis might be present at a local scale in trees or
gardens, the density of such favorable habitats declines in highly urbanized areas at the spatial scale of cells of 8 by 8 km. This may explain, at least partly, the quadratic shape of the response curve.
It is worth noting that the surface of urbanization in a cell is highly correlated to density of human population which is itself a proxy of a potential observer effect. We therefore cannot exclude an artefact in the response curve, especially at low urban densities. More specifically, the first part of the response curve, showing a strong increasing probability of colonization with an increase of surface of urban area could reflect a confounding effect due to an increasing number of potential observers. Only a different sampling design allow-ing separation of the observation process with the biologi-cal process could discriminate between the two hypotheses (MacKenzie et al. 2003). The quadratic response we found for this covariate with a decreasing colonization at high urban densities suggests, however, that a biological process is probably involved and that highly urbanized areas are indeed unfavorable for H. axyridis colonization.
Among other anthropogenic factors impacting H.
axyridis colonization, we found a favorable impact of
increas-ing surfaces of crops and vineyards up to a threshold of surface cultivated (cf. quadratic shape of the response curve), in agreement with previous studies mentioning the presence of H. axyridis on crops and vineyards (Pickering et al. 2005, Vandereycken et al. 2013). The low positive impact of the presence of highways on the probability of colonization indi-cates that produce and people transportation via main roads might not play a strong role in H. axyridis diffusion.
Figure 4. Predicted and observed spatial distributions of H. axyridis (HA) in France (a) predicted in 2011 from our modeling approach, (b) observed in 2011 and to be compared with (a), (c) predicted in 2015 and (d) predicted in 2020.
Our study confirms that classical mechanistic models of invasion based on differential equations (Okubo and Levin 2001) need to account for heterogeneous diffusion in order to model more accurately the diffusion process observed in the field (Wikle 2003). On the other hand, classical niche modeling outcomes are limited by the non-temporal, static structure of the modeling (Araújo and Pearson 2005, Marco et al. 2008, Elith et al. 2010). The approach of dynamic occupancy models used here is more mechanistic than niche modeling, accounts for the tem-poral component of the diffusion process and at the same time integrates the heterogeneity of this process induced by external factors, either environmental or anthropogenic. A major difficulty when modeling a process of invasion is to account for diffusion. In the present study, diffusion is not
explicitly integrated in the model with a parameter of dis-persal but through a proxy of spatial autocorrelation (Bled et al. 2010, Yackulic et al. 2012). Our results indicate that individuals located within three neighboring cells (up to 24 km) from a focal site represent the main contribution to colonization to the focal site. These results are consis-tent with estimates of dispersal distances, with flights of tens to hundreds of meters measured experimentally (Seko et al. 2008). However, we cannot exclude the potential impact of long distance dispersal by wind or anthropo-genic sources, evaluated in Europe to be a maximum of 200 km yr–1 (Brown et al. 2011, Jeffries et al. 2014). Such
long distance dispersal events are nevertheless rather rare and hence poorly accounted for in the parameter of inter-cept of our model.
as among the study area, there might have been locations surveyed by observers with no H. axyridis detected as well as locations not surveyed at all. There is an abundant literature about the issues of using presence-only data (Brotons et al. 2004, Hastie and Fithian 2013). The debate remains intense for niche modeling and it is likely that dynamic models such as our model are even more sensitive to misclassifications. Furthermore, even when all the study area is surveyed, the issue of true absence versus non detection remains, unless an appropriate design of temporal or spatial replicates is con-ducted (MacKenzie 2006). Thus, in order to improve the quality of the models and to exclude a potential bias in the analyses due to the data itself, we advocate elaborating as much as possible proper data of presence–absence with a design including spatial or temporal replicates to disentan-gle true absence and non-detection (see also Yackulic et al. 2013).
Another factor that could explain why AUC and Kappa were not higher here relies on the nature of these indices themselves. Both indices evaluate how well the predictions match the data in terms of presence and absence, ignoring the actual probabilities of occurrence. However it has been shown that these indices have lower values in cases where stochastic processes play a large role (Meynard and Kaplan 2012), and are best suited for threshold-type of situations that arise when pulling occurrence data over long time peri-ods and large regions (Meynard and Kaplan 2012, 2013). Unfortunately there is no equivalent alternative to measure the match and mismatch in the predicted probabilities of occurrence, which would require large amounts of data (e.g. calibration plots suggested in Pearce and Ferrier 2000). This is one of the reasons why the SDM literature has been domi-nated by this type of indices. Here we used our models to predict values for a single year, 2011, as our validation pro-cedure, which will inevitably have more stochasticity in it as compared to occurrence data grouped over decades.
Because it allows relaxing the assumption of equilibrium, applying a dynamic approach when modeling the invasion process represents a powerful tool to prioritize management strategies of invasions. Indeed a majority of studies on spe-cies range shifts use statistical spespe-cies distribution models (SDMs) even if they seriously violate the assumption of equilibrium (Elith and Leathwick 2009, Elith et al. 2010). While range shifting taxa are often the species for which pre-dictions of potential distributions are needed the most for prioritizing mitigation measures, their usefulness for guiding policy making and planning has been questioned (Araújo and Guisan 2006). Another property of dynamic model-ing is its ability to follow and model the diffusion process and not only its results, as opposed to just focusing on the final maps of potential distribution at equilibrium when using niche modeling. A dynamic approach allows predict-ing and understandpredict-ing invasion pathways, enablpredict-ing the design and prioritization of strategies to control the spread of invasive alien species into their non-native ranges (Hulme 2009, 2011). Furthermore, because the state of the biologi-cal system is modeled explicitly, sites being colonized or not over time can be predicted as a function of different factors. Therefore managers can predict the efficiency of their miti-gation measures over time, learn from their management outcomes and adapt their strategy, which means applying A drawback of the above approach is that it is by
con-struction a proxy and therefore it includes any spatially cor-related factor that impacts the distribution of the species, unless such factor is explicitly modeled. In the case of H.
axyridis, we have included in the model what are known
to be and what could be major drivers of its distribution though we obviously cannot exclude having omitted some. A second interest of using a proxy of diffusion is its property of measuring the strength of the diffusion and the distance to equilibrium. Yackulic et al. (2012) used simulations to show that neighborhood effect can be detected during tran-sience dynamic. On the other hand, systems with occupancy levels close to equilibrium will not show important autolo-gistic effects. Our results are consistent with this statement. We indeed found a clear decrease of the autologistic compo-nent over time (Fig. 3a), resulting in a strong neighborhood effect at the beginning of the invasion in France and a very weak one in 2010, the last years of observed data (Fig. 3b). This indicates that the population of H. axyridis is reaching its equilibrium in France. Therefore H. axyridis invasion is expected to at least slow down if not stop, which is illustrated with the maps forecasting its distribution in 2020 (Fig. 4d). We argue that estimates of successive neighborhood effect could be seen as a marker of invasion, indicating how far the process is from equilibrium.
We validated our modeling approach by calculating AUC and Kappa indices. We found that such indices of model val-idation were similar to those calculated using a classical static model based on boosted regression tree, yet always slightly higher. It is worth stressing that this result was obtained despite the fact that in our dynamic model we predicted the occurrence of 2010 starting with observational data of 2004 which only includes 20 occupied cells. The small discrepancy between the model based on boosted regression tree which assumes equilibrium and our dynamic modeling approach is another indicator that H. axyridis expansion in France is indeed reaching its equilibrium. The apparent difficulty for
H. axyridis to spread farther south in France is corroborated
by the lack of success of the species in southern European countries such as Spain, Portugal and Greece (Brown et al. 2008a, 2011). The explicative factors remain unknown, but the fact that we found that summer temperature was the main environmental factor having a negative impact on colonization provides a first clue to these modeling results and observations in the field.
Although a value of AUC of 0.792 can be considered as fairly good compared to 0.5 as expected under a pure ran-dom model, the low threshold value of probability of pres-ence used for calculating both Kappa and KappaBRT indicates
that the discrimination between colonized and uncolonized sites is not obvious and that none of the models captured all the determinism of the diffusion process. This could be due to major driver(s), whether environmental or anthropogenic, not included in our model, although we took special care to include the relevant factors known to affect the biology of the species and the habitats where H. axyridis has been found (Koch 2003, Adriaens et al. 2008, Roy and Wajnberg 2008). Another factor which might also explain the limited performance of the modeling could be the data of presence– absence itself. We assumed absence of species when no pres-ence was recorded. This assumption is probably partially true
Guisan, A. and Zimmermann, N. E. 2000. Predictive habitat dis-tribution models in ecology. – Ecol. Model. 135: 147–186. Guisan, A. and Thuiller, W. 2005. Predicting species distribution:
offering more than simple habitat models. – Ecol. Lett. 8: 993–1009.
Hastie, T. and Fithian, W. 2013. Inference from presence-only data; the ongoing controversy. – Ecography 36: 864–867. Holling, C. S. 1978. Adaptive environmental assessment and
management. – Wiley.
Hufbauer, R. A. et al. 2012. Anthropogenically induced adaptation to invade (AIAI): contemporary adaptation to human-altered habitats within the native range can promote invasions: anthro-pogenically induced adaptation to invade. – Evol. Appl. 5: 89–101.
Hulme, P. E. 2009. Trade, transport and trouble: managing invasive species pathways in an era of globalisation. – J. Appl. Ecol. 46: 10–18.
Hulme, P. E. 2011. Biosecurity: the changing face of invasion biology. – In: Richardson, D. M. (ed.), Fifty years of invasion ecology – the legacy of Charles Elton. Blackwell, pp. 301–314.
Isaac, N. J. et al. 2014. Statistics for citizen science: extracting signals of change from noisy ecological data. – Methods Ecol. Evol. 5: 1052–1060.
Jeffries, D. L. et al. L.2014. Characteristics and drivers of high-altitude ladybird flight: insights from vertical-looking entomological radar. – PLoS One 8: e82278.
Keith, D. A. et al. 2011. Uncertainty and adaptive management for biodiversity conservation. – Biol. Conserv. 144: 1175–1178. Koch, R. L. 2003. The multicolored Asian lady beetle, Harmonia
axyridis: a review of its biology, uses in biological control, and non-target impacts. – J. Insect Sci. 3: 32.
Lamana, M. L. and Miller, J. C. 1998. Temperature-dependent development in an Oregon population of Harmonia axyridis (Coleoptera: Coccinellidae). – Environ. Entomol. 27: 1001–1005.
Lombaert, E. et al. 2014a. Rapid increase in dispersal during range expansion in the invasive ladybird Harmonia axyridis. – J. Evol. Biol. 27: 508–517.
Lombaert, E. et al. 2014b. Complementarity of statistical treatments to reconstruct worldwide routes of invasion: the case of the Asian ladybird Harmonia axyridis. – Mol. Ecol. 23: 5931–6205. MacKenzie, D. I. 2006. Occupancy estimation and modeling:
inferring patterns and dynamics of species occurrence. – Academic Press.
MacKenzie, D. I. et al. 2003. Estimating site occupancy, coloniza-tion and local extinccoloniza-tion when a species is detected imperfectly. – Ecology 84: 2200–2207.
Majerus, M. E. N. 1994. Ladybirds. – Harper Collins.
Marco, P. D. et al. 2008. Spatial analysis improves species distribution modeling during range expansion. – Biol. Lett. 4: 577–580.
Meynard, C. N. and Kaplan, D. M. 2012. The effect of a gradual response to the environment on species distribution modeling performance. – Ecography 35: 499–509.
Meynard, C. N. and Kaplan, D. M. 2013. Using virtual species to study species distributions and model performance. – J. Biogeogr. 40: 1–8.
Okubo, A. and Levin, S. A. 2001. Diffusion and ecological problems: modern perspectives. – Springer.
Olden, J. D. et al. 2004. Ecological and evolutionary consequences of biotic homogenization. – Trends Ecol. Evol. 19: 18–24. Pearce, J. and Ferrier, S. 2000. Evaluating the predictive
performance of habitat models developed using logistic regres-sion. – Ecol. Model. 133: 225–245.
Pickering, G. J. et al. 2005. The influence of Harmonia axyridis on wine composition and aging. – J. Food Sci. 70: S128–S135.
an adaptive management framework (Holling 1978, Keith et al. 2011, Williams 2011).
Acknowledgements – We thank Eric Lombaert, Thomas Guillemaud, Jean-Pierre Rossi, Emmanuelle Jousselin, Armelle Coeur-d’Acier, Marc Kenis and Gilles San Martin for fruitful discussions. This work was funded by a grant from the French Agropolis Fondation (RTRA, Montpellier, BIOFIS project #1001-001). This paper is Contribution no. XXXX of the Virginia Inst. of Marine Science, College of William and Mary.
References
Adriaens, T. et al. 2008. Invasion history, habitat preferences and phenology of the invasive ladybird Harmonia axyridis in Belgium. – In: Roy, H. E. and Wajnberg, E. (eds), From bio-logical control to invasion: the ladybird Harmonia axyridis as a model species. Springer, pp. 69–88.
Araújo, M. B. and Pearson, R. G. 2005. Equilibrium of species’ distributions with climate. – Ecography 28: 693–695. Araújo, M. B. and Guisan, A. 2006. Five (or so) challenges for
species distribution modelling. – J. Biogeogr. 33: 1677–1688. Bled, F. et al. 2010. Hierarchical modeling of an invasive spread:
the Eurasian collared-dove Streptopelia decaocto in the United States. – Ecol. Appl. 21: 290–302.
Brotons, L. et al. 2004. Presence–absence versus presence-only modeling methods for predicting bird habitat suitability. – Ecography 27: 437–448.
Brown, P. M. J. et al. 2008a. Harmonia axyridis in Europe: spread and distribution of a non-native coccinellid. – BioControl 53: 5–21.
Brown, P. M. J. et al. 2008b. Harmonia axyridis in Great Britain: analysis of the spread and distribution of a non-native coccinel-lid. – BioControl 53: 55–67.
Brown, P. M. J. et al. 2011 The global spread of Harmonia axyridis (Coleoptera: Coccinellidae): distribution, dispersal and routes of invasion. – BioControl 56: 623–641.
Cook, D. C. et al. 2007. Predicting the economic impact of an invasive species on an ecosystem service. – Ecol. Appl. 17: 1832–1840.
Coutanceau, J.-P. 2006. Harmonia axyridis Pallas, 1773): une Coc-cinelle asiatique introduite, acclimatée et en extension en France. – Bull. Soc. Entomol. France 111: 395–401.
D’Antonio, C. M. and Meyerson, L. A. 2002. Exotic plant species as problems and solutions in ecological restoration: a synthesis. – Restor. Ecol. 10: 703–713.
Elith, J. and Leathwick, J. R. 2009. Species distribution models: ecological explanation and prediction across space and time. – Annu. Rev. Ecol. Evol. Syst. 40: 677–697.
Elith, J. et al. 2008. A working guide to boosted regression trees. – J. Anim. Ecol. 77: 802–813.
Elith, J. et al. 2010. The art of modeling range-shifting species. – Methods Ecol. Evol. 1: 330–342.
Facon, B. and David, P. 2006. Metapopulation dynamics and biological invasions: a spatially explicit model applied to a freshwater snail. – Am. Nat. 128: 769–783.
Freeman, E. A. and Moisen, G. G. 2008. A comparison of the performance of threshold criteria for binary classification in terms of predicted prevalence and kappa. – Ecol. Model. 217: 48–58.
Gallien, L. et al. 2010. Predicting potential distributions of invasive species: where to go from here? – Divers. Distrib. 16: 331–342.
Graham, M. H. 2003. Confronting multicollinearity in ecological multiple regression. – Ecology 84: 2809–2815.
Vandereycken, A. et al. 2013. Occurrence of Harmonia axyridis (Coleoptera: Coccinellidae) in field crops. – Eur. J. Entomol. 110: 285–292.
Veitch, C. R. and Clout, M. N. 2002. Turning the tide: the erad-ication of invasive species. – Proceedings of the International Conference on Eradication of Island Invasives, IUCN. Veran, S. et al. 2015. Data from: Modeling spatial expansion of
invasive alien species: relative contributions of environmental and anthropogenic factors to the spreading of the harlequin ladybird in France. – Dryad Digital Repository, < http://dx.doi. org/10.5061/dryad.jg613 >.
Vilà, M. et al. 2011. Ecological impacts of invasive alien plants: a meta-analysis of their effects on species, communities and eco-systems. – Ecol. Lett. 14: 702–708.
Weber, E. 2001. Current and potential ranges of three exotic goldenrods (Solidago) in Europe. – Conserv. Biol. 15: 122–128.
Wikle, C. K. 2003. Hierarchical Bayesian models for predicting the spread of ecological processes. – Ecology 84: 1382–1394. Williams, B. K. 2011. Adaptive management of natural resources
– framework and issues. – J. Environ. Manage. 92: 1346–1353. Williamson, M. 1996. Biological invasions. – Chapman and
Hall.
Yackulic, C. B. et al. 2012. Neighborhood and habitat effects on vital rates: expansion of the barred owl in the Oregon Coast Ranges. – Ecology 93: 1953–1966.
Yackulic, C. B. et al. 2013. Presence-only modeling using MAXENT: when can we trust the inferences? – Methods Ecol. Evol. 4: 236–243.
Pulliam, H. R. 2000. On the relationship between niche and distribution. – Ecol. Lett. 3: 349–361.
Purse, B. V. et al. 2014. Landscape and climate determine patterns of spread for all colour morphs of the alien ladybird Harmonia axyridis. – J. Biogeogr. 42: 575–588.
Pyšek, P. and Richardson, D. M. 2010. Invasive species, environ-mental change and management, and health. – Annu. Rev. Environ. Resour. 35: 25–55.
Roy, H. E. and Wajnberg, E. 2008. From biological control to invasion the ladybird Harmonia axyridis as a model species. – Springer.
Roy, H. E. et al. 2012. Invasive alien predator causes rapid declines of native European ladybirds: alien predator causes declines of native ladybirds. – Divers. Distrib. 18: 717–725.
Sakai, A. K. et al. 2001. The population biology of invasive species. – Annu. Rev. Ecol. Syst. 32: 305–332.
Seko, T. et al. 2008. Residence period of a flightless strain of the ladybird beetle Harmonia axyridis Pallas (Coleoptera: Coccinel-lidae) in open fields. – Biol. Control 47: 194–198.
Simberloff, D. et al. 2013. Impacts of biological invasions: what’s what and the way forward. – Trends Ecol. Evol. 28: 58–66. Strubbe, D. and Matthysen, E. 2009. Predicting the potential
distribution of invasive ring-necked parakeets Psittacula krameri in northern Belgium using an ecological niche modeling approach – Biol. Invasions 11: 497–513.
Ternois, V. et al. 2012. Observatoire permanent pour le suivi de la Coccinelle asiatique Harmonia axyridis (Pallas, 1773) en France. – < http://pagesperso-orange.fr/vinc.ternois/cote_ nature/Harmonia_axyridis/ >.
Supplementary material (Appendix ECOG-01389 at www.ecography.org/readers/appendix ). Appendix 1.
Ecography
ECOG-01389
Veran, S., Piry, S., Ternois, V., Meynard, C. N., Facon,
B. and Estoup, A. 2015. Modeling spatial expansion
of invasive alien species: relative contributions of
environmental and anthropogenic factors to the
spreading of the harlequin ladybird in France. –
Ecography doi: 10.1111/ecog.01389
1
2
Figure A1: Method for delimitation of cells included in the spatial expansion analysis of
Harmonia axyridis: example of modelling transition from 2004 to 2005.
Note: Dark grey circles are observation data of H. axyridis in 2004; white circles are new
observation data of H. axyridis in 2005. The cells in light grey around a circle buffer of 50 km
from observations in 2005 are considered as having the potential to be invaded between 2004
and 2005 and are thus included in the model. The cells outside this buffer zone are coded as
non-surveyed to account for the fact that they cannot be invaded. The same process is
repeated for each transition step (i.e. going from year n to n+1).
3