DIAGNOSTIC NEURORADIOLOGY
Adaptive statistical iterative reconstruction reduces patient
radiation dose in neuroradiology CT studies
Peter Komlosi&Yanrong Zhang&Carlos Leiva-Salinas&
David Ornan&James T. Patrie&Wenjun Xin&
Deborah Grady&Max Wintermark
Received: 10 July 2013 / Accepted: 6 December 2013 / Published online: 3 January 2014 # Springer-Verlag Berlin Heidelberg 2014
Abstract
Introduction Adaptive statistical iterative reconstruction (ASIR) can decrease image noise, thereby generating CT im-ages of comparable diagnostic quality with less radiation. The purpose of this study is to quantify the effect of systematic use of ASIR versus filtered back projection (FBP) for
neuroradiol-ogy CT protocols on patients’ radiation dose and image quality.
Methods We evaluated the effect of ASIR on six types of neuroradiologic CT studies: adult and pediatric unenhanced head CT, adult cervical spine CT, adult cervical and intracra-nial CT angiography, adult soft tissue neck CT with contrast, and adult lumbar spine CT. For each type of CT study, two groups of 100 consecutive studies were retrospectively reviewed: 100 studies performed with FBP and 100 studies performed with ASIR/FBP blending factor of 40 %/60 % with appropriate noise indices. The weighted volume CT dose
index (CTDIvol), dose–length product (DLP) and noise were
recorded. Each study was also reviewed for image quality by two reviewers. Continuous and categorical variables were compared by t test and free permutation test, respectively.
Results For adult unenhanced brain CT, CT cervical myelography, cervical and intracranial CT angiography and
lumbar spine CT both CTDIvoland DLP were lowered by up
to 10.9 % (p<0.001), 17.9 % (p=0.005), 20.9 % (p<0.001), and 21.7 % (p=0.001), respectively, by using ASIR compared with FBP alone. Image quality and noise were similar for both FBP and ASIR.
Conclusion We recommend routine use of iterative recon-struction for neuroradiology CT examinations because this approach affords a significant dose reduction while preserving image quality.
Keywords Computer tomography . Iterative reconstruction . Image quality . Radiation dose . Neuroradiology
Abbreviations
ASIR Adaptive statistical iterative reconstruction
CTDIvol Weighted volume CT dose index
DLP Dose–length product
FBP Filtered back projection
NI Noise index
Introduction
Dose reduction in CT imaging has become a top priority because of concerns over the risks related to ionizing radiation
[1,2]. CT manufacturers have developed various techniques,
including dose modulation, which have proven to be helpful
in reducing patient dose [3]. As compared to conventional
filtered back projection technique, iterative image reconstruc-tion methods promise to drastically reduce image noise and artifacts, thereby allowing significant dose reduction. Adap-tive statistical iteraAdap-tive reconstruction, or ASIR, is able to correct image data by modeling the photon statistics in X-ray attenuation. High levels of ASIR processing create a Electronic supplementary material The online version of this article
(doi:10.1007/s00234-013-1313-z) contains supplementary material, which is available to authorized users.
P. Komlosi
:
Y. Zhang:
C. Leiva-Salinas:
D. Ornan:
D. Grady:
M. Wintermark (*)Department of Radiology and Medical Imaging, Division of Neuroradiology, University of Virginia, PO Box 800170, Charlottesville, VA 22908-0170, USA
e-mail: max.wintermark@gmail.com J. T. Patrie
:
W. XinDepartment of Public Health Sciences, University of Virginia, Charlottesville, VA, USA
M. Wintermark
Department of Radiology, Centre Hospitalier Universitaire Vaudois, Lausanne, Switzerland
smooth image texture and noise characteristics unfamiliar to radiologists. In clinical practice, one can use variably blended images created with combined filtered back projection and ASIR techniques to produce different levels of ASIR. To date, the effect of implementing ASIR has been evaluated mostly
for individual CT imaging protocols [4–7], and few studies
evaluated the overall effect of its systematic use within a
radiology department or section [8]. Thus, our goal was to
retrospectively quantify the effect of systematic use of ASIR for neuroradiology CT protocols on patient dose and image quality.
Methods
Study design and imaging protocols
The Institutional Review Board approved this retrospective study, in compliance with the Health Insurance Portability and Accountability Act, with a waiver of consent. At our institu-tion, all our CT imaging protocols include dose modulation. During CT acquisition, a computer algorithm alters the tube current applied to each CT section on the basis of a preset noise index. The noise index (NI) is a parameter indicative of the level of image noise considered to be acceptable to the radiologist for a given CT examination. A lower noise index translates into lower noise and thus into an improved signal-to-noise ratio. However, a lower noise index requires higher tube current for a given pitch and tube rotation time and therefore delivers higher patient radiation dose.
ASIR was introduced in October 2011 on our 64-section CT scanner (Lightspeed VCT; General Eelectric Healthcare, Mil-waukee, WI, USA). With ASIR, CT exams set to higher NI can yield images of comparable diagnostic image quality to that of studies without ASIR. Establishment of acceptable values for the NI with ASIR in our institution was accomplished over a 3-month period (from October 2011 to December 2011) by subjective review and consensus amongst the faculty in our neuroradiology division. The initial NI selected was that typi-cally used for studies without ASIR. NI was increased by one unit compared to the value usually used for the corresponding protocol without ASIR. Image sets with all possible ASIR factors—10 %, 20 %, 30 %, 40 %, 50 %, 60 %,70 %, 100 % (ASIR/filtered back projection blending values of 10 %/90 %, 20 %/80 %, 30 %/70 %, 40 %/60 %, 50 %/50 %, 60 %/40 %, 70 %/30 %, 80 %/20 %, 90 %/10 %, 100 %/0 %). If at least one of these image datasets yielded an acceptable image quality comparable to that of images without ASIR, then the noise index was increased by one more unit, and the same process
p ro toco ls Unenhanced head CT in adult p atients Unenhanced head CT in pediatric p atients CT myelography of the cervical spine in adult pati ents Ce rvic al an d intra cr ani al C T angiography in adult p atients Soft ti ssue n ec k C T in adult p atients CT of the lumbar spine in adult p atients No AS IR AS IR N o A S IR ASI R No ASI R A S IR No AS IR ASI R No A S IR A S IR No ASI R A S IR a 64 × 0 .625 64 × 0 .625 64 × 0 .625 64 × 0 .625 6 4 × 0 .625 64 × 0 .625 64 × 0 .625 64 × 0 .625 64 × 0 .625 64 × 0 .625 6 4 × 0 .625 64 × 0 .625 (mm) 2.5 2 .5 2.5 2 .5 1 .25 1.25 0.625 0.625 2.5 2 .5 2 .5 2 .5 interval (mm) 2.5 2 .5 2.5 2 .5 0 .625 0.625 0.375 0.375 2 2 2 2 0 .984:1 0 .984 :1 0.984:1 0 .984:1 1 .375:1 1 .375:1 0 .984:1 0 .984: 1 1 .375 :1 1.375:1 1 .375:1 1 .375:1 (s) 1 1 1 1 0 .8 0. 8 0 .5 0. 5 0 .8 0. 8 0 .8 0. 8 (k Vp) 120 120 80 80 1 2 0 120 120 120 120 120 1 4 0 140 4 5 100 100 1 2 17 4 5 9 1 6 1 2 1 7 current (mA) 100 100 30 30 1 0 0 100 200 200 100 100 1 5 0 150 curren t (mA) 350 350 300 300 2 0 0 200 350 350 200 200 2 5 0 250 – 40 % – 40 % – 40 % – 40 % – 40 % – 40 % ions × se cti on th ick n ess in m illi me ter s
“ASIR protocol” noise index. The ASIR factor that yielded the best image quality was also recorded and implemented as part
of the“ASIR protocol”.
We retrospectively evaluated our six most frequent types of neuroradiologic CT studies: unenhanced head CT in adult and pediatric patients, cervical spine CT myelography in adult patients, CT angiography of the cervical and intracranial vessels in adult patients, neck soft tissue CT in adult patients, and
lumbar spine CT studies in adult patients (Table1). For each
type of CT study, we included two groups of 100 consecutive patients each: The first group underwent CT with a 64-section CT scanner with x–y–z dose modulation before the introduction of ASIR (using filtered back projection only), and the second group with the same setup after introduction of ASIR and calibration of the CT protocols using the process described above (also with x–y–z dose modulation). Patient demographic data were recorded. The CT studies performed during the two periods of NI adjustment—October 2011 through December 2011 (3 months of practice before enrollment of patients in the
second group)—were not included in the present study. The
in-plane resolution (field of view and matrix) for each type of CT study was kept the same for the two groups of patients. Radiation dose
Radiation dose to the patient was calculated for each study by means of the two standard dose indicators—volume CT dose
index (CTDIvol) and dose–length product (DLP)—that were
calculated by the CT scanner for each CT study and automat-ically saved to a dose report onto our picture archiving and
communication system. The CTDIvolparameter is
representa-tive of the average dose delivered within the reconstructed
section. The CTDIvolrepresents the weighted CT dose index
divided by the pitch and describes the average dose through-out a 160-mm-diameter circular Plexiglas phantom, incorpo-rating the central dose weighted by a 1/3 factor and the peripheral dose weighted by a 2/3 factor. The DLP can be related to energy imparted to organs and can thus be used to assess the overall radiation burden of a given examination. It
is equal to the product of the CTDIvoland the length of the
scan in centimeters [9].
Image analysis
For each patient group and study type, quantitative image noise and subjective image quality were evaluated. Quantita-tive noise was determined by using a previously reported
method [3,10]: the standard deviation of the CT attenuation
in a 100-200-mm2 region of interest that was drawn in the
background defined as the air surrounding the patient, as far as possible from the patient. For the lumbar spine studies, air was not included in the majority of the images; therefore, noise was recorded in fat in the posterior pararenal space, avoiding vascular structures.
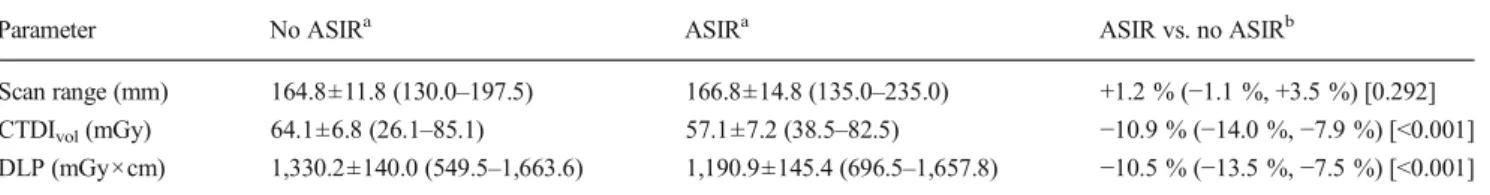
Table 2 Radiation dose for unenhanced head CT in adult patients
Parameter No ASIRa ASIRa ASIR vs. no ASIRb
Scan range (mm) 164.8±11.8 (130.0–197.5) 166.8±14.8 (135.0–235.0) +1.2 % (−1.1 %, +3.5 %) [0.292] CTDIvol(mGy) 64.1±6.8 (26.1–85.1) 57.1±7.2 (38.5–82.5) −10.9 % (−14.0 %, −7.9 %) [<0.001]
DLP (mGy×cm) 1,330.2±140.0 (549.5–1,663.6) 1,190.9±145.4 (696.5–1,657.8) −10.5 % (−13.5 %, −7.5 %) [<0.001]
aData are means ± standard deviations, with ranges in parentheses b
Data are relative differences expressed as percentages, with 95 % confidence intervals (also expressed as percentages) in parentheses and p values in square brackets as assessed with unpaired t-test. Relative difference for comparing ASIR vs. no ASIR protocols was calculated as the absolute value for the ASIR protocol minus the absolute value for the no ASIR protocol, with this difference then divided by the absolute value for the no ASIR protocol. Absolute values are shown in the first two columns of the table
Table 3 Radiation dose for unenhanced head CT in pediatric patients
Parameter No ASIRa ASIRa ASIR vs. no ASIRb
Scan range (mm) 146.0±18.8 (94.5–242.5) 150.5±23.1 (97.5–290.0) +3.1 % (−1.0 %, +7.1 %) [0.135] CTDIvol(mGy) 42.2±18.3 (3.5–71.5) 40.9±11.6 (14.0–57.9) −3.2 % (−13.3 %, +6.9 %) [0.528]
DLP (mGy×cm) 816.4±389.6 (62.8–1904.5) 807.5±267.4 (201.1–1287.2) −1.1 % (−12.5 %, +10.3 %) [0.851]
a
Data are means ± standard deviations, with ranges in parentheses
b
Data are relative differences expressed as percentages, with 95 % confidence intervals (also expressed as percentages) in parentheses and p values in square brackets as assessed with unpaired t test. Relative difference for comparing ASIR vs. no ASIR protocols was calculated as the absolute value for the ASIR protocol minus the absolute value for the no ASIR protocol, with this difference then divided by the absolute value for the no ASIR protocol. Absolute values are shown in the first two columns of the table
Two neuroradiologists (D.O. and C.L.S.) reviewed all the CT studies for image quality in a random order. The reviewers were blinded as to whether or not ASIR had been utilized. The studies were graded by using a five-point Likert scale on a variety of criteria (a score of 1 indicated that the study was unacceptable; a score of 3, that the study was average but diagnostic; and a score of 5, that the study was excellent). Grading addressed the ability to define low-contrast (such as gray/white matter and basal ganglia differentiation and thyroid texture) and high-contrast structures (such as cortical bone definition) and the sharpness of tissue interfaces. This grading system is similar to those utilized in previous studies
(TablesE1–E5, Supplemental Material) [3].
Statistical analyses
For each type of CT study, differences between the two groups of patients in terms of demographic data, radiation dose de-scriptors, image quality, and noise were evaluated for statisti-cal significance (stat 9.2; StataCorp, College Station, Texas 77845 USA). Unpaired t tests were used to compare continu-ous variables between groups; the statistical significance level was set at 0.05. The Likert image analysis scores for the different image quality assessments were analyzed separately by way of paired distribution free permutation tests and by way of two-sample distribution free permutation tests. The paired permutation tests were utilized to conduct inter-reader
comparisons, while the two-sample permutation tests were utilized to conduct intra-reader image comparisons of image studies without versus with ASIR. With regard to hypothesis testing, a two-sided Bonferroni p≤0.05 decision rule was utilized as the null hypothesis rejection criterion so that simul-taneous statements of statistical inference could be made across reader and across imaging method.
Results Study patients
There were no significant demographic differences between the two groups of patients imaged with and without ASIR
(TableE6, Supplemental Material). This was true for the six
types of CT studies that were assessed. Imaging studies
For all six types of CT studies, application of ASIR allowed the noise index to increase by one unit or more. For all six types of CT studies, the final ASIR factor that was preferred
by the neuroradiology faculty and was selected for the“ASIR
protocol” was 40 %, which means a blending of 40 % of ASIR and 60 % of filtered back projection. ASIR factors higher than 40 % yielded images that were deemed too glazy by the Table 4 Radiation dose for CT myelography of the cervical spine in adult patients
Parameter No ASIRa ASIRa ASIR vs. no ASIRb
Scan range (mm) 169.4±36.9 (116.3–484.0) 186.0±19.8 (153.8–210.6) +9.8 % (−5.7 %, +25.3 %) [0.212] CTDIvol(mGy) 11.8±4.3 (6.0–29.2) 9.7±4.0 (5.3–33.2) −17.9 % (−27.7 %, −8.0 %) [<0.001]
DLP (mGy×cm) 270.8±100.1 (137.0–673.5) 231.1±99.2 (117.8–826.8) −14.7 % (−24.9 %, −4.4 %) [0.005]
aData are means ± standard deviations, with ranges in parentheses b
Data are relative differences expressed as percentages, with 95 % confidence intervals (also expressed as percentages) in parentheses and p values in square brackets as assessed with unpaired t test. Relative difference for comparing ASIR vs. no ASIR protocols was calculated as the absolute value for the ASIR protocol minus the absolute value for the no ASIR protocol, with this difference then divided by the absolute value for the no ASIR protocol. Absolute values are shown in the first two columns of the table
Table 5 Radiation dose for cervical and intracranial CT angiography in adult patients
Parameter No ASIRa ASIRa ASIR vs. no ASIRb
Scan range (mm) 356.2±45.5 (160.0–435.8) 360.8±38.9 (107.3–445.5) +1.3 % (−2.0 %, +4.6 %) [0.441] CTDIvol(mGy) 14.9±11.2 (10.0–67.7) 10.7±2.7 (9.3–28.8) −28.0 % (−43.2 %, −12.7 %) [<0.001]
DLP (mGy×cm) 574.2±299.4 (60.7–2,539.1) 454.3±105.4 (343.6–1,140.2) −20.9 % (−31.8 %, −10.0 %) [<0.001]
neuroradiology faculty and perception of anatomical and path-ological structures were inferior compared to that of images obtained without ASIR.
Radiation dose
Radiation doses for the different imaging protocols are reported
in Tables 2,3,4, 5, 6, and 7. When ASIR was used, both
CTDIvoland DLP were lowered by up to 10.9 % (p<0.001),
17.9 % (p=0.005), 20.9 % (p<0.001), and 21.7 % (p=0.001) for
unenhanced head CT in adults (Table2), CT myelography of the
cervical spine in adult patients (Table4), cervical and
intracra-nial CT angiography in adult patients (Table5), and CT of the
lumbar spine in adult patients (Table7), respectively, which was
statistically significant. Regarding pediatric unenhanced head
CT (Table3) and soft tissue neck CT in adult patients (Table6),
CTDIvoland DLP were lowered by up to 3.2 % (p=0.851) and
10.5 % (p=0.268), respectively, when ASIR was used, but the difference failed to reach statistical significance.
Image quality and noise
Image noise was significantly lower with ASIR than image noise without ASIR for unenhanced head CT in adult and pediatric patients. The image noise was not affected by the use
of ASIR in the remainder of the studies (TablesE7). Image
quality between studies performed with and without ASIR
was overall similar, as assessed by the two reviewers
(TablesE8–E13and Fig.1). According to one reviewer, the
cortical bone definition (high-contrast feature) was decreased with ASIR for unenhanced head CT in adult and pediatric
patients (Table E8-9) and CT myelography of the cervical
spine in adult patients (TableE10), however, none of these
were noted across both reviewers. Irrespective of the imaging method, the mean of the distribution of the Likert image quality scores differed from reader to reader in the majority of studies with Reader #1 having a tendency to rate image
quality lower than Reader #2 (TablesE8–E13).
Discussion
At our institution, application of ASIR for all six types of neuroradiology CT studies allowed us to maintain image qual-ity and increase noise index by at least one unit which translated into significant dose savings in four of the six types of neuro-radiology CT studies, including unenhanced adult head CT, adult cervical and lumbar CT myelography, and adult cervical and intracranial CT angiography. The application of ASIR was achieved by rendering an ASIR factor of 40 % (a blend of 40 % ASIR and 60 % filtered back projection); the optimal value for our neuroradiology CT studies by consensus judgment. Higher ASIR factors may provide further radiation dose savings by allowing higher noise index, however, lend the images a Table 6 Radiation dose for soft tissue neck CT in adult patients
Parameter No ASIRa ASIRa ASIR vs. no ASIRb
Scan range (mm) 243.4±33.0 (108.0–306.0) 255.3±48.3 (122.5–404.0) +4.9 % (−0.2 %, +10.0 %) [0.062] CTDIvol(mGy) 11.5±5.4 (5.9–35.1) 10.3±6.2 (5.5–39.1) −10.5 % (−26.0 %, +5.0 %) [0.184]
DLP (mGy×cm) 342.8±140.2 (136.6–981.3) 316.6±160.4 (136.9–911.1) −7.6 % (−21.2 %, +5.9 %) [0.268]
aData are means ± standard deviations, with ranges in parentheses b
Data are relative differences expressed as percentages, with 95 % confidence intervals (also expressed as percentages) in parentheses and p values in square brackets as assessed with unpaired t test. Relative difference for comparing ASIR vs. no ASIR protocols was calculated as the absolute value for the ASIR protocol minus the absolute value for the no ASIR protocol, with this difference then divided by the absolute value for the no ASIR protocol. Absolute values are shown in the first two columns of the table
Table 7 Radiation dose for CT of the lumbar spine in adult patients
Parameter No ASIRa ASIRa ASIR vs. no ASIRb
Scan range (mm) 269.0±82.3 (31.5–640.0) 278.8±64.3 (200.0–596.0) +3.6 % (−4.0 %, +11.3 %) [0.353] CTDIvol(mGy) 22.6±8.2 (8.2–47.4) 18.0±6.3 (10.0–40.9) −20.4 % (−29.4 %, −11.4 %) [<0.001]
DLP (mGy×cm) 779.3±395.0 (366.5–2,462.0) 609.9±316.5 (−452.8–2332.1) −21.7 % (−34.6 %, −8.9 %) [0.001]
a
Data are means ± standard deviations, with ranges in parentheses
b
Data are relative differences expressed as percentages, with 95 % confidence intervals (also expressed as percentages) in parentheses and p values in square brackets as assessed with unpaired t test. Relative difference for comparing ASIR vs. no ASIR protocols was calculated as the absolute value for the ASIR protocol minus the absolute value for the no ASIR protocol, with this difference then divided by the absolute value for the no ASIR protocol. Absolute values are shown in the first two columns of the table
shinier, more glazed appearance. The“amount” of ASIR ap-plied is a matter of personal choice and each institution has to find the optimal ASIR factor for their daily interpretation of neuroradiology CT studies. Our study supports the routine use of ASIR for neuroradiology CT examinations.
The degree of radiation dose reduction varied significantly amongst study types: one end of the spectrum was 28 % dose reduction for adult intracranial and cervical CT angiography with no significant dose reduction for pediatric head CTs at the other end of the spectrum. The reason for this difference between study types may be related to the fact that lower tube current was already used in pediatric studies before imple-mentation of ASIR, resulting into a smaller margin of
poten-and noise index, improved image quality may have been preferred over a more aggressive dose reduction.
We used multiple criteria, including assessment of low and high-contrast anatomical and pathological structures/features for each type of neuroradiology study to assess diagnostic utility and found that the image quality was overall equivalent between studies performed with and without ASIR. In two types of studies, however, the high-contrast imaging criteria evaluated, namely the cortical bone definition, was less with ASIR compared to FBP alone. Differences between absolute quality score values with ASIR and without ASIR did not appear clinically relevant, but were statistically significant because of the large sample size. Nevertheless, the potential Fig. 1 Representative adult
unenhanced head CT (a and b), cervical CT angiography (c and d), and lumbar spine CT sagittal reformatted images (e and f) obtained from the same patients without (a, c, e) and with use of ASIR (b, d, f). Arrowhead on panel c denotes traumatic
pseudoaneurysm that has partially resolved on the subsequent study (d)
compromising our ability to blind the reviewers. Furthermore, because our study was performed with CT scanners from one manufacturer only, our results need to be confirmed in studies that evaluate CT scanners from other vendors. Also, we did not investigate the effect of iterative reconstruction on all our CT protocols, but rather limited our evaluation to the types of CT studies most frequently performed in our division. Although the ideal study design to assess the effect of ASIR on imaging parameters would be to perform regular imaging on the same subjects while varying the noise index and ASIR factor, this approach cannot be utilized secondary to ethical concerns.
In conclusion, we recommend routine use of iterative re-construction for neuroradiology CT examinations, because this approach affords a significant dose reduction while pre-serving image quality. Implementation of iterative reconstruc-tion requires a fine-tuning process to identify optimal blend between iterative reconstruction and filtered back projection for each type of CT study performed.
Conclusions
Routine use of iterative reconstruction is recommended for neuroradiology CT examinations, because this approach affords a significant dose reduction while preserving image quality. Acknowledgments This project was supported by a research grant from GE Healthcare.
Conflict of interest We declare that we have no conflict of interest.
References
1. Pearce MS, Salotti JA, Little MP, McHugh K, Lee C, Kim KP et al (2012) Radiation exposure from ct scans in childhood and subse-quent risk of leukaemia and brain tumours: a retrospective cohort study. Lancet 380:499–505
2. Brenner DJ, Hall EJ (2007) Computed tomography–an increasing source of radiation exposure. N Engl J Med 357:2277–2284 3. Smith AB, Dillon WP, Lau BC, Gould R, Verdun FR, Lopez EB et al
(2008) Radiation dose reduction strategy for ct protocols: successful implementation in neuroradiology section. Radiology 247:499–506 4. Kulkarni NM, Uppot RN, Eisner BH, Sahani DV (2012) Radiation
dose reduction at multidetector ct with adaptive statistical iterative reconstruction for evaluation of urolithiasis: how low can we go? Radiology 265:158–166
5. Vorona GA, Zuccoli G, Sutcavage T, Clayton BL, Ceschin RC, Panigrahy A (2013) The use of adaptive statistical iterative recon-struction in pediatric head ct: a feasibility study. Am J Neuroradiol 34:205–211
6. Maxfield MW, Schuster KM, McGillicuddy EA, Young CJ, Ghita M, Bokhari SA et al (2012) Impact of adaptive statistical iterative recon-struction on radiation dose in evaluation of trauma patients. J Trauma Acute Care Surg 73:1406–1411
7. Kilic K, Erbas G, Guryildirim M, Arac M, Ilgit E, Coskun B (2011) Lowering the dose in head ct using adaptive statistical iterative reconstruction. AJNR Am J Neuroradiol 32:1578–1582
8. Rapalino O, Kamalian S, Kamalian S, Payabvash S, Souza LC, Zhang D et al (2012) Cranial ct with adaptive statistical iterative reconstruction: improved image quality with concomitant radiation dose reduction. AJNR Am J Neuroradiol 33:609–615
9. Hamberg LM, Rhea JT, Hunter GJ, Thrall JH (2003) Multi-detector row ct: radiation dose characteristics. Radiology 226:762–772 10. Wintermark M, Maeder P, Verdun FR, Thiran JP, Valley JF,
Schnyder P et al (2000) Using 80 kvp versus 120 kvp in perfusion ct measurement of regional cerebral blood flow. Am J Neuroradiol 21: 1881–1884