Capturing specific abilities as a window into human
individuality: The example of face recognition
The MIT Faculty has made this article openly available.
Please share
how this access benefits you. Your story matters.
Citation
Wilmer, Jeremy B., Laura Germine, Christopher F. Chabris, Garga
Chatterjee, Margaret Gerbasi, and Ken Nakayama. “Capturing
specific abilities as a window into human individuality: The
example of face recognition.” Cognitive Neuropsychology 29, no. 5 6
(September 2012): 360-392. © 2012 Psychology Press, an imprint of
the Taylor & Francis Group, an Informa business
As Published
http://dx.doi.org/10.1080/02643294.2012.753433
Publisher
Taylor & Francis
Version
Final published version
Citable link
http://hdl.handle.net/1721.1/82668
Terms of Use
Article is made available in accordance with the publisher's
policy and may be subject to US copyright law. Please refer to the
publisher's site for terms of use.
Capturing specific abilities as a window into human
individuality: The example of face recognition
Jeremy B. Wilmer1, Laura Germine2, Christopher F. Chabris3, Garga Chatterjee4, Margaret Gerbasi2, and Ken Nakayama21Department of Psychology, Wellesley College, Wellesley, MA, USA 2
Department of Psychology, Harvard University, Cambridge, MA, USA 3Department of Psychology, Union College, Schenectady, NY, USA
4Department of Brain and Cognitive Sciences, Massachusetts Institute of Technology, Cambridge, MA, USA
Proper characterization of each individual’s unique pattern of strengths and weaknesses requires good measures of diverse abilities. Here, we advocate combining our growing understanding of neural and cognitive mechanisms with modern psychometric methods in a renewed effort to capture human indi-viduality through a consideration of specific abilities. We articulate five criteria for the isolation and measurement of specific abilities, then apply these criteria to face recognition. We cleanly dissociate face recognition from more general visual and verbal recognition. This dissociation stretches across ability as well as disability, suggesting that specific developmental face recognition deficits are a special case of a broader specificity that spans the entire spectrum of human face recognition perform-ance. Item-by-item results from 1,471 web-tested participants, included as supplementary information, fuel item analyses, validation, norming, and item response theory (IRT) analyses of our three tests: (a) the widely used Cambridge Face Memory Test (CFMT); (b) an Abstract Art Memory Test (AAMT), and (c) a Verbal Paired-Associates Memory Test (VPMT). The availability of this data set provides a solid foundation for interpreting future scores on these tests. We argue that the allied fields of exper-imental psychology, cognitive neuroscience, and vision science could fuel the discovery of additional specific abilities to add to face recognition, thereby providing new perspectives on human individuality. Keywords: Test development; Face recognition; Face perception; Web testing; Specific ability; General ability; IQ; Visual memory; Developmental prosopagnosia.
Correspondence should be sent to Jeremy B. Wilmer, 106 Central Street, Wellesley, MA 02481, USA (E-mail: [email protected])
Thanks to Brad Duchaine, Holum Kwok, and three reviewers for their valuable input. Author contributions: J.B.W. designed the study, analysed the data, and wrote the paper; L.G. created the Famous Faces Memory Test (FFMT), produced online versions of Cambridge Face Memory Test (CFMT), Abstract Art Memory Test (AAMT), and Verbal Paired-associates Memory Test (VPMT), ran the discriminant validity study and the CFMT convergent validity study online, and provided feedback on the manu-script; C.F.C. and M.G. created the VPMT and Code Learning Memory Test (CLMT), conducted the VPMT convergent validity study, and wrote the VPMT portion of Section 1; G.C. created the AAMT and Object and Scene Memory Test (OSMT), conducted the AAMT convergent validity study, and drafted the AAMT portion of Section 1; K.N. provided input on writing and presentation of analyses.
This article was originally published with errors. This version has been corrected. Please see erratum (http://dx.doi.org/10.1080/ 02643294.2013.780378).
360
#2012 Psychology Press, an imprint of the Taylor & Francis Group, an Informa business“ The things that make me different are the things that make me.” [attributed to A. A. Milne]
In human cognition, measures of how one indi-vidual differs from another frequently fall into two broad categories: general aptitude testing and specific clinical testing. General aptitude tests such as IQ tests and the SAT effectively capture the full range of performance, from exceptionally good to clinically poor, yet they tend to be aimed at only a few, general abilities. In contrast, clinical tests are available for a diverse array of specific disabilities. However, since clinical tests are aimed at identifying clinically poor performance, they tend to be relatively insensitive to variation in the nonimpaired range. Could it be that our concerted efforts to capture general abilities and specific disabilities have missed an opportunity to capture the full range of perform-ance in numerous specific abilities that define key aspects of our individuality? In this paper, we take face recognition ability as an example of a specific ability that can contribute to our understanding of what makes each individual unique.
We view the specificity of face recognition ability as a potentially paradigmatic example of how our increased understanding of neural and cognitive mechanisms can guide a renewed search for specific abilities. Face recognition is one of the clearest examples of a neurally and cognitively dissociable trait. Several brain areas respond more strongly to faces than to other stimuli (Kanwisher, McDermott, & Chun, 1997; Tsao, Freiwald, Tootell, & Livingstone, 2006; Tsao, Moeller, & Freiwald, 2008), several behavioural phenomena are larger for faces than for other stimuli (McKone, Kanwisher, & Duchaine, 2007), and studies of patients and transcranial magnetic stimulation have shown both selective impairments in, and selective sparing of, face processing (Duchaine, Yovel, Butterworth, & Nakayama, 2006; Germine, Cashdollar, Du¨zel, & Duchaine, 2011; Moscovitch, Winocur, & Behrmann, 1997; Pitcher, Charles, Devlin, Walsh, & Duchaine, 2009). Such dissociations identify face recognition as a promising candidate for possible specificity.
We demonstrate here that face recognition fractionates from other domains not only in exper-imental and patient-based studies, but also in its
natural variation across individuals. Indeed, face recognition appears to be largely independent of, or specific from, more general abilities (see Table 1, which presents key criteria, terms, and heuristics related to capturing specific abilities). This speci-ficity implies a relative commonness of both selec-tive deficits and selecselec-tive talents in the domain of face recognition.
The discovery of new specific abilities could provide an opportunity to reexamine a classic ques-tion in human ability research: To what extent do human abilities cluster into fewer general abilities versus multiple specific abilities? In the past, a tension has existed between the intuitive appeal and popularity of theories that emphasize a larger number of more diverse abilities (Gardner, 1983; Goleman, 1998; Guilford, 1967; Sternberg, 1984; Thorndike, 1920) and the clearer and more rigorous empirical support for theories that emphasize a smaller number of more overlapping abilities (Chabris, 2007; Jensen & Weng, 1994; Neisser et al., 1996; Spearman, 1904; cf. Brackett & Mayer, 2003; Mayer, Caruso, & Salovey, 1999). A rigorous characteriz-ation of new specific abilities could conceivably show that popular intuitions about the multiplicity of our cognitive strengths and weaknesses are not as far from reality as prior work has suggested.
A notable false start in the process of identifying face recognition as a specific ability was the release of the third edition of the Wechsler Memory Scale (WMS – III) in 1997 (Wechsler, 1997). A test of face recognition was added to WMS– III in an effort to capture nonverbal visual memory (Holdnack & Dellis, 2004). Yet this face recog-nition test was criticized as having an inadequate correlation with the nonface visual memory portion of WMS (r ¼ .28 to .30; Holdnack & Dellis, 2004; Millis, Malina, Bowers, & Ricker, 1999; Wechsler, 1997) and was subsequently dropped from the next version of WMS, WMS – IV (Wechsler, 2009). Unknowingly, this research anticipates our own result, reported below, of a similarly low correlation between our face recog-nition test (Cambridge Face Memory Test, CFMT) and our nonface visual memory test (Abstract Art Memory Test, AAMT; r ¼ .26).
While such a finding is a critically important piece of our current aim to identify specific abilities and more fully appreciate what makes each individual unique, it was a disappointment in the context of Wechsler’s aim to develop a more general measure of visual memory. It is interesting to con-sider how many more such findings, suggestive of specific abilities, may be buried in the file drawers of efforts to produce standardized general aptitude tests.
Despite the heavy attention to faces in past experimental studies of mind and brain, we still know relatively little about individual differences in face processing. This imbalance illustrates a classic and persisting hurdle in psychology: the
difficulty of translating insights gleaned from experiments into an understanding of naturally occurring differences (Cronbach, 1957; Tracy, Robins, & Sherman, 2009). We believe that pre-dominantly experimental fields, such as cognitive neuroscience, vision science, and experimental psychology, have much to offer the study of human variation. Yet the challenges of this trans-lational work must not be taken lightly. In particu-lar, increased attention to developing excellent measures of human variation in experimentally defined mechanisms will be necessary to actualize this translational potential.
Here, we provide a foundational analysis of the full range of variation in face identity recognition
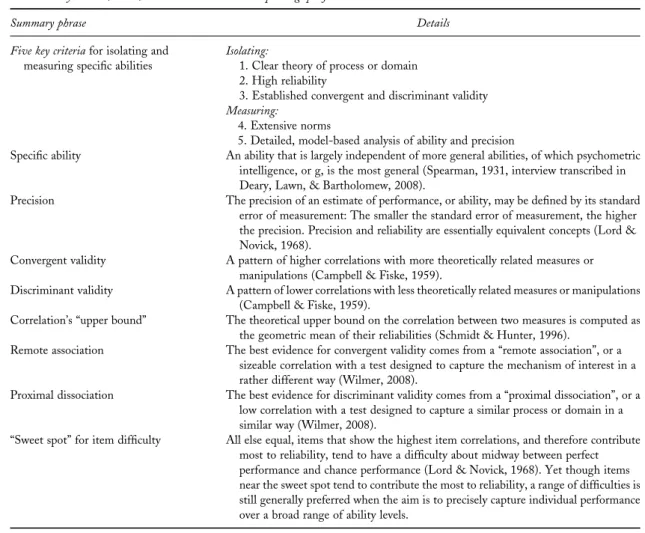
Table 1. Key criteria, terms, and heuristics related to capturing specific abilities
Summary phrase Details
Five key criteria for isolating and measuring specific abilities
Isolating:
1. Clear theory of process or domain 2. High reliability
3. Established convergent and discriminant validity Measuring:
4. Extensive norms
5. Detailed, model-based analysis of ability and precision
Specific ability An ability that is largely independent of more general abilities, of which psychometric intelligence, or g, is the most general (Spearman, 1931, interview transcribed in Deary, Lawn, & Bartholomew, 2008).
Precision The precision of an estimate of performance, or ability, may be defined by its standard error of measurement: The smaller the standard error of measurement, the higher the precision. Precision and reliability are essentially equivalent concepts (Lord & Novick, 1968).
Convergent validity A pattern of higher correlations with more theoretically related measures or manipulations (Campbell & Fiske, 1959).
Discriminant validity A pattern of lower correlations with less theoretically related measures or manipulations (Campbell & Fiske, 1959).
Correlation’s “upper bound” The theoretical upper bound on the correlation between two measures is computed as the geometric mean of their reliabilities (Schmidt & Hunter, 1996).
Remote association The best evidence for convergent validity comes from a “remote association”, or a sizeable correlation with a test designed to capture the mechanism of interest in a rather different way (Wilmer, 2008).
Proximal dissociation The best evidence for discriminant validity comes from a “proximal dissociation”, or a low correlation with a test designed to capture a similar process or domain in a similar way (Wilmer, 2008).
“Sweet spot” for item difficulty All else equal, items that show the highest item correlations, and therefore contribute most to reliability, tend to have a difficulty about midway between perfect performance and chance performance (Lord & Novick, 1968). Yet though items near the sweet spot tend to contribute the most to reliability, a range of difficulties is still generally preferred when the aim is to precisely capture individual performance over a broad range of ability levels.
ability. This paper centres around five key test development criteria that we propose as a core methodology for isolating and measuring specific abilities. These criteria are detailed in the next section. In subsequent sections, we apply each cri-terion to face recognition ability in a manner that aims to be accessible and broadly applicable to further investigations of specific abilities.
By applying the first three of our five criteria, we isolate face recognition as a specific ability, building off of the WMS findings recounted above and other more recent reports suggesting specificity (Dennett et al., 2012; Hildebrandt, Wilhelm, Schmiedek, Herzmann, & Sommer, 2011; McGugin, Richler, Herzmann, Speegle, & Gauthier, 2012; Wilhelm et al., 2010; Wilmer et al., 2010). By applying the final two criteria, we enhance the measurement of face recognition ability, first by establishing tra-ditional age- and sex-referenced norms, then by generating model-based estimates of ability and precision for each individual. Notably, by consider-ing these precision estimates en masse over our 14 hundred participants, we are able to characterize the precision of our measures over the full range of ability levels, from clinically poor to exceptionally good. Finally, by providing our entire normative data set as supplementary information, we enable future researchers to generate the same norm-referenced and model-based estimates for their participants.
We measure face recognition ability here with the Cambridge Face Memory Test (CFMT, Duchaine & Nakayama, 2006), which has been used, to date, in over 50 published studies. CFMT’s clear instructions and computer-based format make it quick, uncomplicated, and suitable for web administration, where it has produced results indistinguishable from lab testing (Germine et al., 2012; Wilmer et al., 2010). CFMT’s effective removal of nonface cues is sup-ported by both its robust inversion effect and its effective identification of prosopagnosic individ-uals—those with severe everyday face recognition deficits (Bowles et al., 2009; Duchaine & Nakayama, 2006). While CFMT was initially developed as a diagnostic test for developmental prosopagnosia (Duchaine & Nakayama, 2006), a
domain in which it has become the de facto standard instrument (Bowles et al., 2009), CFMT has increasingly been used in studies that investigate the full range of human variation. Evidence has accumulated for CFMT’s reliability (Bowles et al., 2009; Herzmann, Danthiir, Schacht, Sommer, & Wilhelm, 2008; Wilmer et al., 2010) and validity (Bowles et al., 2009; Dennett et al., 2012; Russell, Duchaine, & Nakayama, 2009; Wilmer et al., 2010) for capturing individual differences and also for the heritability of CFMT-measured individual differences in face recognition (Wilmer et al., 2010). Several additional tests have recently been modelled after CFMT (Dennett et al., 2012; Germine, Duchaine, & Nakayama, 2011; McGugin et al., 2012; McKone et al., 2011; McKone et al., 2012).
We include two key control recognition tests in our investigation: (a) an Abstract Art Memory Test (AAMT) of visual memory for hard-to-verbalize images (Wilmer et al., 2010), and (b) a Verbal Paired-Associates Memory Test (VPMT) of verbal memory for hard-to-visualize word pairs (Woolley, Gerbasi, Chabris, Kosslyn, & Hackman, 2008). Like CFMT, AAMT and VPMT have produced highly comparable results on the web and in the lab (Germine et al., 2012). AAMT and VPMT were chosen to enable a clean dissociation of face recognition from more general visual and verbal recognition abilities. Moreover, AAMT and VPMT examine abilities that face recognition is often intuitively grouped with. AAMT assesses visual recognition of stimuli that, like faces, are difficult to describe verbally. VPMT assesses verbal recognition of word pairs that, like the names we attach to faces, create an arbitrary association between a word and something else (here, that “something else” is a second word, in order to minimize the involvement of visual memory). The theoretical basis, reliability, and validity we establish below for these key control tests is an important step in demonstrating the specificity of face recognition.
A canonical constraint in test development is the cost of testing many individuals. Numerous iterative improvements are often required for a test to achieve adequate usability, efficiency, reliability,
validity, and norms. This iterative test development process, which in the past has often relied upon in-person assessment of many thousands of paid par-ticipants, can be extremely costly. Such an obstacle can be overcome where profit incentive is great (e.g., by private corporations), but it can otherwise be prohibitive. The potential for profit is clearly substantial for many general aptitude tests, such as IQ tests and the Scholastic Assessment Test (SAT), and for many clinical tests designed to diag-nose common specific disabilities, such as tests for dyslexia or aphasia. We propose that there is less profit incentive for tests of specific abilities, despite the broad value to society of a more indivi-dualized understanding of human performance and potential. The case of face recognition in the Wechsler Memory Scale, recounted above, may be a case in point.
Our present approach to this obstacle rests on the following insight: By providing real-time, indi-vidualized feedback on performance, web-based testing can satisfy an individual’s desire for self-knowledge while producing high-quality scientific data (Germine et al., 2012; Wilmer et al., 2010). Such an approach aligns the interests of individuals with those of science and produces the large amount of high-quality data necessary for rigorous test development. We believe there is potential for a vir-tuous circle of learning whereby the public’s direct engagement in the creation of new scientific knowl-edge facilitates science’s efforts to enhance individ-uals’ self-knowledge. As a model example of this approach, the bulk of the analyses reported in this paper use a 1,471-participant data set collected via our website Testmybrain.org. We include this entire, item-by-item data set as supplementary information to flexibly support further research efforts with the three main tests reported on here (CFMT, AAMT, and VPMT).
In sum, the present investigation isolates and measures the specific ability of face recognition. To do so, it applies the power of modern psychometric methods and web-based testing to hypotheses generated from basic cognitive and neuroscience research. Motivated by this example, we suggest that the time is right for a renewed investigation of specific abilities.
FIVE CRITERIA FOR ISOLATING AND MEASURING SPECIFIC ABILITIES
We now summarize the five test development cri-teria that we use below to isolate (Cricri-teria 1 –3) and measure (Criteria 4 – 5) face recognition ability. Following this summary, we apply each of these criteria to our battery of three tests (CFMT, AAMT, and VPMT). By applying the first three criteria, we provide clear evidence for the specificity of face recognition ability. By apply-ing the final two criteria, we (a) enable the gener-ation of two types of standardized scores for our tests, (b) evaluate the precision of our tests over their full range, and (c) allow the generation of unique error bars for each individual’s score.
Criterion 1. Clear theory of process or domain
Any test should have clear rationale for what it is designed to measure. The targeted capacity could be a particular process across domains, such as recog-nition memory regardless of what is to be recognized. It could be a particular domain across processes, such as face processing regardless of what type of proces-sing is to be done on the face. Or, it could be a par-ticular process in a parpar-ticular domain, such as face identity recognition. In Section 1, we lay out, for each of our tests, the underlying theory, details on its development, and its procedure.
Criterion 2. High reliability
Classic test theory seeks to maximize global reliability measures, such as Cronbach’s alpha or Guttman’s lambda, that provide an estimate of overall signal-to-noise in the measure. Such esti-mates are critical for interpreting the size of corre-lations, since the geometric mean of the reliabilities of two measures provides a theoretical upper bound on the correlation that may be obtained between them (Schmidt & Hunter, 1996). In Section 2, we observe high reliability for our three tests and conduct item analyses to develop a more
fine-grained appreciation for the contribution of each item to the reliability of the test as a whole.
Criterion 3. Established convergent and discriminant validity
A valid test measures what it is designed to measure. Validity is generally defined by a pattern of higher correlations with more theoretically related measures or manipulations (convergent validity) and lower correlations with less theoretically related measures or manipulations (discriminant validity; Campbell & Fiske, 1959). A valid measure of a specific ability will show particularly acute discrimi-nant validity, dissociating strongly from more general ability measures theorized to involve similar processes, similar domains, or both similar processes and similar domains. In Section 3, we first document the convergent validity of our three tests (CFMT, AAMT, and VPMT). We then show that CFMT dissociates strongly from both AAMT and VPMT despite their reliability, their convergent validity, and their focus on the puta-tively similar process of recognition memory. These dissociations show that face recognition, as assessed by CFMT, is a specific ability.
Criterion 4. Extensive norms
Norms enable the interpretation of an individual’s score by defining a reference distribution with which that score can be compared. A larger and richer normative data set can be used to more finely match the reference distribution to a given individ-ual’s age, sex, or other characteristics. Providing the entire data set directly in open-access form, as we do here, rather than just summary statistics, enables the richest and most flexible comparisons. In Section 4, we introduce our 1,471 participant norma-tive data set and characterize variation in perform-ance by age and sex.
Criterion 5. Detailed, model-based analysis of ability and precision
Item response theory (IRT) calculates ability in a model-based manner that goes beyond simply
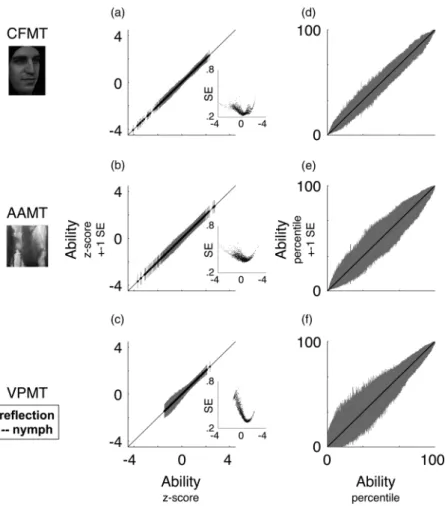
summing performance over test items. IRT scores include precision, in the form of unique standard error bars, for each individual, something that raw scores do not provide. These individual error bars facilitate clinical decision making. They may also be looked at en masse to characterize the overall precision of a measurement tool over different ranges of performance. Finally, IRT scores are less tied to the particular normative sample that was used to compute them than are traditional z scores. In Section 5, we present a minitutorial on IRT analyses. We then conduct IRT analyses on our three tests. The item-by-item data set we provide as supplementary information can be used to calculate IRT-based ability and precision estimates for any further individual who takes one or more of these tests.
SECTION 1: CLEAR THEORY OF PROCESS OR DOMAIN
Any test should have a clear theory for what it is designed to measure. It could be designed to measure a particular process across domains, a par-ticular domain across processes, or a parpar-ticular process in a particular domain. Face recognition ability is an example of a particular process in a particular domain, with recognition being the process and faces being the domain.
Such a clear theory is needed not only for tests of a candidate specific ability, but also for the control tests that are used to evaluate that speci-ficity. Our two control tests were chosen to enable a clean dissociation of face recognition from abilities similar in process (recognition memory) but different in domain (involving nonface visual and difficult-to-visualize verbal stimuli). As mentioned above, these control tests measure recognition abilities that face rec-ognition is often intuitively grouped with: (a) An Abstract Art Memory Test (AAMT) assesses visual recognition of stimuli that, like faces, are difficult to describe verbally, and (b) a Verbal Paired-Associates Memory Test (VPMT) assesses verbal recognition of word pairs that, like the names we attach to faces, create an
arbitrary association between a word and something else (here, that “something else” is a second word, in order to minimize the involve-ment of visual memory).
In this section, we describe the theory behind each of our tests, as well as each test’s
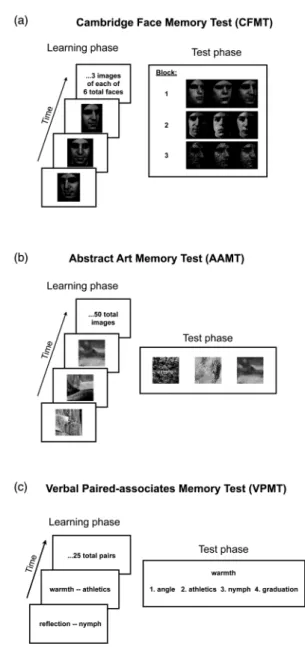
development, implementation, and procedure. The basic procedure for all three of our tests, shown in Figure 1, involves first presenting the participant with a series of stimuli to learn (“learn-ing phase”) and then ask(“learn-ing them to recognize these stimuli amongst distractors in a
multiple-Figure 1. Schematic description of three main memory tests. In the learning phase, shown at left, the participant learns novel target stimuli. In the test phase, shown at right, the participant identifies the target stimulus amongst distractors. See text for details of each test. Stimuli shown in a and b are different from, but chosen to be representative of, those used in the actual tests. To view a colour version of this figure, please see the online issue of the Journal.
choice format (“test phase”). All three tests are thus designed to assess recognition memory for novel, recently encountered stimuli.
Cambridge Face Memory Test (CFMT)
CFMT was designed to be a relatively pure test of face memory that measures the ability to learn a novel face, without involving features that are a nonintrinsic part of the face, such as hair, make-up, or jewellery (Duchaine & Nakayama, 2006). The detailed structure, motivation, and develop-ment of the Cambridge Face Memory Test is described in Duchaine and Nakayama (2006).
A graphical summary of the basic structure of CFMT is shown in Figure 1a. CFMT uses a three-alternative forced choice (3AFC) recog-nition paradigm, so chance performance is 33% correct. In an initial learning block of 18 trials, participants view each of six faces from three different viewpoints, and after seeing the three views for a given face (Figure 1a, left), they are given three test trials for that face (one example test trial shown in the first row of Figure 1a, right). In a second block of 30 trials, participants are tested on their ability to remember the six target faces in novel images from various view-points (Figure 1a, right, second row). A third block of 24 trials again tests participants on their ability to remember the target faces in novel images from various viewpoints, but adds visual noise (Figure 1a, third row). In between blocks, participants study a line-up of all six faces, simul-taneously presented, for 30 seconds.
It is worth noting that CFMT is unique amongst our three tests in its inclusion of test trials during the learning block. Performance on these trials is typically above 95% correct. These trials therefore contribute relatively little to discri-minating better from worse performance on CFMT. Rationales for having these trials include (a) boosting the morale of those who may perform poorly on the rest of the test (CFMT was originally developed as a clinical test to ident-ify developmental prosopagnosic patients) and (b) reinforcing the learning process (learning of faces is notoriously challenging, relative to other
stimulus classes; Duchaine & Nakayama, 2006). As we see below, some of these Block 1 items also discriminate well between relatively low-per-forming individuals, thereby contributing to CFMT’s utility as a diagnostic test for poor face recognition ability.
Abstract Art Memory Test (AAMT)
AAMT was designed to be a relatively pure test of visual memory that would measure individual differences in learning of visual images without unduly involving verbal processing or semantic knowledge (Chatterjee, Russell & Nakayama, 2009). The stimulus images used in AAMT were abstract images without any identifiable object or obvious semantic content—essentially images that were hard to verbalize, as faces are in the absence of a name.
We wanted a relatively pure measure of visual memory for novel, nonface stimuli. We chose abstract art as the stimulus category to make the test sufficiently challenging, to reduce the useful-ness of verbal strategies, and to minimize the impact of specific semantic knowledge or other forms of expertise by minimizing dependence on prior knowledge of known objects. Abstract art is an uncommon category to have substantial expertise in, and due to its abstract nature, it is nonobvious that such expertise would aid memory, short of direct prior experience with the specific items to be remembered. Indeed, abstract art eschews, by definition, physical realism, semantic information, and simple categ-orization, and, contrary to most object classes, it tends not to share common organizational fea-tures. In contrast, individual differences in visual expertise can be ubiquitous for more semantically loaded stimulus classes such as cars (Dennett et al., 2012). These individual differences in visual expertise for a specific stimulus category of personal interest may obscure broader and more fundamental individual differences in nonface visual memory.
A graphical summary of the basic structure of AAMT is shown in Figure 1b. AAMT uses a 3AFC recognition paradigm, so chance
performance is 33% correct. During the learning phase (Figure 1b, left), participants study a series of 50 abstract art images, each presented for one second, with a one-second blank screen between images. During the subsequent test phase (Figure 1b, right), participants are asked to identify each memorized image amongst two novel images. Each previously viewed image is tested once, for 50 total trials. A short practice was given at the beginning, with two images memorized and then tested. The images were multicolour. Each image was cropped into a square of the same size. The order of target images in the testing phase is random with respect to the order of target images in the learning phase, but the order of images in the learning phase, and the order of trials in the test phase, are both the same across participants.
In an initial piloting phase, we used a version of the test that contained 100 rather than 50 images. Based on pilot data, we honed the test to a more efficient 50-item version that retained a high level of reliability and aimed mean performance at 66% accuracy, midway between chance and ceiling (see Sections 2 and 5 and Table 1 above for discussions of how this midway point tends to relate to reliability and precision).
Verbal Paired-Associates Memory Test (VPMT)
VPMT (first used by Woolley et al., 2008) was designed to be a relatively pure test of verbal memory that would measure individual differences in episodic verbal memory without involving visual – spatial processing.
A graphical summary of the basic structure of VPMT is shown in Figure 1c. VPMT uses a four-alternative forced choice (4AFC) recognition paradigm, so chance performance is 25% correct. During the learning phase (Figure 1c, left), partici-pants study a series of 25 word pairs, each presented for six seconds. During the subsequent test phase (Figure 1c, right), participants view the first word in each pair, along with four alternative candidates for the second word, and are asked to select the one that was in the original pair they studied.
In order to make the test difficult (it was initially designed to identify extraordinary perfor-mers in Woolley et al., 2008) and to reduce the usefulness of visual – spatial strategies (a desirable quality for isolating verbal recognition with minimal contribution of visual processing), only abstract nouns were used. Paivio (1965) showed that paired associate learning is significantly worse for abstract word pairs than for concrete word pairs. Paivio, Yuille, and Madigan’s (1968) norms for concreteness and imagery of nouns were used to select a set of 100 abstract nouns with low concreteness and imageability ratings (e.g., “hope”) that were not also extremely uncom-mon. These words were then randomly separated into four lists of 25 words, two destined to be cues and two destined to be targets. As semantic similarity can significantly aid memory (Howard & Kahana, 2002), cues and targets were matched to minimize semantic relatedness (using latent semantic analysis) and to avoid matching words that started with the same letter or ended with the same letter string (e.g., no “-tion” words were paired). For each cue – target pair, three dis-tractor words were chosen from the other possible target words in the same list. The distractor words were randomly chosen, with the constraints that each word appeared as a target word once, and three times as a distractor word, and the three dis-tractor words were different from one another on every trial. Two versions of the test (Forms A and B) were thus prepared, each with a unique set of word pairs. Form A was used here. The ver-sions were approximately equal in word and word-pair ratings.
The six-second presentation of word pairs during the learning phase was slightly longer than the most typical duration (five seconds) found in the literature because the abstractness and unrelatedness of the words in the pairs had already made the test more difficult than typical versions. The word pairs in the learning phase and the trials in the test phase were presented in a single predetermined random order. The order of the 25 test trials, one for each memorized word pair, was unrelated to the order of word pairs in the study phase). In the data reported in
this paper (Normative Data Set A), the original CFMT was administered between VPMT’s learn-ing phase and test phase, which made VPMT’s test phase more difficult.
SECTION 2: HIGH RELIABILITY
Measuring reliability is necessary for interpreting the magnitude of correlations between tests. Optimizing efficiency is one of the fundamental aims of classic test theory; if higher reliability can be achieved from shorter tests, measurement error is reduced, statistical power enhanced, and inferences strengthened. In this section, we focus first on measuring reliability and then on evaluat-ing efficiency.
Our first analysis below measures the reliability of our three tests and finds them all to be high by conventional standards. Our second analysis, a stan-dard item analysis, provides a window into the con-tribution of individual items to the reliability of each test. Such item analyses can guide efforts to add and drop items in order to increase a test’s reliability and/or its efficiency. The results of these item analyses suggest that while incremental improvements in efficiency may still be possible, these tests are already quite efficient.
Our third analysis, a modified item analysis, illustrates the limitations of a standard item analy-sis by showing that some items discriminate better at lower ability levels, while other items discrimi-nate better at higher ability levels. When aiming for a test that captures performance across the full range of abilities, as we advocate here, it is helpful to choose a variety of items, some that dis-criminate well at lower ability levels and some that discriminate well at higher ability levels. This modified item analysis provides a bridge to Section 5. The IRT analyses we conduct in that section explicitly model performance on each item by ability level. These IRT analyses ulti-mately allow a more principled estimate of ability that includes unique error bars for each person.
All three analyses reported in this section were computed using the 1,471-person normative data
set described in Section 4, which is provided as supplementary materials.
Analysis 1: Reliability
The reliability of a test directly limits the size of its correlations with other tests. For example, if two measures each have a reliability of .5, the theoreti-cal upper bound on their correlation with each other is .5. More generally, the theoretical upper bound on the correlation between two measures is computed as the geometric mean of their reliabilities (Schmidt & Hunter, 1996). Correlations scale proportionally with this upper bound. For example, the same underlying relationship that produces a .2 correlation with an upper bound of .4 would be expected to produce a .3 correlation with an upper bound of .6 and a .5 correlation if it were possible for the upper bound to reach 1.0 (Schmidt & Hunter, 1996). Tests of the signifi-cance of the difference between two correlations implicitly assume that the upper bounds on these correlations are the same. If upper bounds differ between two correlations, then this should be taken into account when comparing them (Schmidt & Hunter, 1996).
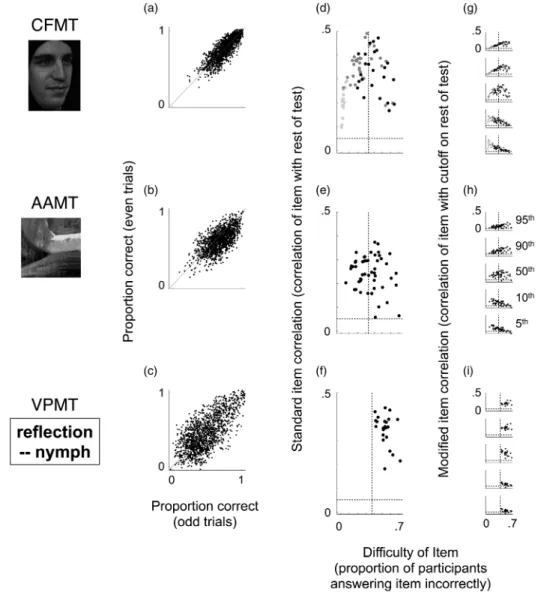
Several basic approaches exist for measuring reliability, each capturing somewhat different potential sources of measurement noise. Here, we focus on internal reliability, which assesses the noise present even within a single adminis-tration of the test. To visualize the reliability of our three tests, we plot in Figures 2a – 2c the per-formance of each individual on even trials (y-axis) against their performance on odd trials (x-axis). For all three tests, performance on odd trials is clearly highly predictive of performance on even trials. The correlations shown here imply Spearman – Brown corrected split-half reliabilities of .91, .80, and .83 for CFMT, AAMT, and VPMT, respectively. The Cronbach’s alpha reliabilities for these three tests—interpretable as the mean of all possible Spearman – Brown cor-rected split-half reliabilities (Cortina, 1993)—are .90, .80, and .81 for CFMT, AAMT, and VPMT, respectively. These internal reliabilities are high by conventional standards, reaching or
Figure 2. Reliability and item analyses. Split-half correlations (left column), standard item analyses (middle column), and modified item analyses (right column) for the Cambridge Face Memory Test (CFMT; top row), an Abstract Art Memory Test (AAMT; middle row), and a Verbal Paired-Associates Memory Test (VPMT; bottom row), plotted with data from the normative sample described in Section 4. Graphs A –C plot the relationship between the two halves of each test (even items on y-axis plotted against odd items on x-axis). In these graphs, the line shown plots x ¼ y. Graphs D –F plot results of a standard item analysis. In these graphs, item correlations (y-axis; correlation between item and rest of test) are plotted against item difficulty (x-axis; proportion of persons answering that item incorrectly). The horizontal lines in Graphs D –F indicate statistical significance (p ¼ .05, two-tailed), and the vertical lines indicate the midway point between ceiling and chance performance (the so-called psychometric sweet spot; see text). Different dot shades in Graph D indicate CFMT’s Blocks 1 (light grey), 2 (dark grey), and 3 (black). Graphs G– I show results of a modified item analysis, designed to highlight how a single item can discriminate differently at different ability levels. Graphs G – I are in most ways identical to Graphs D – E; the x-axis is the same, and the y-axis is also the same except that performance on the rest of the test is dichotomized at a given percentile cut-off (this focuses the analysis on the ability level represented by that percentile cut-off). Axis ranges in all Graphs D – I are the same.
exceeding the level of .80 that is generally required of high-stakes tests (DeVellis, 1991).
Analysis 2: Standard item analysis
All else equal, adding items increases, and drop-ping items decreases, a test’s reliability. Test devel-opment typically involves some combination of adding and dropping items to balance the desire for high reliability with the desire for constrained test length. Item analyses provide useful guidance for such efforts.
A standard item analysis technique is to corre-late performance on each item with summed per-formance on the remainder of the test. We call these correlation values “item correlations”. An item correlation provides a rough measure of an item’s contribution to test reliability. Figures 2d – 2f show item correlations for each of our three tests (y-axis), arrayed by item difficulty (x-axis). Item difficulty is defined here as the proportion of persons who answered an item incorrectly. We now examine Figures 2d– 2f in some detail to evaluate the contributions of their individual items to their reliability.
A basic aim for a test designed to measure a single ability is for as many items as possible to show a robust, positive item correlation, indicating that they contribute nonzero information to the measurement being made. In Figures 2d – 2f, all items on all three tests satisfy this aim by showing positive item correlations that are above the threshold for statistical significance (threshold of p ¼ .05, two-tailed, indicated by horizontal dotted line). An item can, however, contain nonzero positive information about an ability, yet also contain enough noise with respect to that ability that it has no overall effect on reliability (or it could even reduce reliability). A case in point is provided by Block 1 of CFMT, shown as the light-grey dots in Figure 2d. While all item corre-lations for this block are positive and statistically significant, CFMT’s reliability is essentially equally high with or without these items included (e.g., Cronbach’s alpha with these items ¼ .90; Cronbach’s without these items ¼ .89).
In many cases, evidence against a contribution to reliability of one or several items justifies short-ening the test by dropping those items from the test. The items in CFMT’s Block 1, however, serve two purposes that are unrelated to issues of reliability. First, as discussed in Section 1 above, they are designed to reinforce the learning process and to maintain morale for individuals who go on to perform poorly on the rest of the test (Duchaine & Nakayama, 2006). Second, as we discuss just below in Analysis 3, some of these items distinguish relatively well at the low end of performance. The case of CFMT’s Block 1, therefore, illustrates the importance of balan-cing potentially multiple theory-driven and data-driven considerations when making decisions about dropping or adding items.
A general trend amongst item correlations is evident for all tests, but especially for CFMT, when item correlations are arrayed by item diffi-culty, as in Figures 2d– 2f. All else equal, items that show the highest item correlations, and therefore contribute most to reliability, tend to have a difficulty about midway between perfect performance and chance performance (Lord & Novick, 1968). For three-alternative forced-choice tests like CFMT and AAMT, where perfect performance is 0% incorrect (100% correct), and chance performance is 67% incorrect (33% correct), this so-called sweet spot of difficulty is 33% incorrect (67% correct). From a psychometric perspective, a mean item dif-ficulty near the sweet spot is generally a desirable quality in a test. Yet though items near the sweet spot tend to contribute the most to reliability, a range of difficulties is still generally preferred when the aim is to precisely capture individual performance over a broad range of ability levels. The reason for this is that hard items tend to discriminate particu-larly well at high ability levels, and easy items tend to discriminate particularly well at low ability levels (for further discussion of this point, see Analysis 3 of this section, and see Section 5).
Several insights about our tests can be gained by comparing and contrasting their item difficulties in Figures 2d – 2f. First, the mean item difficulty on AAMT is near the sweet spot of 33% incorrect (Figure 2e). As discussed just above, this is, all
things equal, a desirable quality in a test. Second, while CFMT’s mean item difficulty of 25% is easier than the sweet spot, its mean item difficulty for just Blocks 2 and 3 (dark-grey and black dots, Figure 2d) is right at the sweet spot (33% incor-rect). Therefore, after Block 1, the morale-build-ing learnmorale-build-ing phase of CFMT for which most participants perform near ceiling (light-grey dots, Figure 2d), CFMT contains 54 additional trials whose mean item difficulty is right at the sweet spot. Third, VPMT’s item difficulties, in contrast to the other two tests, are all greater than the sweet spot (Figure 2f). Two related consequences of the relative difficulty of VPMT’s items are: (a) as we demonstrate below in Analysis 3 of this section, many of VPMT’s items distinguish par-ticularly well at the high end of performance, and (b) as we demonstrate below in Section 5, VPMT, as a whole, distinguishes better at the high end of performance than at the low end.
Insights about the source of the high reliability for these three tests can be gleaned from their item correlations shown on the y-axes of Figures 2d –2f. First, VPMT has the highest mean item corre-lation of the three tests (.35, versus .31 for CFMT and .24 for AAMT). Despite having fewer items than the other tests (25 items), VPMT therefore still manages to attain a high reliability. Second, though AAMT’s mean item correlation is lower than VPMT’s, its reliability is equal to VPMT’s because of its greater number of items (50 items). As mentioned above, all things equal, increasing test length increases reliability. Third, while CFMT’s Block 1 contributes little to its reliability (see discussion of this point in Analysis 1 just above), a finding consistent with its positive but low item corre-lations, CFMT’s remaining 54 items are both numerous and high in item correlations (54 items is more than VPMT and similar to AAMT; and the mean item correlation for these items is .35, higher than AAMT’s mean item cor-relation and equal to VPMT’s). CFMT’s high reliability—higher than both AAMT and VPMT—derives from the numerous items in CFMT’s Blocks 2 and 3 with high item correlations.
In sum, substantial insight can be gleaned from a standard item analysis about the contributions of individual items to the reliability of a measure. The item analyses shown in Figures 2d – 2f for our three tests suggest that the individual items on these tests consistently contribute positive information to the measurement of the ability being assessed. While there remains room for potentially creating more reliable and efficient versions of these tests, they already have reliability that is high by conven-tional standards, justifying their use in a wide variety of circumstances. We now turn to a modi-fied item analysis that highlights the relationship between item difficulty and the ability of an item to discriminate effectively over different ranges of performance. This analysis will provide a concep-tual link between the focus in the present section on the reliability of a test and the focus in Section 5 on the precision of an individual person’s score on that test.
Analysis 3: Modified item analysis examining the high and low ends of performance
It can be tempting to conclude from a standard item analysis, such as the one conducted just above, that the ideal test would consist entirely of items right at the sweet spot of difficulty, midway between chance and ceiling. While such a test would probably dis-criminate well amongst persons who perform near the middle of the test’s range (of which there are often many), it would probably discriminate poorly amongst persons who perform rather well on the test, and also poorly amongst persons who perform rather poorly on the test. A test with a broader range of difficulties is typically preferred for its ability to more effectively capture perform-ance across a broader range of ability levels.
Figures 2g–2i show the results of a modified item analysis that illustrates, more fully than the standard item analysis presented just above, how each item discriminates at a variety of different performance levels. The modified item analysis is, in most ways, identical to the standard item analysis presented above. Like that analysis, it correlates performance on each item with summed performance on the rest of the test. Unlike that analysis, however, it
dichotomizes performance on the rest of the test at a particular percentile cut-off. This focuses the analy-sis on each item’s ability to discriminate at that per-centile level of performance. For example, a cut-off at the 95th percentile focuses the analysis on each item’s ability to discriminate individuals who score exceptionally well (at or above the 95th percentile) from the rest (below the 95th percentile).
As a case in point of how item correlations may change when focusing on a particular cut-off away from the middle of the test’s range, consider once again CFMT’s Block 1. As discussed above, per-formance on this block is near ceiling, and its item correlations in a standard item analysis are low enough that it does not contribute to CFMT’s reliability. At the 5th-percentile cut-off (Figure 2g, bottom plot), however, the mean item correlation for Block 1 (.23) is higher than that of both Block 2 (.18) and Block 3 (.11), suggesting that Block 1 contributes substantial information to distinguishing individuals at a cut-off that could be critical for clinical decision making. This case illustrates how the value of certain items may be obscured by a standard item analysis.
We now take a broader look at these modified item analyses across all three tests (Figures 2g – 2i). A tendency can be seen whereby easier items discriminate better at lower percentile cut-offs (5th or 10th, bottom two graphs), and harder items discriminate better at higher percentile cut-offs (95th or 90th, top two graphs). Items nearer to the sweet spot of difficulty, in contrast, tend to discriminate better at the median split cut-off (50th percentile, middle graph). The 50th-percentile cut-off graphs (Figures 2g – 2i, middle) paint a picture similar to the standard item analyses (Figures 2d – 2f). The reason for this similarity is that the results of standard item analyses tend to be drawn toward the relatively large proportion of participants who typically perform near the median. The progression, from lower percentile cut-offs, where easier items discriminate best, to higher percentile cut-offs, where harder items discriminate best, is particularly clear for both CFMT (Figure 2g, bottom-to-top graph) and AAMT (Figure 2h, bottom-to-top graph). The same basic progression
holds for VPMT (Figure 2i, bottom-to-top), but it is somewhat less clear because VPMT contains no items easier than the sweet spot. Still, as with the other tests, items near VPMT’s sweet spot tend to discriminate best at the median split cut-off (Figure 2i, middle graph), and VPMT’s more dif-ficult items discriminate better at the higher cut-offs (95th and 90th, top two graphs) than at the lower cut-offs (5th and 10th, bottom two graphs). One can imagine that if VPMT had included items easier than the sweet spot, they may have discriminated better at the lower cut-offs (5th and 10th) than the higher cut-cut-offs (95th and 90th). Consistently across tests, there-fore, the more difficult the item, the more likely it is to discriminate well at higher cut-offs.
Modified item analyses like these provide a more complete view than standard item analyses of the contributions of individual items to captur-ing performance over different ranges of ability. These item analyses therefore provide more com-prehensive guidance for deciding which items to drop and retain when seeking a test that effectively captures a wide range of performance levels. When aiming to capture a broad range of performance, one should favour a range of items that includes some (usually harder items) that discriminate well at higher cut-offs and some (usually easier items) that discriminate well at lower cut-offs.
In Section 5, we pick up where our modified item analysis leaves off with an IRT analysis. IRT moves beyond classic test theory by explicitly modelling both the performance level that each item discriminates best at and the power of each item for discriminating at its optimal performance level. This more detailed consideration of item characteristics provides the information necessary to generate a more principled estimate of each individual’s ability, complete with error bars that indicate the precision of that estimate.
SECTION 3. CONVERGENT AND DISCRIMINANT VALIDITY
In this section, we establish the convergent and dis-criminant validity of our three measures. Combined
with the theoretical basis provided in Section 1 and the reliability analyses in Section 2, the evidence for validity presented here provides clear support for the specificity of face recognition ability.
The validity of a test is generally defined as the combination of convergent validity, or higher cor-relations with more theoretically related measures or manipulations, and discriminant validity, or lower correlations with less theoretically related measures or manipulations (Campbell & Fiske, 1959). Together, reasonable evidence for both convergent and discriminant validity demonstrates that a test measures what it is designed to measure. Specificity is supported when a test shows par-ticularly acute discriminant validity, correlating little with reliable and valid tests that measure either conceptually similar abilities or highly general abilities like IQ. Conceptually similar abil-ities may be similar in process, domain, or some combination of the two. In this section, we dis-sociate face recognition ability from two tests that are similar in process to CFMT, involving recognition memory for recently learned items, yet different in domain, involving diffi-cult-to-verbalize nonface visual stimuli (AAMT) and difficult-to-visualize verbal stimuli (VPMT).
We consider convergent validity first and dis-criminant validity second because robust evidence that each measure taps its intended ability (i.e., convergent validity) amplifies the specificity that can be inferred from a dissociation between measures (i.e., discriminant validity). Analyses of convergent validity show that each of our three main measures correlates highly with an indepen-dent test designed to capture a theoretically related construct. Analyses of discriminant validity show that our three main measures dissociate strongly from each other. Given the reliability, convergent validity, and conceptual similarity of CFMT, AAMT, and VPMT, the strong dissociation between them suggests a high degree of specificity for face recognition.
Convergent validity
In the paragraphs below, we describe three additional tests (a Famous Faces Memory Test,
FFMT; an Object and Scene Memory Test, OSMT; and a Code Learning Memory Test, CLMT) and report how each of them, respectively, establishes the a convergent validity of one of our three main tests (CFMT, AAMT, and VPMT, respectively). The best evidence for convergent validity comes from a sizable correlation with a test designed to capture the mechanism of interest in a rather different way (a “remote association,” Wilmer, 2008). It is therefore a strength of these additional tests, for establishing convergent validity, that they differ in several ways from our tests of interest.
Famous Face Memory Test (FFMT) and Cambridge Face Memory Test (CFMT)
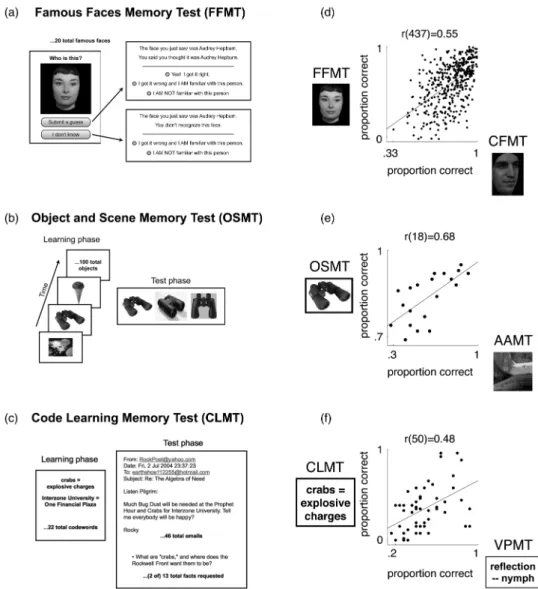
Figure 3a illustrates the procedure for our Famous Faces Memory Test (FFMT). FFMT consists of 20 total trials. For each trial, the participant is shown a famous face and is asked “Who is this?” (Figure 3a, left). If they submit a guess, they are shown the correct answer along with their guess and are asked to indicate whether they got the name correct (Figure 3a, right top). A participant’s total score on this test is computed as the number of faces out of 20 for which they submit a guess and verify that they produced the correct name. We favour this self-scoring procedure, which we find produces highly accurate results, because it allows misspellings of the correct answer to be scored as correct. Participants who do not produce the correct name are additionally asked to indicate whether they are familiar with the person (Figure 3a, right top and bottom), but this does not figure into the scoring procedure. The famous faces are: Angelina Jolie, Audrey Hepburn, Barack Obama, David Beckham, Demi Moore, Johnny Depp, Donald Trump, Fred Astaire, George Clooney, John F. Kennedy, Jr., Matt Damon, Paul McCartney, Nicole Kidman, Uma Thurman, Tyra Banks, Margaret Thatcher, Stephen Colbert, Scarlett Johansson, Susan Sarandon, and Renee Zellweger.
FFMT differs from CFMT in multiple ways. For example: (a) While CFMT tests the ability to recognize which of three faces was seen before, FFMT tests the ability to recall the name that goes with a face; (b) while CFMT tests the ability
to recognize faces encountered seconds or minutes before, FFMT tests the ability to draw upon longer term memories for faces that may have accu-mulated over months, years, or even decades; and (3) while CFMT requires no particular knowledge obtained prior to completing the test, knowledge
of the particular famous faces tested in FFMT may vary with age and/or cultural literacy.
In Figure 3d, we show data on FFMT and CFMT. Despite multiple differences in the time-frame and nature of the memory task, FFMT and CFMT correlated robustly—r(437) ¼
Figure 3. Convergent validity. (A– C) Schematic descriptions of tests that establish convergent validity (see text for full details). (D –F) Performance on tests from A– C is plotted against performance on the test whose convergent validity it establishes. Dots in D are jittered slightly over the range plus-or-minus half an item correct, for improved visibility of individual data points. Least-squares line is drawn. The data plotted in F were originally reported by Woolley and colleagues (2008). Stimulus shown for FFMT is different from, but chosen to be representative of, the image of Audrey Hepburn used in the actual test. CFMT ¼ Cambridge Face Memory Test. AAMT ¼ Abstract Art Memory Test. VPMT ¼ Verbal Paired-Associates Memory Test.
.55, 95% [CI .48, .61], 31% of variance explained— indicating high convergent validity.
The 439 participants in this data set completed FFMT and CFMT on Testmybrain.org between January and March, 2010 (315 female; mean age 35 years; standard deviation age 16). On FFMT, these participants averaged 60.0% correct, with a standard deviation of 23.7% and a Cronbach’s alpha reliability of .86. On the CFMT, these par-ticipants averaged 79.8% correct, with a standard deviation of 13.2% and a Cronbach’s alpha reliability of .90.
Object and Scene Memory Test (OSMT) and Abstract Art Memory Test (AAMT)
Figure 3b illustrates the procedure for our Object and Scene Memory Test (OSMT). OSMT con-sists of 100 total trials. The basic format of OSMT is the same as that for AAMT (see description of AAMT in Section 1 above). Like AAMT, OSMT starts with a learning phase where all target images are viewed, one at a time, and it then proceeds to a test phase where the par-ticipant is required to identify each target image amongst two distractor images.
OSMT differs from AAMT in its domain. Whereas the images in AAMT were abstract and relatively devoid of semantic information, the images in OSMT were of objects and scenes that were rich in semantic information. Despite this semantic content, test trials in OSMT were designed such that explicit verbal labels were unli-kely to aid the recognition process. Verbal labels were rendered relatively ineffective by choosing distractors that would typically receive the same verbal label as the target image. For example, in Figure 3b, “black binoculars” would describe all three images in the shown test trial. Likewise, when the other two learning phase images shown in Figure 3b were encountered in the test phase, the labels “lily pads with flower” and “chocolate ice cream cone” would apply to all three images shown in the respective test trials.
In Figure 3e, we show data on OSMT and AAMT. Despite the difference in domain and the far greater semantic content of stimuli in OSMT compared to AAMT, these two tests
correlated robustly—r(18) ¼ .68, 95% CI [.34, .86], 46% of variance explained—indicating high convergent validity.
The 20 participants in this data set completed OSMT and AAMT in the lab (12 female; mean age 48 years; standard deviation age 12). On OSMT, these participants averaged 83.8% correct, with a standard deviation of 8.3% and a Cronbach’s alpha reliability of .83. On the AAMT, these participants averaged 58.7% correct, with a standard deviation of 18.9% and a Cronbach’s alpha reliability of .89.
Code Learning Memory Test (CLMT) and Verbal Paired-Associates Memory Test (VPMT)
Figure 3c illustrates the procedure for our Code Learning Memory Test (CLMT). In CLMT, par-ticipants are given five minutes to study a list of 22 pairs of codewords and their meanings (e.g., “bug dust ¼ diversions”). The codeword – meaning pairs are presented for approximately 13 seconds each. Participants are then given a set of 46 ficti-tious email messages written using the codewords. These emails are written as if recovered from a ter-rorist organization that uses the studied code. Participants are allowed to read the emails at their own pace, but are not allowed to reaccess the codeword-meaning list after the initial study period. Participants’ performance on CLMT is measured by free-response answers to 13 questions about the content of the emails. Participants’ responses are coded for correctness, and a pro-portion correct score, out of 13, is calculated.
While CLMT and VPMT are similar in their requirement to pair one word in memory with another word, they differ in multiple ways. For example: (a) While VPMT tests the ability to recognize which of four word-pairs was seen before, CLMT tests the ability to recall the word that was paired with the presented code word; (b) while VPMT uses abstract, difficult-to-visual-ize words, CLMT uses both abstract and concrete words; and (c) while VPMT is presented in a rela-tively abstract manner, CLMT is embedded in a vivid narrative.
In Figure 3f, we show data on VPMT and CLMT, originally reported by Woolley and
colleagues (2008). Despite the difference in the type and amount of verbal material to be remem-bered, the method of testing memory, and the response modality, the two tasks correlated robustly—r(50) ¼ .48, 95% CIs [.24, .67], 23% of variance explained—indicating high convergent validity.
The 52 participants in this data set completed CLMT, VPMT, and CFMT in the lab (40 female; mean age 31 years; standard deviation age 10). On CLMT, these participants averaged 40.0% correct, with a standard deviation of 25.1%. On VPMT, these participants averaged 49.5% correct, with a standard deviation of 20.0%. On CFMT, these participants averaged 73.4% correct, with a standard deviation of 13.7%. Internal reliability statistics are not avail-able for this data set. In contrast to the robust correlation between VPMT and CLMT, CFMT dissociated strongly from both VPMT—r(50) ¼ .12, 95% CIs [ – .16, .38], 1% of variance explained—and CLMT—r(50) ¼ .08, 95% CIs [ – .20, .34], 1% of variance explained.
Discriminant validity
The best evidence for discriminant validity comes from a low correlation with a test designed to capture a
similar process or domain (a “proximal dissociation”; Wilmer, 2008). It is therefore a strength of our two control tests (AAMT and VPMT), for establish-ing discriminant validity, that they and CFMT are all designed to capture a similar process: recog-nition memory for novel, recently encountered stimuli. Given evidence provided above that CFMT, AAMT, and VPMT are all reliable and high in convergent validity, we are now poised to consider whether they dissociate from each other clearly enough to support an inference of speci-ficity for face recognition.
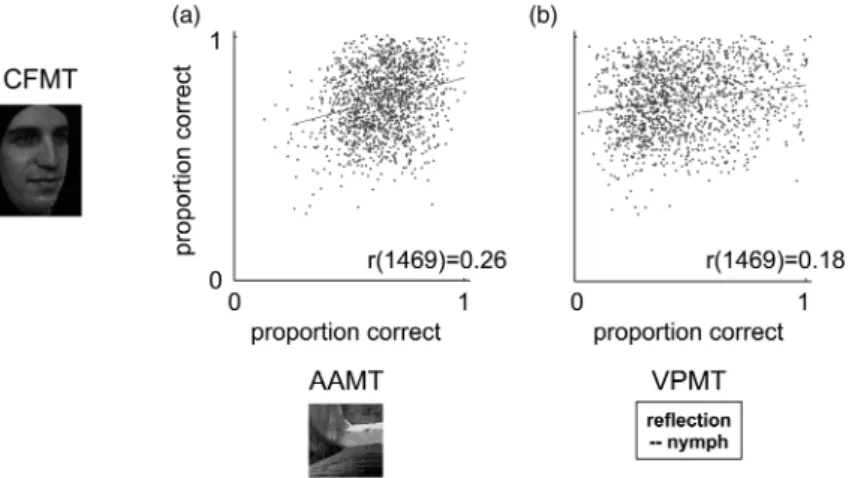
Figure 4 plots the correlations of CFMT with both AAMT and VPMT. These correlations are low, explaining just a few percentage points of var-iance. CFMT correlates .26 with AAMT (95% CI [.21, .31], Figure 4a, 6.8% of variance explained) and .18 with VPMT (95% CI [.13, .23], Figure 4b, 3.1% of variance explained). AAMT and VPMT also largely dissociate from each other, correlating .25 (95% CI [.20, .30], 6.3% of variance explained). In regression analyses, AAMT and VPMT together explained only 8.1% of the var-iance in CFMT, and this value was even smaller (6.8%) with age regressed out of the tests (to account for the curvilinear relationship between age and our tests—see discussion of norms in Section 4 below—age was regressed out of each test with a second order regression).
Figure 4. Discriminant validity. Performance on the Cambridge Face Memory Test (CFMT) is plotted against performance on (A) an Abstract Art Memory Test (AAMT) and (B) a Verbal Paired-Associates Memory Test (VPMT). For improved visibility of individual data points, dots are jittered slightly over the range plus-or-minus half an item correct. Least-squares lines are drawn.
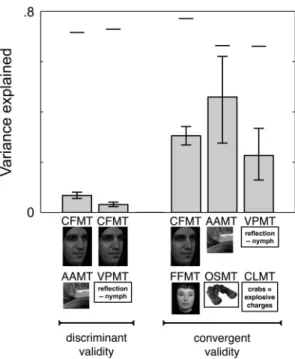
Figure 5 presents the variance explained by the correlations of CFMT with AAMT and VPMT (left two bars) next to the higher variance explained by the three convergent validity correlations cussed above (right three bars). Clearly, CFMT dis-sociates strongly from AAMT and VPMT, relative to its higher correlation with FFMT. Moreover, CFMT’s low correlations with AAMT and VPMT are not due to low convergent validity of AAMT or VPMT, as both AAMT and VPMT correlate highly with an independently designed measure aimed at capturing a theoretically related construct. Neither are CFMT’s low correlations with AAMT and VPMT due to low reliability. The upper bounds on these correlations, set by the reliability of these tests, are .846 and .854,
respectively (upper bounds in Figure 5 are shown by horizontal lines above bars; see Section 2 for information on theory and computation of upper bounds). As described above under “Convergent validity”, CFMT also dissociates strongly from CLMT. Together, these dissociations provide strong evidence for the specificity of face recognition ability.
Clinically, our data have clear implications for the likelihood that a prospective developmental prosopagnosic individual who has been flagged based on a given diagnostic cut-off score on CFMT will ultimately demonstrate a deficit that is specific to faces. Consider, for example, that of the 30 (2.0%) of individuals in our sample who scored more than two standard deviations below
Figure 5. Specificity of face recognition ability. Convergent and discriminant validity correlations from Figures 3 and 4 are plotted here in terms of variance explained to demonstrate the Cambridge Face Memory Test’s (CFMT’s) specificity. Labels and pictures below each bar indicate the two tasks correlated. Error bars are +1 SE. Horizontal lines above each bar indicate the upper bound on variance explained set by the reliability of the tests being correlated. Since the Code Learning Memory Test’s (CLMT’s) reliability is not known, upper bound for rightmost correlation is estimated as the Verbal Paired-Associates Memory Test’s (VPMT’s) reliability. The substantial independence of CFMT from the Abstract Art Memory Test (AAMT) and VPMT, and CFMT’s high association with the Famous Faces Memory Test (FFMT), indicate the combination of acute discriminant validity and high convergent validity necessary to demonstrate that an ability is specific. OSMT ¼ Object and Scene Memory Test. Critically, CFMT’s strong dissociations with AAMT and VPMT can be explained neither by poor reliability, as the upper bounds on left two correlations are high, nor by poor convergent validity for AAMT or VPMT, as each shows substantial association with a theoretically related task designed to demonstrate its convergent validity. OSMT ¼ Object and Scene Memory Test.
CFMT’s mean, a full 10 scored above AAMT’s mean, and another 8 scored within a single stan-dard deviation below AAMT’s mean. Similarly, 9 of these 30 individuals scored above VPMT’s mean, and 10 scored within a single standard devi-ation below VPMT’s mean. The mean AAMT and VPMT z scores for these prospective proso-pagnosic individuals were – 0.65 and – 0.43, respectively. In short, the majority of individuals in our large, unselected population whose CFMT scores meet a commonly used diagnostic cut-off for developmental prosopagnosia show little evidence of a more general verbal, or even visual, recognition impairment.
In sum, CFMT shows robust evidence for specificity by dissociating strongly from two other theoretically driven, reliable, and valid tests of recognition memory.
SECTION 4. EXTENSIVE NORMS
Having supported face recognition’s specificity in Sections 1 – 3, we now turn our attention, in Sections 4 and 5, to enabling the most meaningful interpretation of an individual person’s perform-ance on our tests. Here in Section 4 we facilitate this interpretation by establishing norms for our three main tests, including provision of the entire normative data set as supplementary information (this same data set was used for the reliability lyses, item analyses, and convergent validity ana-lyses reported in Sections 2 and 3 above). Below, in Section 5, we apply powerful IRT methods to this normative data set.
Norms enable the interpretation of a particular score for a particular individual by defining a refer-ence distribution to which the individual’s per-formance can be compared. For example, it may be desirable to compare an individual to those of similar age or similar gender. The 1,471-person data set we provide as supplementary information can be used to compute either a z score or percen-tile score, based on the most appropriate reference distribution, for any new individual who takes one or more of these tests. The ability to pull together such a reference group on the fly provides maximal
flexibility to such normative analyses, whether they are being used to inform diagnostic criteria or to capture normal variation.
As we see in Section 5, the size of this data set and the inclusion of item-by-item data also support the generation of a sophisticated IRT-based score for any new individual who takes one or more of these tests. A key virtue of IRT-based scores is that they include unique error bars—a measure of precision—for each individual, some-thing that no other scoring procedure provides. Such unique error bars are particularly useful in clinical contexts, where establishing the confidence with which a person’s score meets (or misses) a diagnostic threshold is of key importance.
Overview of norms
Since the availability of our normative data set as supplementary information provides direct access to detailed normative information for our tests, our chief aim in this subsection is to convey a general flavour for this data set, and to develop the reader’s intuitions for it, via the visual displays provided in Figure 6.
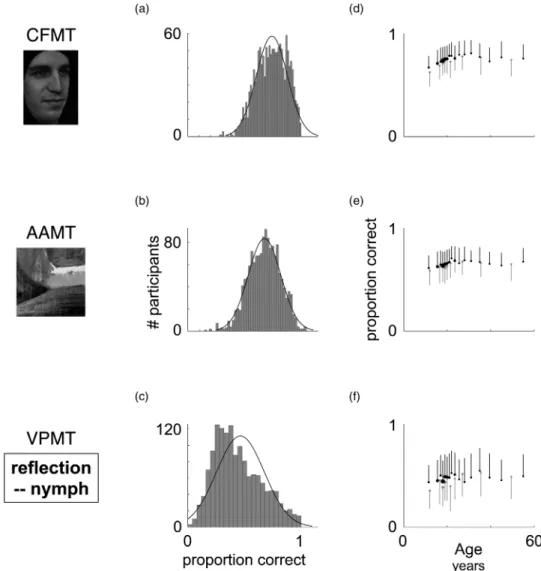
Figures 6a–6c characterize the overall distri-bution of performance for CFMT, AAMT, and VPMT, respectively. For each test, the mean, median, standard deviation, skewness, and 95% confidence interval for skewness, respectively, are: 74.2%, 75.0%, 13.7%, –0.28, and [–0.41, –0.16] for CFMT; 64.8%, 66.0%, 13.7%, –0.23, and [–.35, –.10] for AAMT; and 46.4%, 44.0%, 21.1%, 0.53, and [0.40, 0.65] for VPMT. The mod-erate positive skew of VPMT raises the question of whether it may discriminate better at the high end of performance than the low end (due to a possible floor effect). Conversely, the negative skews of CFMT and AAMT, though small in magnitude, raise the question of whether one or both tests may discriminate better at the low end of perform-ance than at the high end (due to a possible ceiling effect). As we see below in Section 5, VPMT does discriminate best at the high end, consistent with some degree of floor effect. In contrast, CFMT and AAMT discriminate equally well at both the
high and low end of performance, showing no evi-dence for a ceiling effect.
Our tests show clear age and sex effects. Figures 6d – 6f summarize mean performance on our three main tests by age (x-axis) and sex (black ¼ females, grey ¼ males). Each dot represents the
mean performance, for a given sex, at one age or over several ages (multiple ages were grouped, as necessary, to have at least 35 values per dot). Dot size is proportional to the number of individual values that it represents. Standard deviations are represented by lines, drawn upward for females
Figure 6. Norms. Data from our large normative data set (n ¼ 1,471) are plotted. This data set is provided in its entirety, in item-by-item form, as supplementary information. X-axes for all graphs in each column are shown below C and F; Y-axes for all graphs in each column are shown beside B and E. (A – C) Overall distributions with best fitting normal curve. (D– F) Data plotted by age and sex, with females in black and males in grey. Vertical lines indicate standard deviation for each data point. For visibility, lines are plotted up for females and down for males. Each dot indicates mean performance either at a single age or over several binned ages. Ages were binned when a single age had fewer than 35 participants, starting from the age of the youngest participant (9) and working upward. Horizontal position of dot indicates the mean age in that bin. Dots are drawn with areas proportional to the number of persons for that dot. CFMT ¼ Cambridge Face Memory Test. AAMT ¼ Abstract Art Memory Test. VPMT ¼ Verbal Paired-Associates Memory Test.