https://doi.org/10.4224/20377919
READ THESE TERMS AND CONDITIONS CAREFULLY BEFORE USING THIS WEBSITE.
https://nrc-publications.canada.ca/eng/copyright
Vous avez des questions? Nous pouvons vous aider. Pour communiquer directement avec un auteur, consultez la
première page de la revue dans laquelle son article a été publié afin de trouver ses coordonnées. Si vous n’arrivez pas à les repérer, communiquez avec nous à PublicationsArchive-ArchivesPublications@nrc-cnrc.gc.ca.
Questions? Contact the NRC Publications Archive team at
PublicationsArchive-ArchivesPublications@nrc-cnrc.gc.ca. If you wish to email the authors directly, please see the first page of the publication for their contact information.
Archives des publications du CNRC
For the publisher’s version, please access the DOI link below./ Pour consulter la version de l’éditeur, utilisez le lien DOI ci-dessous.
Access and use of this website and the material on it are subject to the Terms and Conditions set forth at
Modified Air Circulation and Ventilation Practice to Achieve Energy Savings and Fuel Switching
Gusdorf, J.; Simpson, C.; Swinton, M. C.; Forrest, T.; Szadkowski, F.; Hwang, T. J.
https://publications-cnrc.canada.ca/fra/droits
L’accès à ce site Web et l’utilisation de son contenu sont assujettis aux conditions présentées dans le site LISEZ CES CONDITIONS ATTENTIVEMENT AVANT D’UTILISER CE SITE WEB.
NRC Publications Record / Notice d'Archives des publications de CNRC: https://nrc-publications.canada.ca/eng/view/object/?id=1072431d-b21e-4d66-a3b8-bb830dffeb5a https://publications-cnrc.canada.ca/fra/voir/objet/?id=1072431d-b21e-4d66-a3b8-bb830dffeb5a
Canadian
Centre
Centre
canadien
des
for Housing Technology
technologies résidentielles
Modified Air Circulation and Ventilation Practice to Achieve Energy Savings and Fuel Switching
Gusdorf, J.; Simpson, C.; Swinton, M.; Forrest, T.; Szadkowski, F.; Hwang, T.J.
NRCC-47712
The Canadian Centre for Housing Technology (CCHT)
Built in 1998, the Canadian Centre for Housing Technology (CCHT) is jointly operated by the National Research Council, Natural Resources Canada, and Canada Mortgage and Housing Corporation. CCHT's mission is to accelerate the development of new technologies and their acceptance in the marketplace.
The Canadian Centre for Housing Technology features twin research houses to evaluate the whole-house performance of new technologies in side-by-side testing. The twin houses offer an intensively monitored real-world environment with simulated occupancy to assess the performance of the residential energy technologies in secure premises. This facility was designed to provide a stepping-stone for manufacturers and developers to test innovative technologies prior to full field trials in occupied houses.
As well, CCHT has an information centre, the InfoCentre, which features a showroom, high-tech meeting room, and the CMHC award winning FlexHouse™ design, shown at CCHT as a demo home. The InfoCentre also features functioning state-of-the art equipment, and demo solar photovoltaic panels. There are over 50 meetings and tours at CCHT annually, with presentations and visits occurring with national and international visitors on a regular basis.
Modified Air Circulation and Ventilation Practice
to Achieve Energy Savings and Fuel Switching
11 January 2005
by
John Gusdorf, Natural Resources Canada Craig Simpson, Craig J. Simpson Technical Services
Mike Swinton, National Research Council Canada Tracey Forrest, The Regional Municipality of York
Frank Szadkowski, Natural Resources Canada T.J. Hwang, Enbridge Gas Distribution
Table of Contents
Executive Summary iv
Synopsis vi
1.0 Introduction 1
1.1 Ventilation, Circulation and Indoor Air Quality 2 1.2 Effects of the Programable Fan Controller on Circulation & Distribution 3
2.0 Methodology 4
2.1 Making the Houses Less Airtight 5
2.2 The Four Circulation Modes 6
2.3 Furnace Electricity & Natural Gas Use 6
2.4 Total Circulated Air Volumes 7
2.5 Temperature Differences and Circulation 7
2.6 Carbon Dioxide & Circulation 8
2.7 The CO2 Release System 11
3.0 Results 13
3.1 Effects of the Circulation Modes on Fan Operation & Circulation 13
3.2 Furnace Fan Electrical Use 23
3.3 Furnace Natural Gas 23
3.4 Temperature & Circulation 27
3.5 Problems with CO2 Release and Sensors 29
3.6 Results of CO2 Analysis 30
4.0 Modelling, Comparisons and Projections 34
4.1 Modelling Furnace Electricity 34
4.2 Modelling Furnace Gas Use 39
4.3 Modelling a Heating Season 40
4.4 Other Features of Programmable Fan Controllers 45
5.0 Summary & Conclusions 47
6.0 References 50
Appendix A: CO2 Levels 51
Appendix B: Temperature Differences 55
List of Figures
Figure 1. Bedroom and Living Room CO2 Levels. 10
Figure 2. Effects of Bedroom Door on CO2 Levels. 10
Figure 3. The CO2 Release System. 11
Figure 4. Times in Each Fan Speed, 6 May, 30/30. 17 Figure 5. Circulated Air Volumes, 6 May, 30/30. 17 Figure 6. Times in Each Fan Speed, 6 May, Control House. 18 Figure 7. Circulated Air Volumes, 6 May, Control House. 18
Figure 8. Times in Each Fan Speed, 10 April, 30/30. 19 Figure 9. Circulated Air Volumes, 10 April, 30/30. 19 Figure 10. Circulated Air Volumes, 2 May, 45/15. 21 Figure 11. Circulated Air Volumes, 5 April, 45/15. 21 Figure 12. Total Circulated Air Volumes vs. Furnace On Times, by days. 22 Figure 13. Furnace Fan Electrical Use. 22
Figure 14. Furnace Natural Gas Use. 24
Figure 15. Furnace Natural Gas Use, detail. 24 Figure 16. Furnace Natural Gas Benchmark and Results from the ECM Project. 26 Figure 17. Control House CO2 Levels, 6 May 2004. 29
Figure 18. Time in Circulation vs. Time in Heating. 36 Figure 19. Furnace Electrical Use vs. Time in Heating, from direct measurements. 36 Figure 20. General Form of Furnace Electrical Use with a Fan Controller. 38 Figure 21. Furnace Natural Gas Use, calculated from electrical savings. 38
List of Tables
Table 1. Weekly Average CO2 Levels in Living Rooms. 9 Table 2. Percentages of Time for each Circulation Mode & Fan Speed,
Experimental House. 13
Table 3. Percentages of Time for each Circulation Mode & Fan Speed,
Control House. 13
Table 4. Circulated Air Volumes (m3/day), Experimental House 14 Table 5. Circulated Air Volumes (m3/day), Control House 14 Table 6. Total Circulated Air Volumes (m3/day), and differences between means, all days. 15 Table 7. Total Circulated Air Volumes (m3/day), and differences between means,
valid CO2 days.. 16
Table 8. Furnace Electrical and Natural Gas Use 25 Table 9. Differences from Hallway Temperature. 27 Table 10. Numbers of Data Points Above 1,000 ppm in the two houses, and differences
between them. 30
Table 11. Average CO2 Levels in the Master Bedrooms, and Differences between them. 31 Table 12. Maximum CO2 Levels in the Master Bedrooms, and Differences between them,
Based on maximums of daily maximums. 31 Table 13. Maximum CO2 Levels in the Master Bedrooms, and Differences between them,
Based on averages of daily maximums. 31 Table 14. Differences between Average CO2 Levels in the Master Bedrooms and
Specified Locations. 32
Table 15. Differences between Maximum CO2 Levels in the Master Bedrooms and
Specified Locations. Based on the maximums of the daily maximums. 33 Table 16. Differences between Maximum CO2 Levels in the Master Bedrooms and
Specified Locations. Based on the averages of the daily maximums. 33 Table 17. Comparison of Modelled and Measured Furnace Electricity. 35 Table 18. Heating Season Simulation, Maximum Off Time Controller. 41 Table 19. Shoulder Season Simulation, Maximum Off Time Controller. 42 Table 20. Mid Winter Simulation, Maximum Off Time Controller. 42 Table 21. Modelled Changes in Furnace Electricity and Furnace Natural Gas Use. 43 Table 22. Heating Season Simulation, Minimum On Time Controller. 44 Table 23. Shoulder Season Simulation, Minimum On Time Controller. 44 Table 24. Mid Winter Simulation, Minimum On Time Controller. 45
Executive Summary
This project was based on recent studies at the Canadian Centre for Housing
Technology (CCHT) that demonstrated the effects of energy efficient furnace fan motors on both electricity and natural gas use. Electronically commutated motors (ECM) were shown to reduce the kWh required in moving air constantly by ~75%. This resulted in a reduction in total house electricity consumption during the heating season by ~ 25%. In other parts of the year there is a similar reduction in kWh required for constant movement of air, and a further reduction in the electricity required for cooling by ~10%. At the same time natural gas use for heating is increased by ~14% in order to maintain a proper energy balance owing to missing motor heat. The net effect is still a significant reduction in utility bills (electricity and natural gas), and there will also be a significant net reduction in greenhouse gas (GHG) emissions if the kWh are produced from fossil fuels, particularly coal.
Recognizing that the market for furnaces with ECMs is still limited, that the ECM is still a costly option, and that retrofits of ECMs are unlikely, one of the authors (Simpson) proposed that a low-cost, commercially available programmable timer device could provide much of these same benefits that energy-efficient fan motors deliver, at far reduced cost, when combined with existing furnaces equipped with conventional PSC type fan motors. This could expand the target market for achieving energy and cost savings, through this similar fuel switching mechanism, to a very significant fraction of all existing furnace installations without the homeowner having to bear the cost of a new ECM equipped furnace.
The proposed concept was tested in the twin house CCHT facility during the heating and spring shoulder seasons in a project that had many parallels to the previous ECM testing studies, except both furnaces had the standard PSC type blower motors. The experimental house had a programmable fan controller that was used to produce four furnace fan circulation modes:
• Continuous Circulation: The fan is always running, either in heating or circulation speed.
• 30/30: The fan can be off for 30 minutes, then run in circulation speed for 30 minutes or until there is a demand for heat.
• 45/15: As above, up to 45 minutes off, up to 15 min on.
• No Circulation: The fan runs only when there is a demand for heat.
Both R 2000 type houses were made artificially “more leaky” in order to simulate typical 1990s era air infiltration rates and care was also taken to simulate CO2 production and
CO2 levels were higher with non-continuous circulation modes, but in no case did they even get close to the Health Canada limits, nor were they high compared to previously observed levels in Canadian houses. It should be noted that higher CO2 levels may be associated with odours or high humidity leading to condensation or mould growth, but it should also be noted that NO forced air circulation appears to be the norm in Canadian houses and that problems of odours and mould should not necessarily be expected. If they do arise through reduced air
circulation, they can be easily dealt with by occupants by simple steps such as opening a window or two. It can also unequivocally be stated that somewhat reduced air circulation must still be better in this regard than the norm of NO circulation.
The results demonstrated very successfully that a programmable timing device on a PSC blower motor can achieve much of what an ECM motor can achieve, in terms of energy and cost savings, along with fuel switching, but at far reduced cost compared with the ECM furnace option. For the 30/30, 45/15 and no circulation modes, the observed reductions in fan electricity were 49%, 59% and 86%, respectively. Accompanying these kWh reductions were
corresponding gas use increases in the range of 11 or 12%. Owing to the short period of data collection, and possibly due to variations in temperature and other weather conditions, the relationship between electricity savings and extra gas required was not as clear as expected – but certainly there is enough strong evidence to substantiate and validate the thesis upon which this project had been based. Modelling results for a complete heating season were reasonably consistent with the above. For the 30/30, 45/15 and no circulation modes, the modelled kWh reductions were 49%, 65% and 75%, respectively. The corresponding modelled seasonal increases in gas use were 7.6%, 10.1% and 11.6%, respectively.
The available evidence is that most houses operate in no circulation mode. For any of these households that would like to have better air circulation, a programmable fan controller can be recommended without reservation. The controller will provide better circulation, use more electricity and save some natural gas. The net effect will be a slight increase in total utility bills because electricity is more expensive than gas on an energy content basis.
For those households that currently use continuous circulation and would like to save electricity while still providing some circulation, installation of a fan controller can also be recommended . This recommendation should also be accompanied by some basic information on any potential RH and mould problems, and how to easily deal with them. The controller will provide reduced circulation with the reduction being tailored to suit. The furnace will use less electricity and more gas, still resulting in a net decrease in utility bills.
Thus, programmable fan controllers are an inexpensive, practical way of providing variable amounts of air circulation to houses built since about 1990 that have conventional PSC fan motors. The same can also be stated for houses built to construction practices before 1990, which were commonly less airtight.
Synopsis
Introduction
This project is based on recent studies (Reference 1 in main report) at the Canadian Centre for Housing Technology (CCHT) that demonstrated the effects of energy efficient furnace fan motors on both electricity and natural gas use. Electronically commutated motors (ECM) were shown to reduce total house electrical consumption by 25% during the heating season, and to reduce electricity for cooling by 10%. During heating, extra natural gas was consumed to balance the reduced heat from the furnace fan motor. The net effect is a significant reduction in utility bills (electricity and natural gas). If the saved electricity is from coal-fired plants, then there is a significant net reduction in greenhouse gas (GHG) emissions.
However, ECMs and similar motors are only practical in new furnaces. Retrofitting existing furnaces with a new motor involves significant labour, and raises warranty and liability issues. For this reason, one of the authors (Simpson) suggested that a low-cost, commercially-available device could provide much of these same benefits that energy-efficient fan motors deliver, at far reduced cost, when combined with existing furnaces equipped with conventional PSC type fan motors. These programmable fan controllers cause the furnace fan to run in circulation speed after it has been off for a user specified time, and then keep it in circulation speed for a specified time or until there is another call for heating or cooling.
To test the effects of the programmable fan controller, one of the two identical CCHT houses was designated as the control house, and its furnace fan ran continuously throughout the tests. The other – the experimental house – used the fan controller to operate in four different circulation modes.
Enbridge Gas Distribution and The Regional Municipality of York are interested in the possible application of fan controllers to houses built in the 1990s. These houses tend to be reasonably airtight, and therefore can benefit from increased air circulation, although they may not require continuous circulation. Their airtightness, as measured by a blower door test, is generally around 3.5 air changes at 50 Pascals of depressurization (3.5 ach@50Pa). The CCHT houses are R-2000 houses and are significantly more airtight – around 1.1 ach@50Pa. For this reason, the CCHT houses were loosened by opening their windows slightly, thus bringing them to 3.5 ach@50Pa.
Ventilation can be defined as the movement of air into and out of a building. In ventilation, fresh air from outside the building replaces inside air, thus removing contaminants generated inside the building such as excess humidity and carbon dioxide, formaldehyde and other volatile organic compounds. Ventilation can be due to natural infiltration, which depends on the
indoors and outdoors, and the wind speed. Ventilation can also be due to mechanical ventilation by exhaust fans such as bathroom fans and stove hoods, and by heat recovery ventilators (HRVs) that provide balanced exhaust and fresh air streams. In this project, ventilation is almost entirely due to natural infiltration (which was deliberately increased by the slightly opened or “leaking” windows).
Circulation can be defined as the movement of air within a building. For the purposes of this project it is the movement of air caused by the furnace fan. Circulation does not remove contaminants from a building, but it can prevent excessive local concentrations by distributing the contaminants more evenly throughout the building. Thus, ventilation is required for good indoor air quality since it removes contaminants from a building, and circulation is required to distribute fresh air throughout the building, reducing local concentrations. This project
investigates the effects of four circulation modes on temperature differences and the concentration and distribution of carbon dioxide, as indicators of air circulation.
The programable fan controller sets the maximum amount of time that the furnace fan will be off each hour. For example, one of the settings, or modes, used in this project was 30 minutes off and 30 minutes on. If the thermostat causes the furnace to run at least once every 30
minutes, then the fan controller has no effect. But if the thermostat does not cause the furnace to run for 30 consecutive minutes, then the controller will cause the furnace fan to run for up to 30 minutes, or until the thermostat calls for heat again. When the thermostat causes the furnace to run, the furnace fan runs in heating speed, moving approximately 658 litres per second (L/s) of air through the ducts. When the controller causes the fan to run, it runs in circulation speed, moving approximately 486 L/s.
How much effect, if any, the fan controller will have on circulation during any hour or day depends on the off and on times it is programmed for, and the amount of time that the thermostat keeps the furnace running. When there is a high demand for heat, then the controller may have little to no effect, especially if it is set to a long maximum off time, such as 45 minutes.
Poor indoor air quality in reasonably airtight houses is mainly a concern during the “shoulder seasons” (and during the summer if windows are kept closed). During cold weather, the temperature differences between the inside and outside of a house are generally enough to ensure good ventilation, and the furnace will run often enough to provide good circulation. But during the spring and fall, when windows are closed and the furnace runs only occasionally, inadequate ventilation and circulation can be a problem. Because the effects a programmable fan controller depend on the length of time the furnace (or air conditioner) is off, they will be greatest during the shoulder seasons – precisely when more circulation may be needed.
Methodology
The general methodology of this project was:
• Open windows in both houses to bring their airtightness levels as close as possible to 3.5 air changes per hour at 50 Pascals of depressurization.
• Use the thermostat and programmable fan controller to produce four circulation modes in the experimental house while keeping the circulation mode in the control house constant.
• Release equal amounts of carbon dioxide (CO2) – representative of the CO2 released by four people – in both houses.
• Measure electricity and natural gas use by the furnaces, the amount of time the
furnace fan spends in heating and circulation speed and the airflow rate in each speed, CO2 levels at three points, and temperatures at various points in both houses.
• Analyse the effects of the four circulation modes in terms of differences between the control and experimental houses. The differences to be analysed are:
< Electricity use by the furnace. < Natural gas use by the furnace. < Daily circulated air volumes.
< Temperatures and temperature differences. < Carbon dioxide levels.
The four circulation modes are:
• Continuous circulation. The furnace fan runs in circulation (reduced) speed whenever there is no demand for heat. Thus, the fan is always running, either in heating or circulation speed.
• 30 minutes off / 30 minutes on (30/30). The furnace fan can be off for 30 consecutive minutes, then it is run in circulation speed for 30 minutes or until there is a demand for heat.
• 45 minutes off / 15 minutes on (45/15). The furnace fan can be off for 45 consecutive minutes, then it is run in circulation speed for 15 minutes or until there is a demand for heat.
• No circulation. The furnace fan runs only when there is a demand for heat.
The particular times of the 30/30 and 45/15 modes were more or less arbitrarily selected as reasonable periods for testing. The hypothesis to be tested was that the effects of circulation modes (electricity and gas use, temperatures and CO2) should be larger for circulation modes with longer maximum off-times. That is, the effects should increase in the following order:
1. Continuous Circulation (base case, no differences expected), 2. 30/30,
3. 45/15, and 4. No Circulation.
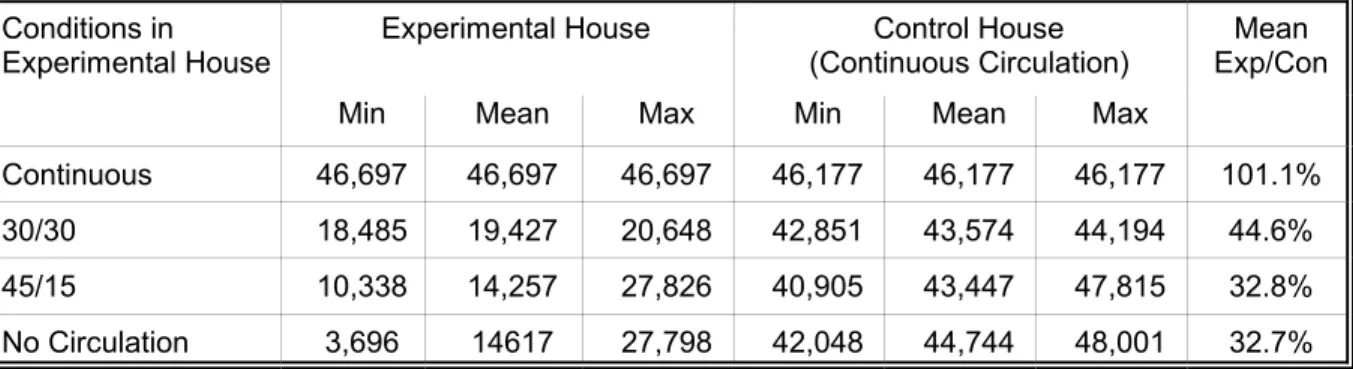
Table S-1 compares the total circulated air volumes for the two houses. (The total volume includes air circulated in both circulation and heating speed). There are significant differences in the experimental house, but they are not exactly in the expected order because the mean for no circulation mode is slightly larger than the mean for 45/15. This is due to the fact that the amount of time spent in heating speed happened to be significantly larger for the no circulation mode. Also, the difference between the these two modes and the 30/30 mode is relatively small because the amount of time spend in heating speed in the 30/30 mode was even smaller.
Condition in
Experimental House
Experimental House Control House (Continuous Circulation)
Mean Exp/Con
Min Mean Max Min Mean Max
Continuous 46,697 46,697 46,697 46,177 46,177 46,177 101.1% 30/30 18,485 19,427 20,648 42,851 43,574 44,194 44.6% 45/15 10,338 14,257 27,826 40,905 43,447 47,815 32.8% No Circulation 3,696 14617 27,798 42,048 44,744 48,001 32.7%
Table S-1. Total Circulated Air Volumes (m3/day), and differences between means.
As stated above, the original hypothesis to be tested was that, for each criteria, the effect on circulation would get larger for circulation modes with longer maximum off-times. The original hypothesis should hold when all four circulation modes are tested under the same conditions, i.e., with the same numbers of heating hours, and the same volumes of circulated air. However, given the actual conditions shown in Table S-1, one can define a second hypothesis, that there should be a large difference between continuous circulation and 30/30, and smaller difference between
Control Experiment Difference Furnace Electricity (kWh/day)
Benchmark 9.98 9.87 0.11 (1%)
30/30 in Exp 9.41 4.78 4.63 (49%) 45/15 in Exp 9.72 4.03 5.69 (59%) No circulation in Exp 8.81 1.24 7.57 (86%) Furnace Natural Gas (MJ/day)
Benchmark 292.4 307.9 -15.5 (-5%) 30/30 in Exp 192.1 220.8 -28.7 (-15%) 45/15 in Exp 264 316 -52.0 (-20%) No Circulation in Exp 326.3 373.5 -47.2 (-14%)
Table S-2. Furnace Electrical and Natural Gas Use.
30/30 and the last two modes, and little or no difference between the 45/15 and no circulation modes. Whether a given criteria should conform better to the original or second hypothesis should depend on whether it is more sensitive to minimum or average volumes of circulated air.
Results
As shown in Table S-2, the effects of the controller on electricity consumption were
significant, and in agreement with the original hypothesis. The furnace fan motors produce heat, and the less one of them operates, the less heat it produces, and the more natural gas should be needed to heat its house. Thus, circulation modes with longer maximum off-times should use more gas, and this can also be seen in Table S-2. Although the order and amounts of extra gas use were not exactly as expected, the differences between continuous circulation and the other modes are clear. The differences between the other modes were not as distinct for several reasons (which will be discussed later). Nevertheless, it is clear that the use of a fan controller will affect furnace gas consumption. Compared with continuous circulation, the controller will increase the use of gas, while compared with no circulation, it will decrease it. The specific controller mode selected will have a smaller effect on gas consumption. (Note: Although this project did not examine impacts during the cooling season, it can be surmised that less use of the fan motor will also reduce electrical use by air conditioners).
A model was used to project the effects of a controller for an entire heating season, and for a shoulder season and mid-winter. Although approximate, the model indicates that changing from continuous circulation to 30/30 could save an annual 1,117 kWh, or 49% of the electricity used by the furnace, while increasing furnace natural gas use by 130 m3, or 7.6%. A change from continuous circulation could save around 1,488 kWh, or 65%, while using an additional 173 m3, or 10.1%.
Temperatures and carbon dioxide levels in the houses were analysed for indications of inadequate circulation in any of the modes. The analysis of temperatures showed no such indications in any mode. CO2 was released at four points in the houses at a total rate of four people at rest. CO2 levels were recorded at three places, and the levels and differences between them were analysed for signs of inadequate circulation. As shown in Tables S-3 & S-4,
compared with continuous circulation, the maximum CO2 levels with the fan controller were higher, and they exceeded the ASHRAE guideline of 1,000 ppm more often. However, they never exceeded (or got close to) the Health Canada limit of 3,500 ppm at which human health may be affected, and they are not high compared to levels previously observed in a variety of Canadian houses. The observed levels may be associated with odours, or with high levels of humidity that could cause condensation or mould growth. But those conditions are easily observed and dealt with by occupants.
Condition in # of Data Points > 1000 ppm Difference Experimental House* Data Experiment Control
Points # % # % # %
Continuous Circulation 288 0 0.0% 0 0.0% 0 0.0%
30/30 2016 226 11.2% 179 8.9% 47 26.3%
45/15 2868 1557 54.3% 405 14.1% 1152 284%
No Circulation 2880 666 23.1% 238 8.3% 428 180%
Table S-3. Numbers of Data Points Above 1,000 ppm in the two houses, and differences between them.
Condition in n Maximum (ppm) Difference Experimental House* Experiment Control ppm % Continuous Circulation 1 972 922 50 5.4%
30/30 7 1450 1312 138 10.5%
45/15 10 1634 1456 178 12.2%
No Circulation 10 1662 1268 394 31.1%
Table S-4. Maximum CO2 Levels in the Master Bedrooms, and Differences between them. * Continuous circulation at all times in Control House.
For households that now operate in no circulation mode and would like to have better circulation, a programmable fan controller can be recommended without reservation. The
controller will provide better circulation, use more electricity and save some natural gas. The net effect will be a slight increase in total utility bills because electricity is more expensive than gas on an energy content basis. The available evidence is that most houses operate in no circulation mode. For households that currently use continuous circulation and would like to save electricity while still providing some circulation, installation of a fan controller could be accompanied by some basic information on potential RH and mould problems, and how to deal with them. The controller will provide more even circulation, and will use less electricity and more gas, resulting in a net decrease in utility bills.
Thus, programable fan controllers are an inexpensive, practical way of providing variable amounts of air circulation to houses built since about 1990 that have conventional PSC fan motors.
1.0 Introduction
Recent projects at the Canadian Centre for Housing Technology (CCHT) demonstrated the effects of energy efficient furnace fan motors.1 Electronically commutated motors (ECM) were shown to reduce total house electrical consumption by 25% during the heating season, and to reduce electricity for cooling by 10%, when used with continuous circulation. During heating, extra natural gas was consumed to balance the reduced heat from the furnace fan motor. The net effect is a significant reduction in utility bills (electricity and natural gas). If the saved electricity is from coal-fired plants, then there is a significant net reduction in greenhouse gas (GHG) emissions. Similar potential benefits of ECMs have been shown by other studies2,3. Enbridge Gas Distribution (EGD), an Ontario natural gas utility which was a sponsor of the CCHT projects, now has a successful program to promote the installation of furnaces with ECM fan motors.4
ECMs provide the most significant benefits in newer, relatively airtight houses in which the furnace fan should be run continuously to provide ventilation and circulation of air throughout the house. In continuous circulation, the furnace fan continues to run – usually at its lowest speed – even when the furnace or air conditioner is off. When normal (permanently split
capacitor or PSC) fan motors are run continuously, they use large amounts of electricity, even at lower speeds. ECMs maintain their higher efficiencies at lower speeds, thus providing free continuous circulation in comparison with a PSC motor that operates only during demands for heating or cooling (Ref. 1, pp. 46-47).
However, ECMs and similar motors are only a practical option in new furnaces.
Retrofitting existing furnaces with a new motor involves significant labour, and raises warranty and liability issues. For this reason, one of the authors (Simpson) suggested that a low-cost, commercially-available device could provide at least some of the benefits of energy-efficient fan motors with existing furnaces. These programmable fan controllers cause the furnace fan to run in circulation speed after it has been off for a user specified time, and then keep it in circulation speed for a specified time or until there is another call for heating or cooling.
To test the effects of the programmable fan controller, one of the two identical CCHT houses was designated as the control house, and was run in continuous circulation throughout the tests. The other – the experimental house – was operated in four different circulation modes. In both houses, the furnaces had conventional PSC motors. The first experimental house mode was continuous circulation. That is, both houses were operated identically to establish a benchmark. The second and third mode used the fan controller to run the fan in circulation speed in two different ways. The fourth mode was no circulation, in which the fan ran only when there was a demand for heat, and was used as an extreme case for comparison.
Enbridge Gas Distribution and The Regional Municipality of York are interested in the possible application of fan controllers to houses built in the 1990s. These houses tend to be reasonably airtight, and therefore can benefit from increased air circulation, although they may not require continuous circulation. Their airtightness, as measured by a blower door test, is generally around 3.5 air changes at 50 Pascals of depressurization (3.5 ach@50Pa).5 The CCHT houses are R-2000 houses and are significantly more airtight – around 1.1 ach@50Pa. For this reason, the CCHT houses were loosened by opening their windows slightly, thus bringing them to 3.5 ach@50Pa.
The CCHT’s data collection system records the amounts of electricity and natural gas used by the furnaces every five minutes. Daily totals were used to determine any differences due to circulation modes. In order to measure the effects of the fan controller on air circulation within the houses, carbon dioxide was released and measured within them. CO2 was released at three points in each house, at a total rate equivalent to four people at rest. The levels of CO2 were monitored at three points in each house, and the levels and differences between them were analysed to determine differences in circulation due to the circulation modes. Inadequate circulation can result in some parts of a house being slightly warmer or cooler than others, so temperatures at several points in each house were measured and analysed to see if they varied by circulation mode. To provide a basis for comparison, Section 2.6 includes a review of
previously collected data on CO2 levels in occupied Canadian houses.
1.1 Ventilation, Circulation and Indoor Air Quality
Ventilation can be defined as the movement of air into and out of a building. In ventilation, fresh air from outside the building replaces inside air, thus removing contaminants generated inside the building such as excess humidity and carbon dioxide, formaldehyde and other volatile organic compounds. Ventilation can be due to natural infiltration, which depends on the
airtightness of the building (and whether windows are open), the temperature difference between indoors and outdoors, and the wind speed and direction. Ventilation can also be increased by mechanical means through the use of exhaust fans such as bathroom fans and exhausting stove hoods, and by heat recovery ventilators (HRVs) that provide balanced exhaust and fresh air streams. In this project, ventilation is almost entirely due to natural infiltration since the HRVs were turned off and sealed. A small amount of mechanical ventilation was provide by the venting stove hoods which were run three times each day for a total of 28.8 minutes. As mentioned, the windows were opened to provide rates of natural infiltration closer to those of typical 1990s Canadian houses.
Circulation can be defined as the movement of air within a building. For the purposes of this project it is the movement of air caused by the furnace fan. Circulation does not remove contaminants from a building (unless specific filter/absorbents are used), but it can prevent excessive local concentrations by distributing the contaminants more evenly throughout the
building. Thus, ventilation is required for good indoor air quality since it removes contaminants from a building, and circulation is required to distribute fresh air throughout the building,
reducing local concentrations. This project investigates the effects of four circulation modes on temperature differences and the concentration and distribution of CO2, as indicators of air circulation.
1.2 Effects of the Programable Fan Controller on Circulation & Distribution
The programable fan controller sets the maximum amount of time that the furnace fan will be off each hour. For example, one of the settings, or modes, used in this project was 30 minutes off and 30 minutes on. If the thermostat causes the furnace to run at least once every 30
minutes, then the fan controller has no effect. But if the thermostat does not cause the furnace to run for 30 consecutive minutes, then the controller will cause the furnace fan to run for up to 30 minutes, or until the thermostat calls for heat again. When the thermostat causes the furnace to run, the furnace fan runs in heating speed, moving approximately 658 litres per second (L/s) of air through the ducts. When the controller causes the fan to run, it runs in circulation speed, moving approximately 486 L/s.
How much effect, if any, the fan controller will have on circulation during any hour or day depends on the off and on times it is programmed for, and the amount of time that the thermostat keeps the furnace running. When there is a high demand for heat, then the controller may have no effect, especially if it is set to a long maximum off time, such as 45 minutes.
The effects of ventilation and circulation can be separated to some extent by keeping the circulation mode in the control house constant while using the programable fan controller to vary it in the experimental house. Thus, levels of CO2, and differences between CO2 levels and temperatures, in both houses will vary from day to day depending on ventilation rates. But the differences between the houses should depend largely on the circulation mode in the
experimental house. However, ventilation due to wind may vary between the houses due to wind direction, and the shading of one house by the other, so one would not expect the relationship between circulation mode and circulation effects to be close to perfect.
Poor indoor air quality in reasonably airtight houses is mainly a concern during the “shoulder seasons” (and during the summer if windows are kept closed). During cold weather, the temperature differences between the inside and outside of a house are generally enough to ensure good ventilation, and the furnace will run often enough to provide good circulation. But during the spring and fall, when windows are closed and the furnace runs only occasionally, inadequate ventilation and circulation can be a problem. Because the effects a programmable fan controller depend on the length of time the furnace (or air conditioner) is off, they will be greatest during the shoulder seasons – precisely when more circulation may be needed.
*
Furnace electricity includes that used by the furnace fan and the controls. The later use about 10 W, which is small compared to the 640 W and 340 W that the fan uses in heating and circulation speeds.
2.0 Methodology
One of the two identical CCHT houses was defined as the control house, and the other was defined as the experimental house. The general methodology of this project consists of the following:
• Open windows in both houses, and do blower door tests, to bring their airtightness levels as close as possible to 3.5 air changes per hour at 50 Pascals of
depressurization, to match houses built in the 1990s.
• Use the thermostat and programmable fan controller to produce four circulation modes in the experimental house while keeping the circulation mode in the control house constant.
• Release equal amounts of carbon dioxide (CO2) in both houses at a rate representative of four people.
• Measure electricity and natural gas use by the furnaces,* the amount of time the furnace fan spends in heating and circulation speed and the airflow rate in each speed, CO2 levels at three points, and temperatures at various points in both houses.
• Analyse the effects of the four circulation modes in terms of differences between the control and experimental houses. The differences to be analysed are:
< Electricity use by the furnace: The less time the furnace fan runs, the less energy should be used by the furnace.
< Natural gas use by the furnace: As the furnace fan uses less electricity, and therefore puts less heat into the air, more natural gas should be needed to maintain the house at its temperature set point.
< Daily circulated air volumes: The amounts of time that the furnace fans spend in heating and circulation speed, and the airflow rate for each speed are used to determine the total volume of air circulated through the furnace of each house each day. These are combined to get minimum, mean and maximum volumes for each circulation mode.
< Temperatures: If a given circulation mode causes the furnace fan to run for a smaller amount of time, then it is possible that some points in the house will become warmer or cooler than others. These differences would be due to local solar or internal gains that are not distributed to the rest of the house, or due to local heat losses that are not evened out. This is the first method for evaluating the circulation and distribution effects of the circulation modes.
< Carbon dioxide levels: If a given circulation mode causes the furnace fan to run for a smaller amount of time, then it is possible that CO2 levels will be higher in the places where it is released, and that the differences between these places and others will be greater. This is the second method for evaluating the circulation and distribution effects of the circulation modes.
Each of these points is described in detail below.
2.1 Making the Houses Less Airtight
In order to make the airtightness of the R-2000 CCHT houses closer to the average for 1990s houses, the windows throughout the house, the attic hatch, and two ducts in the basement were opened. After some consultation6 and experimentation, the following procedure was adapted. All of the main floor and second floor windows were opened except the ones in the master bedrooms (2nd floor) where half the carbon dioxide was released. (The master bedrooms have ensuite baths in which the windows were opened). Each window was opened, its latch was returned to the closed position, and the window was closed until it rested against the latch. This provided a quick, repeatable way of opening them by the same amount, approximately 2 cm. Five windows on the second floor and three on the ground floor were opened in this way. One side of the attic hatch was propped open using a spacer about 1 cm thick. Two slider windows in each basement were opened by 1 and 1.25 cm, and two 5 cm ducts in each basement were opened using guillotine valves. Two blower door tests were done on each house, and the average results are 3.54 air changes per hour at 50 Pascals of depressurization for the control houses, and 3.50 ach@50Pa for the experimental house.
2.2 The Four Circulation Modes
The programable fan controller and house thermostats were used to create four different circulation modes in the experimental house. These are:
• Continuous circulation. In this mode, the fan controller is turned off, and the thermostat fan switch is set to “On.” The furnace fan runs in circulation speed whenever there is no demand for heat. Thus, the fan is always running, either in heating or circulation speed. The control house was run in this mode throughout the project, while the experimental house was run in all four modes on different days. • 30 minutes off / 30 minutes on (30/30). The controller is programmed to allow the
furnace fan to be off for 30 consecutive minutes, then to be run in circulation speed for 30 minutes or until there is a demand for heat.
• 45 minutes off / 15 minutes on (45/15). The controller is programmed to allow the furnace fan to be off for 45 consecutive minutes, then to be run in circulation speed for 15 minutes or until there is a demand for heat.
• No circulation. The controller is turned off, and the thermostat fan switch is set to “Auto.” The furnace fan runs only when there is a demand for heat.
The particular times of the 30/30 and 45/15 modes were more or less arbitrarily selected as reasonable periods for testing. The experimental house was run for ten calendar days in each mode. These days were not consecutive, but were divided into two periods for each mode, between which the house was run in the other modes, and another project was run, in order to provide the greatest variation in weather and heating requirements for each mode. The actual days that the experimental house was in each mode are:
• Continuous Circulation: 9 - 14 March, 17 March, and 9 - 11 May, • 30/30: 8 - 12 April, and 4 - 8 May,
• 45/15: 31 March - 5 April, and 4 - 8 May, and • No Circulation: 18 - 22 March, and 25 - 29 April.
2.3 Furnace Electricity & Natural Gas Use
The electricity used by the furnace in each house is measured by a pulse-generating kiloWatt-hour (kWh) meter, and is recorded by the CCHT data logging system at five-minute
intervals. Results for each day of testing in each circulation mode were analysed by graphing the values for the control house on the X-axis against those for the experimental house on the Y-axis. Each circulation mode is graphed as a separate series, and the differences between them are determined visually and by regressions. Natural gas use by each furnace is measured by a pulse-generating gas meter, and recorded and analysed in the same way as electricity use.
2.4 Total Circulated Air Volumes
The airflows through the furnace in each house in both heating and circulation speed were measured in one-time tests. Each test consisted of using a mass-flow meter to measure the air flow at nine equal-area points in the supply duct. Ten measurements were made at each point and averaged. The amount of time that each furnace spends in heating speed is directly recorded by a Campbell Scientific data logger that also records the average wattage of the furnace fan motor. Both of these points are measured at ten second intervals and recorded every five minutes. For each five-minute period, the motor wattage was used to allocate the time that was not spent in heating speed between circulation speed and off.
The percentage of time that the furnace fan spends in each speed is one measure of the effects of each of the circulation modes. The time spent in each speed each day was multiplied by the airflow rate for that speed to get the total volume of air circulated by the furnace fan each day. The minimum, mean and maximum volumes for each circulation mode are another measure of their effects.
2.5 Temperature Differences and Circulation
Hourly average temperatures are recorded by the CCHT data logging system. Temperatures at ten locations (five upstairs, four on the main floor, and one in the basement) in both houses are analysed as follows:
• Inter-house temperature differences: For each of the ten temperature points, 1) the difference between the experimental house and the control house is calculated for each hour, and 2) the minimum, mean and maximum differences for each day are determined. Minimum, mean and maximums of these results are then calculated for each of the circulation modes, and compared. These inter-house temperature
differences can be taken as an indicator of the amount and adequacy of circulation in each mode, with larger differences indicating less circulation, and significant
differences indicating possibly inadequate circulation.
• Temperature deviations: The differences between inter-house temperature differences during benchmarking (both houses in continuous circulation mode) and during other modes can also be used as an indicator of circulation.
• Differences from temperature at thermostat location: One of the main floor temperature points, the hallway, is next to the house thermostat, and therefore maintains a more constant temperature than the others. The differences between this point and the others is also used as a indicator of circulation. For a given point, the difference between it and the hallway in the control house is subtracted from the same difference in the experimental house. In other words, the criteria is, how much bigger is this difference in the experimental house?
For all three methods of analysis, the hypothesis to be tested was that the effect should be larger for circulation modes with longer maximum off-times. That is, effects should increase in the following order:
1. Continuous Circulation (base case, no effect expected), 2. 30/30,
3. 45/15, and 4. No Circulation.
Daily values were analysed by circulation mode.
2.6 Carbon Dioxide & Circulation
Half of the CO2 release occurred in the master bedroom, which was the only room in which the window was not opened. Thus, the highest CO2 levels were expected to be in the master bedroom, and CO2 was measured there. One thousand parts per million (1000 ppm) of CO2 is an ASHRAE guideline which is often used as the level at which criteria for comfort (odour) is likely to be met,7 although levels below 3,500 ppm are not believed to pose any health risk to humans.8 Thus, circulation modes that often result in master bedroom CO2 levels above 1,000 ppm can be considered to provide less than adequate circulation. This is the first CO2 criterion for evaluating changes in circulation.
If some circulation modes produced significantly less circulation than others, these differences should be reflected in differences in the average and maximum CO2 levels in the master bedroom. Of course, CO2 levels varied constantly, so it is the differences between these levels in the experimental and control houses that can be used to compare and evaluate the circulation modes. If the differences between master bedroom CO2 levels are larger during a particular circulation mode than they are during other modes, then that mode is providing less circulation. This is the second CO2 criterion for evaluating changes in circulation.
CO2 was also measured in two locations in which it was not released - the living room and the furnace return duct. Since CO2 above ambient levels reaches these locations by circulation from its release points, less circulation should mean a larger difference between the CO2 levels in
the master bedroom and CO2 levels at these locations. Thus, if the differences between locations are larger during a particular circulation mode than they are during other modes, then that mode is providing less circulation. This is the third CO2 criterion for evaluating changes in
circulation. As with temperature differences (above), the hypothesis to be tested was that the effect should be larger for circulation modes with longer maximum off-times.
CO2 Levels in Canadian Houses
While the ASHRAE guideline of 1,000 ppm is a generally accepted target for maximum CO2 levels, it may also be useful to look at some levels that have been observed in occupied Canadian houses. Table 1 is a summary of data collected in audits of houses done for Natural Resources Canada, and from two Canada Mortgage and Housing studies.9,10 These are average levels recorded in living rooms over periods of a week or more. They show that weekly averages above 1,000 ppm are fairly common. This implies that peaks above 1,000 ppm are even more common. Figures 1 & 2 show levels of CO2 recorded every few minutes in master bedrooms and in family or living rooms. Figure 1 from reference 9 shows what may be an extreme case. This is an electrically heated house which is fairly airtight (2.28 ach@50Pa) with no ventilation system, and in which the master bedroom door is closed at night. In the master bedroom
(chambre maîtres), CO2 levels of over 3,000 ppm were recorded every night, and the highest level is over 4,000 ppm, while those in the living room (salon) are often above 1,000 ppm, especially after the bedroom door is opened in the morning. Figure 2 from reference 10 shows the effect of keeping the bedroom door open or closed. (During this project, all interior doors in the CCHT houses were open). Appendix A shows other examples of CO2 levels recorded in bedrooms and living rooms.
The CO2 data presented here indicate that while the ASHRAE guideline of 1,000 ppm may be a desirable target, it is often exceeded in actual houses without apparent harm or discomfort to the occupants. If CO2 levels become extreme, they may be accompanied by odours, or by high
Houses All Conventional R-2000 Number of Houses 64 52 12 CO2 Levels (ppm) Minimum 392 394 392 Average 794 823 669 Maximum 1507 1507 1009 Number with average > 1,000 ppm 10 9 1
Figure 2. Effects of Bedroom Door on CO2 Levels. Figure 1. Bedroom and Living Room CO2 Levels.
Figure 3. The CO2 Release System.
humidity causing condensation or mould growth. These harmful conditions are easily detected by occupants, and can be dealt with by decreasing the sources of humidity or by increased ventilation. Ventilation can be increased by using bathroom or kitchen fans to get rid of excess humidity, or by opening windows occasionally.
2.7 The CO
2Release System
The carbon dioxide release system is shown in Figure 3, and consists of the following: • A cylinder containing 50 pounds (22.68 kg) of CO2 under about 900 pounds per
square inch (6,201 kPa) of pressure,
• A flow meter attached to the pressure regulator by a short plastic tube, • A manifold attached to the flowmeter by another plastic tube, and
• Four equal length plastic tubes that carry the CO2 to its release points in the house.
The valve on the cylinder is used to turn the flow of CO2 on and off. The right hand gauge on the regulator reads the tank pressure, indicating when the tank must be changed. The large knob on the regulator is used to set the outlet pressure, as shown by the left hand gauge, to 20 psi (138 kPa). The knob at the bottom of the flowmeter is used to set the rate at which CO2 is released. The manifold has eight outlets, four of which are unused and blocked. The other four release the gas through the four equal length tubes.
The CO2 release rate was set to simulate the amount produced by four people at rest. Each person produces approximately 0.31 litres per second (L/s) of CO2 (Ref 7), so the total release rate for each house was set at 1.24 L/s. Half of this was released by two of the equal length tubes in the master bedroom located upstairs. 25% was released in the bedroom in the northwest upstairs corner, and the remaining 25% was released in the dining room in the northwest corner of the ground floor. 1.24 L/s is 1.786 m3/day, and the 22.68 kg in each cylinder is 12.39 m3, so each cylinder had enough CO2 to last 6.9 days. Assuming each tank would actually last for six days, the 36 days of testing in each house would require six tanks, so twelve tanks were ordered.
3.0 Results
3.1 Effects of the Circulation Modes on Fan Operation & Circulation
The amount of time that the furnace fans spent each day in heating speed, circulation speed and off was determined from the data collected by the Campbell Scientific dataloggers. Time in heating speed was measured directly by recording the status of a relay at ten second intervals. These intervals were summed and saved every five minutes. The non-heating-speed time for each five-minute interval was allocated between circulation speed and off based on the average fan motor wattage for the period. The results for the experimental house are shown in Table 2. The percentage of time that the furnace fan spends in heating speed depends entirely on the demand for space heat, and shows no systematic variation with circulation mode, as would be expected. The percentage of time in circulation mode should decrease with the circulation modes in the order shown, and this is the case. Similarly, the percentage of time off should increase in the same order, which it does.
Circulation Heating Speed Circulation Speed Off
Mode Min Mean Max Min Mean Max Min Mean Max
Continuous 1.7% 21.4% 44.8% 55.7% 78.0% 95.5% -0.5% 0.6% 2.8% 30/30 5.7% 15.5% 23.5% 12.2% 26.5% 43.1% 49.4% 57.9% 64.3% 45/15 0.0% 17.7% 48.9% 0.0% 9.9% 24.8% 51.1% 72.3% 76.7% No Circulation 6.5% 25.7% 48.9% 0.0% 0.1% 0.2% 51.1% 74.3% 93.5%
Table 2. Percentages of Time for each Circulation Mode & Fan Speed, Experimental House.
Circulation in Heating Speed Circulation Speed Off
Exp. House* Min Mean Max Min Mean Max Min Mean Max
Continuous 2.1% 20.3% 40.6% 58.9% 78.6% 95.5% 0.5% 1.2% 2.5% 30/30 4.8% 13.6% 19.4% 78.6% 84.6% 93.6% 1.4% 1.8% 2.2% 45/15 0.0% 14.9% 42.6% 56.2% 83.3% 98.0% 1.2% 1.8% 2.6% No Circulation 6.1% 22.5% 42.4% 56.9% 76.1% 91.9% 0.7% 1.4% 2.1%
Table 3. Percentages of Time for each Circulation Mode & Fan Speed, Control House. * Continuous circulation at all times in Control House.
Two of the 45/15 mode days (30 April & 1May) had no demand for space heat, thus
producing the minimum of zero percent of time in heating speed. One of the 45/15 mode days (5 April) had enough space heat demand that no time was spent in circulation mode. During
continuous circulation, the fan should never be off, and during no circulation it should never be in circulation speed; the values for those combinations –including the negative numbers – in Table 2 (together with some for the control house discussed below) show the accuracy of the method for determining the times the fan spends in circulation speed and off.
Table 3 shows the percentages of time spent in each fan speed in the control house. Since the control house was in continuous circulation mode throughout the project, there is no
systematic variation according to mode. (The circulation modes in the first column show that the data is divided according to the modes in the experimental house). However, the differences between the mean percentages of time spent in heating speed in the two houses does increase with circulation mode in the order shown. For continuous circulation, the experimental house spent 21.4% of the time in heating speed, while the control spent 20.3% for a difference of 1.1%. For 30/30, 45/15 and no circulation, the differences are 1.9%, 2.8% and 3.2% respectively. This is consistent with the increase in natural gas use due to less furnace fan operation (and less fan heat) discussed in Section 3.3. For the control house, all fan off times should be zero, so the values in Table 3 (along with those for the experimental house mentioned above) show that the method of determining circulation and off times is accurate to within 2% on average, and has a maximum error of less than 3%.
Circulation Mode
Circulation Speed Heating Speed Total
Min Mean Max Min Mean Max Min Mean Max
Continuous 23,382 32,773 40,091 987 12,141 25,484 41,078 44,913 48,867 30/30 5,121 11,135 18,116 3,224 8,838 13,364 18,485 19,973 22,774 45/15 -1 4,168 10,413 0 10,088 27,827 10,338 14,257 27,826 No Circ -3 29 103 3,672 14,589 14,589 3,696 14,617 27,798
Table 4. Circulated Air Volumes (m3/day), Experimental House.
Circulation in Exp. House*
Circulation Speed Heating Speed Total
Min Mean Max Min Mean Max Min Mean Max
Continuous 24,725 32,985 40,084 1,204 11,531 23,096 41,243 44,517 47,821 30/30 33,004 35,542 39,293 2,757 7,728 11,035 42,050 43,269 44,194 45/15 23,614 34,994 41,154 0 8,453 24,201 40,905 43,447 47,815 No Circ 23,899 31,945 38,600 3,448 12,799 12,799 42,048 44,744 48,001
Table 5. Circulated Air Volumes (m3/day), Control House. * Continuous circulation at all times in Control House.
Given the daily amounts of time the furnace fan spent in heating and circulation speed, and the airflows for each speed, one can calculate the amounts of air circulated through each house
each day. The results are analysed by circulation mode, and shown in Table 4 for the experimental house, and Table 5 for the control house. The experimental house shows the expected decreases by mode in circulation speed. (Negative values, and non-zero values in the last row are due to the above errors in calculating time in circulation speed). For heating speed, there is no systematic variation, as expected. The total volume of circulated air in both fan speeds shows a general decrease with circulation mode, but as discussed below, it is not as regular as might be expected. As noted above, the control house is always in continuous circulation mode, and the data in Table 5 is analysed according to the mode in the experimental house. There are variations in the control house, but they are not systematic.
Table 6 compares the total (circulation speed plus heating speed) circulated air volumes for the two houses. There are significant differences in the experimental house, but they are not exactly as expected because the mean for no circulation mode is slightly larger than the mean for 45/15. This is due to the fact that the amount of time spent in heating speed is significantly larger for the no circulation mode, as shown in Table 2. Also, the difference between these two modes and the 30/30 mode is relatively small because the amount of time spend in heating speed in the 30/30 mode is even smaller.
Conditions in Experimental House
Experimental House Control House (Continuous Circulation)
Mean Exp/Con
Min Mean Max Min Mean Max
Continuous 41,078 44,913 48,867 41,243 44,517 47,821 100.9% 30/30 18,485 19,973 22,774 42,050 43,269 44,194 46.2% 45/15 10,338 14,257 27,826 40,905 43,447 47,815 32.8% No Circulation 3,696 14,617 27,789 42,048 44,744 48,001 32.7%
Table 6. Total Circulated Air Volumes (m3/day), and differences between means, all days.
As explained in Section 3.5, several continuous circulation and 30/30 mode days had to be dropped from the CO2 analysis due to problems with the CO2 release systems and sensors. The results with these days excluded, are shown in Table 7. The results are virtually identical to those in Table 6. (For 45/15 and no circulation they are identical). The expected order of the 45/15 and no circulation means are reversed, and the difference between them and 30/30 is smaller than might be expected. These deviations are due to the fact that, as explained above, the amount of time the furnace fan spends in each speed is a function of heating load as well as the fan controller programs. However, the minimum experimental house circulated air volumes in both Table 6 &7 do decrease with circulation modes with longer maximum off-times, and some measures of circulation may be more dependent on the minimum volumes than they are on the means. Given these factors, one would not expect the differences in natural gas use or
circulation to be as significant or consistent as they would be if circulated volumes had varied regularly with circulation mode.
Conditions in Experimental House
Experimental House Control House (Continuous Circulation)
Mean Exp/Con
Min Mean Max Min Mean Max
Continuous 46,697 46,697 46,697 46,177 46,177 46,177 101.1% 30/30 18,485 19,427 20,648 42,851 43,574 44,194 44.6% 45/15 10,338 14,257 27,826 40,905 43,447 47,815 32.8% No Circulation 3,696 14617 27,798 42,048 44,744 48,001 32.7%
Table 7. Total Circulated Air Volumes (m3/day), and differences between means, valid CO2 days.
As stated in Sections 2.5 & 2.6, the original hypothesis to be tested was that, for each criteria, the effect on circulation would get larger for circulation modes with longer maximum off-times. The original hypothesis should hold when all four circulation modes are tested under the same conditions, i.e., with the same numbers of heating hours, and the same volumes of circulated air. However, given the actual conditions described above, one can define a second
hypothesis, that there should be a large difference between continuous circulation and 30/30, and
smaller difference between 30/30 and the last two modes, and little or no difference between the 45/15 and no circulation modes. Whether a given criteria should conform better to the original or second hypothesis should depend on whether it is more sensitive to minimum or average volumes of circulated air.
Figures 4 through 9 illustrate some of the hourly effects of the programmable fan controller in the 30/30 circulation mode. Figure 4, is for May 6th when there was very little demand for heat in any hour of the day, and no demand for 14 hours. The result is that the furnace fan runs for very close to 30 minutes per hour in all but two or three of the hours, spending 6% of the time in heating, 43% in circulation and 51% off, and averaging 29.3 minutes per hour on (heating or circulation). The fan spends some time in circulation speed in each of the 24 hours, and
circulates for very close to 30 minutes in each of the 14 hours during which there is no heating. Figure 5 shows that the resulting hourly circulation volumes are also relatively constant,
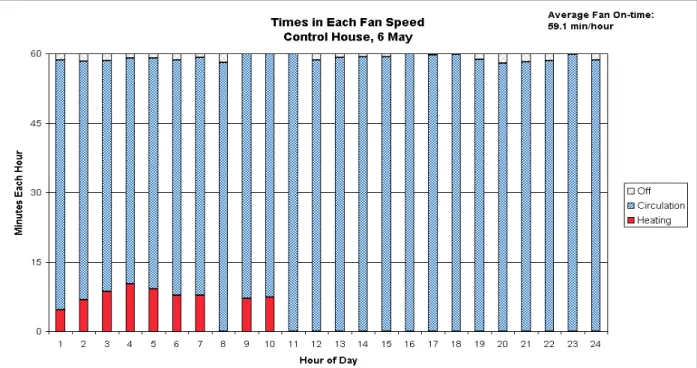
averaging 889 m3/hour. Figures 6 & 7 show the same day in the control house. The amount of time spent in heating is very similar in the two houses, but the control house spends all of the non-heating time in circulation speed. (The small off times, and the fact that the average fan on time is 59.1 instead of 60 minutes, are due to errors in calculating circulation and off times). This leads to very different amounts of circulated air volumes in the two houses: an average of 889 m3/hour in the experimental house, and 1,752 in the control house.
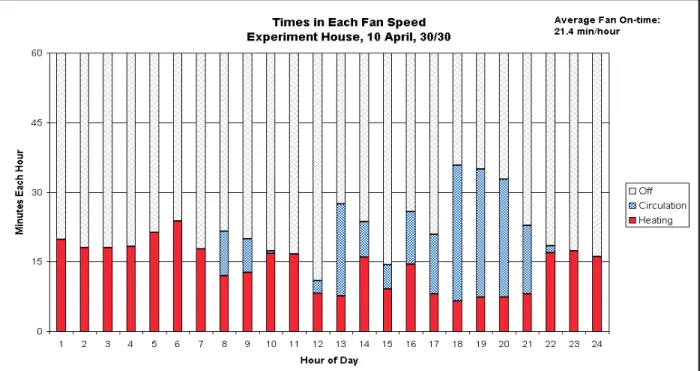
Figure 8 shows the fan operation for April 10th, when there was a demand for heat during each of the 24 hours. Although the fan is never in heating speed for 30 minutes in a given hour (the maximum is 23.8 minutes in hour 6), there is no circulation during 10 hours, and very little (less than 3 minutes) during 3 hours. The fan spends 24% of the day in heating speed,12% in
Figure 4. Times in Each Fan Speed, 6 May, 30/30.
Figure 6. Times in each Fan Speed, 6 May, Control House.
Figure 8. Times in Each Fan Speed, 10 April, 30/30.
circulation, and 64% off. The resulting circulated air volume in Figure 9 is more irregular than the one in Figure 5, and the daily average is 13% smaller (770 m3/hour vs. 889). Thus, more time in heating speed results in less circulation, a perhaps counter-intuitive result.
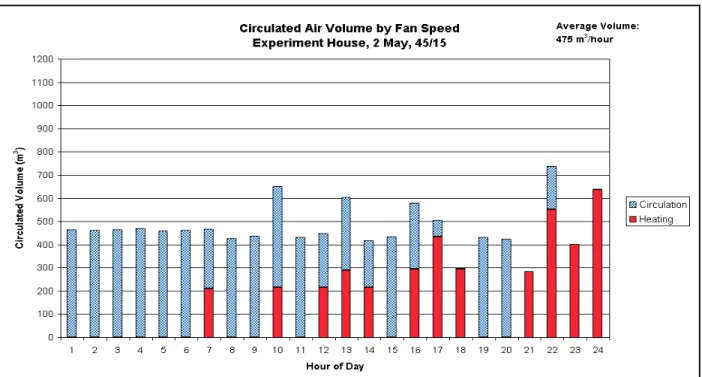
Figures 10 &11 show the circulated air patterns for two days with the 45/15 circulation mode. Figure 10 shows May 2nd, during which there were 12 hours with no demand for heat, and 20 hours with some fan operation in circulation speed (including 0.2 minutes in hour 18). The hourly volumes of circulation are relatively constant, and average 475 m3/hour. Figure 11 shows April 5th when there was at least 18.3 minutes of heating in every hour, and the fan controller never caused the fan to run in circulation mode. Hourly volumes are more irregular and range from 724 to 1,586 m3/hour, averaging 1,159 m3/hour. Thus, while the particular examples for the 30/30 circulation mode showed a 13% decrease in circulated volume with increased space heat demand, the 45/15 examples show a 244% increase. Again, this illustrates that the volume of circulated air depends on both the circulation mode and the demand for space heat.
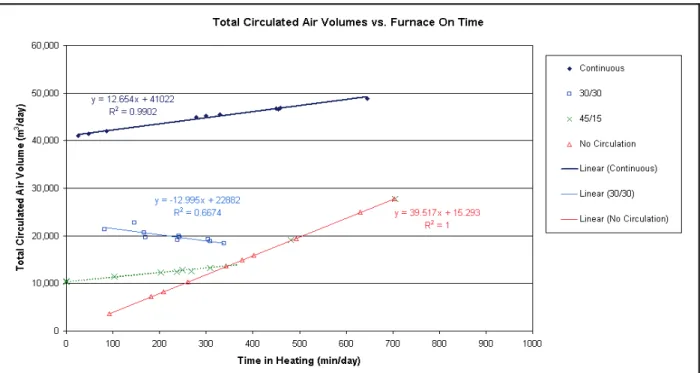
Figure 12 shows the relationship between the total volume of circulated air and the furnace on time for whole days. The relationships appear to be linear and well correlated. Although the r2 for 30/30 is only 0.6674, this is probably due to its shallow slope and short range; the points are all reasonably close to the line. The 45/15 points seem to fall on one of two straight lines. The highest two points are exactly on the no circulation line, and the remainder form a shallower line from there to the Y-axis. This inflection in the 45/15 line, and the shallow slope of the 30/30 line are discussed below in Section 4.1. Thus, Figures 4 through 11 show that on an hour-by-hour basis, the effects of the programmable fan controller seem variable and unpredictable, but Figure 12 shows that on a daily basis they are very regular. The slopes of the 30/30 and 45/15 lines in Figure 12 confirm the above observation that increased furnace on times causes less total circulation in 30/30 mode, but more in 45/15.
Figure 10. Circulated Air Volumes, 2 May, 45/15.
Figure 12. Total Circulated Air Volumes vs. Furnace On Times, by days.
*
Compare this benchmark with the one for heating in the ECM project shown in Figure 16. We suspect that the loosening of the houses may be responsible for the divergence of this project’s benchmark.
3.2 Furnace Electrical Use
Figure 13 shows the amounts of electricity used by the furnace in both houses for each circulation mode, as measured by the CCHT pulse-generating kWh meters. Each point represents one day, with the amount used in the control house being the X-coordinate, and the amount in the experimental house as the Y-coordinate. The benchmark points show the results with continuous circulation in both houses, and since the amounts in each house are nearly equal, the points are all close to the 1:1 line. The other series represent the days when one of the other circulation modes was in effect in the experimental house, while the control house continued to operate in continuous circulation. The points for the 30/30 circulation mode in the experimental house show significant electrical savings in that house, and form a nearly horizontal line. The points for no circulation in the experimental house form a steep line. For the range of control house electrical use covered by the 30/30 mode, all of the no circulation points are lower, while those with somewhat higher control house uses go well above the 30/30 line. Above
approximately 10 kWh/day in the control house, the 45/15 points seem to converge with the no circulation line, as they do in Figure 12, but there is more scatter of these points here. (Note the 45/15 point at the right end of the 30/30 line). All of the points for non-continuous circulation are well below those for continuous circulation, and show the potential for saving electricity with the fan controller.
3.3 Furnace Natural Gas
Most or all of the electrical energy used by the furnace should be converted into heat in the air passing through the furnace. The fan motor gets hot, directly heating the air stream, and the motion of the air is converted to heat by friction. Thus, as more electrical energy is used by the furnace, less natural gas should be required to heat the air. Conversely, circulation modes that use less furnace electricity should require more gas for space heat. Figure 14 shows the amounts of natural gas used by the furnaces in both CCHT houses during this project. As in Figure 13, each point represents one day. The amount of gas used in the control house is the X-coordinate, and the amount used in the experimental house is the Y-coordinate. The benchmark points are for days with continuous circulation in both houses. Ideally they would all lie exactly on the 1:1 line, and in fact, they are all reasonably close to it.* The other series represent the days when one of the other circulation modes was in effect in the experimental house. As expected, the non-continuous modes do use more gas, but the increases are not exactly in accordance with either of the hypotheses since the 45/15 mode has the largest increases.
Figure 14. Furnace Natural Gas Use.