READ THESE TERMS AND CONDITIONS CAREFULLY BEFORE USING THIS WEBSITE.
https://nrc-publications.canada.ca/eng/copyright
Vous avez des questions? Nous pouvons vous aider. Pour communiquer directement avec un auteur, consultez la première page de la revue dans laquelle son article a été publié afin de trouver ses coordonnées. Si vous n’arrivez pas à les repérer, communiquez avec nous à PublicationsArchive-ArchivesPublications@nrc-cnrc.gc.ca.
Questions? Contact the NRC Publications Archive team at
PublicationsArchive-ArchivesPublications@nrc-cnrc.gc.ca. If you wish to email the authors directly, please see the first page of the publication for their contact information.
NRC Publications Archive
Archives des publications du CNRC
This publication could be one of several versions: author’s original, accepted manuscript or the publisher’s version. / La version de cette publication peut être l’une des suivantes : la version prépublication de l’auteur, la version acceptée du manuscrit ou la version de l’éditeur.
Access and use of this website and the material on it are subject to the Terms and Conditions set forth at
Modelling the deterioration of water mains and planning their renewal
Kleiner, Y.; Rajani, B. B.
https://publications-cnrc.canada.ca/fra/droits
L’accès à ce site Web et l’utilisation de son contenu sont assujettis aux conditions présentées dans le site LISEZ CES CONDITIONS ATTENTIVEMENT AVANT D’UTILISER CE SITE WEB.
NRC Publications Record / Notice d'Archives des publications de CNRC:
https://nrc-publications.canada.ca/eng/view/object/?id=227b8acd-7899-4e80-9b6b-286aba3c1e10 https://publications-cnrc.canada.ca/fra/voir/objet/?id=227b8acd-7899-4e80-9b6b-286aba3c1e10
Modelling the deterioration of water mains and planning their renewal
Kleiner, Y.; Rajani, B.
A version of this document is published in / Une version de ce document se trouve dans :
Infra 2002 International Conference on Urban Infrastructure, Montreal, Quebec, Nov. 25-27, 2002, pp. 1-13
www.nrc.ca/irc/ircpubs
MODELLING THE DETERIORATION OF WATER
MAINS AND PLANNING THEIR RENEWAL
By
Yehuda Kleiner, Senior research officer
And
Balvant Rajani, Senior research officer and group leader
National Research Council of Canada Institute for Research in Construction
INFRA 2002 November 25-27, 2002
Hilton Bonaventure Montreal, Quebéc
Modelling the deterioration of water mains and planning their renewal
Abstract: The effective planning of water distribution system renewal requires accurate quantification of the structural deterioration of water mains. As typical water distribution systems comprise hundreds and even thousands of buried pipes, direct inspection of all of them is often prohibitively expensive. Identifying water main breakage patterns over time is an effective and inexpensive alternative to measure the structural deterioration of a water distribution system.
National Research Council of Canada is developing a prototype computer application to help model the deterioration rates of water mains and subsequently plan their renewal. The analysis of water main breakage patterns considers time-dependent factors such as temperature, soil moisture (rainfall deficit), main replacement rates and cathodic protection (CP) strategies, including hotspot CP as well as methodical retrofit CP. The influence of each of these factors on pipe breakage rate can be quantified to (a) identify the “true” background deterioration rates of buried water mains, and (b) project the impact of various operational strategies on future breakage rates.
Once the background ageing rates of water mains are known, their life cycle costs can be evaluated. As well, the future impact of various operational strategies on these life cycle costs can be assessed. Subsequently, strategies can be fine-tuned to achieve maximum efficiency in resource allocation.
Introduction
A recent survey comprising 45 water utilities from North America and the UK revealed that only about 30% of water utilities actually use models from the literature to aid them in making decisions regarding water main renewal (Reid 2000). This low rate is an indication that research efforts are often not translated into operational tools but rather remain
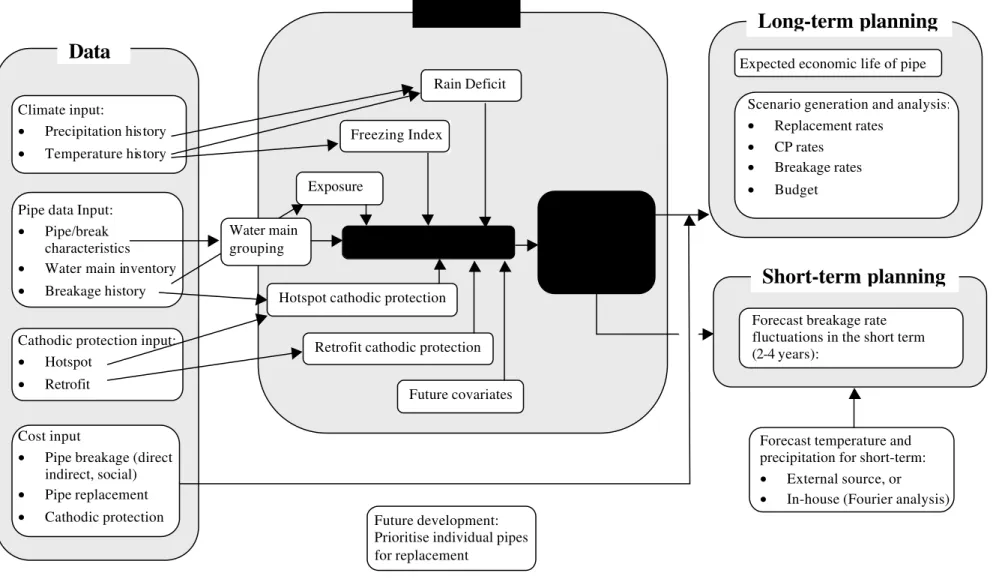
academic exercises. WARP is a computer program being developed at the Institute for Research in Construction (IRC) of the National Research Council of Canada (NRC). It is designed to facilitate the usage of several models developed at IRC in a decision support tool-box that will help municipal engineers and planners to reach more informed decisions. A schematic diagram of WARP is provided in Figure 1. The following sections provide descriptions of the components of WARP as well as screen captures to illustrate how data are input and how analyses and results are handled.
3
Multi-variate model to predict water main breaks
The historical patterns of water main breakage rates are a good, easily obtained indicator of the structural deterioration of a water distribution network. Factors affecting pipe breakage rate can be classified as static or dynamic. While static factors include pipe material, diameter, installation practices, soil type, etc., dynamic factors are time-dependent and include environmental (e.g., soil moisture, climate conditions, etc.) as well as operational (pressure, cathodic protection, etc.) factors.
Kleiner and Rajani (2000a & 2000b) proposed a general, multi-variate exponential (or an alternative power) model to consider time-dependent factors in predicting water main breaks. T t x a t N x e x N( )= ( ) ⋅ 0 t (1)
where xt = vector of time-dependent covariates prevailing at time t, N(xt) = number of
breaks resulting from xt, a = vector of parameters corresponding to the covariates x; xto=
vector of baseline x values at year of reference to.
Although the mathematical model is not restricted in the number of covariates it can consider, data availability (or rather unavailability) is usually the limiting factor. This model is applied to groups of water mains that are assumed homogeneous with respect to their deterioration rates. The grouping is typically done by some or all of the static factors (e.g., by size, material, vintage, etc.) for which data are available. Figure 2 illustrates how this is done in WARP.
Environmental dynamic covariates - climate
The breakage rate of buried pipes can be influenced by climatic conditions in several ways. Kleiner and Rajani (2000b) provided many references to reported observations concerning the influence of temperature and soil moisture on the frequency of water main breaks. Rajani et al. (1996) showed that differential temperature change between pipe and soil, and also soil shrinkage due to dryness result in the development of stresses in the pipe. Rajani and Zhan (1996) showed that dry soil (expected after an extreme dry season) has low latent heat capacity and will therefore lead to deeper frost penetration in cold regions.
WARP uses freezing index (FI) as a surrogate measure for the severity of winter in a given year. FI is expressed in units of degree-days, and is calculated by summing the average temperature in all days in a given year in which the average temperature was below a pre-defined threshold. The data required to include FI in the analysis comprise average daily temperature records for the period of available water main breakage history.
Figure 1. A schematic depiction of WARP
Hotspot cathodic protection Exposure
Freezing Index
Retrofit cathodic protection
Future covariates Rain Deficit Multivariate model
Analysis
• Background ageing • Coefficients (impact) of covariatesCathodic protection input:
• Hotspot • Retrofit Climate input: • Precipitation history • Temperature history
Data
Pipe data Input:
• Pipe/break
characteristics
• Water main inventory
• Breakage history
Cost input
• Pipe breakage (direct,
indirect, social)
• Pipe replacement
• Cathodic protection Future development:
Prioritise individual pipes for replacement
Forecast temperature and precipitation for short-term:
• External source, or
• In-house (Fourier analysis)
Forecast breakage rate fluctuations in the short term (2-4 years):
Short-term planning
Expected economic life of pipe Scenario generation and analysis:
• Replacement rates • CP rates • Breakage rates • Budget
Long-term planning
Water main grouping5
Rain deficit (RD) is used as a surrogate measure for soil moisture. There are various methods to calculate RD, WARP does it using the Thornwate method (Kleiner and Rajani 2000a,b). As noted before, since soil moisture can influence pipe breakage rate by way of two mechanisms (soil shrinkage during long dry spells and frost penetration during a cold winter following a dry summer and fall) RD is considered in two ways. RD cumulative accounts for the average soil mosture during a given year, whereas RD snapshot accounts for the soil moisture at the beginning of the cold season. The data required to include RD in the analysis comprise average monthly temperature and precipitation records for the period of available water main breakage history.
In order to avoid dealing with very large and very small values in equation (1), FI and RD are expressed as Z-scores, which are the normalised forms of these variables. Z-scores are in fact the deviations (expressed in standard deviations) of data points from the long-term average value of the data series. Figure 3 illustrates climate data entry in WARP.
7
Operational dynamic covariates – cathodic protection
Cathodic protection (CP) of metallic water mains can often be an effective method of reducing breakage frequency and extending the useful life of pipes. WARP
distinguishes between two types of CP, hotspot and retrofit:
Hotspot cathodic protection (HS CP) is the practice of opportunistic installations of protective anodes at locations of a pipe failure, or other events at which the pipe is exposed. These anodes are typically installed without any means of monitoring and stay in the ground until total depletion, usually without replacement. In equation (1) the
HS CP covariate is taken as the number of active (non-depleted) anodes per unit length
of pipe. Kleiner and Rajani (2002) provided more details on this procedure. The data required to include HS CP in the analysis comprise breakage records, date of
beginning/end of the HS CP program and estimates on the life expectancy of an anode in the ground.
Retrofit cathodic protection (Retro CP) refers to the practice of systematically protecting existing pipes with galvanic cathodic protection. If the existing water main is electrically discontinuous (e.g., bell and spigot with elastomeric gaskets and no bridging) then an anode is attached to each pipe segment (typically 6 m or 20’ length). If the water main is electrically continuous then usually a bank of anodes in a single anode bed can protect a long stretch of pipe.
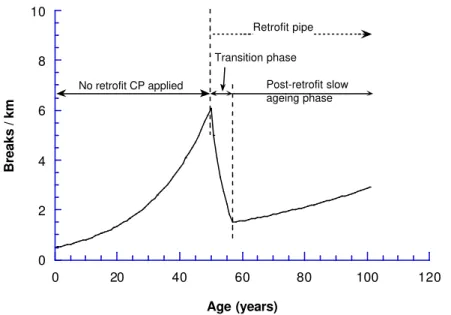
Kleiner and Rajani (2002) modelled the impact of retrofit cathodic protection on water main breakage rate as a two-phase process as illustrated in Figure 4. Subsequent to a CP retrofit, the pipe breakage rate reduces exponentially over a transition period. This is because the pipe is likely to have some deteriorated parts, which will suffer imminent breakage. The CP can thus delay those breaks but not prevent them altogether. Once the protected pipe is “purged” of these imminent breaks, a new phase begins, in which the pipe continues to age (exponential growth of breakage rate) albeit at a lower rate than before protection. The data required to include Retro CP in the analysis comprise only the date of retrofit of individual pipes in the inventory.
Retrofit anodes are usually monitored and replaced when fully depleted, thus it is assumed that the slow ageing rate is maintained in perpetuity through the rest of the pipe’s life. Budgetary and operational considerations dictate that an entire distribution network can never be retrofitted at once, rather small portions of the network are gradually retrofitted over the years. WARP has therefore to account for several ageing patterns (as depicted in Figure 4) that take place at different times.
Figure 4. Phases in breakage pattern when pipe is retrofitted at year 50.
Kleiner and Rajani (2002) have shown that cathodic protection (both hotspot and retrofit) can have a significant impact on the economic life of water mains as well as on their life-cycle costs. Information on historical CP programs is entered in WARP through the same input screens illustrated in Figure 2.
Analysis
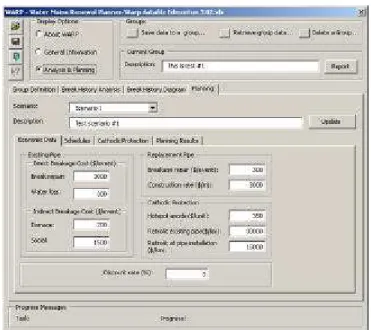
WARP can perform analyses of historical breakage rates without or with any number of covariates from the ones described earlier. When no covariates are selected, the results indicate an average ageing rate. When one or more covariates are selected the results reflect background ageing (which is the consistent increase in pipe breakage rate due to corrosion and other steady, continuous deterioration processes) as well as annual variations due to the influence of time-varying, dynamic factors. Figure 5 illustrates analysis setup and results in WARP.
0 2 4 6 8 10 0 20 40 60 80 100 120 Breaks / km Age (years)
No retrofit CP applied Post-retrofit slow ageing phase Transition phase Retrofit pipe a1 = 0.05 a'1 = -0.20 N(to) = 0.5 a"2 = 0.015
9
Figure 5. Analysis of historical breakage rate in WARP
Planning
Once the analysis identifies all the parameters and coefficients governing the breakage rates in the water mains, expected future breakage rates can be forecasted. If a credible forecast of near-term climatic conditions is available, a detailed breakage rate forecast is possible. A climate forecast can be obtained either from the meteorological services or, if desired, WARP provides a rudimentary tool for predicting climate using a Fourier
analysis of available climatic time series. This detailed breakage rate forecast may be practical for a short-term (2-4 years) only. Breakage rate prediction in the long-term involves only background ageing and cathodic protection programs.
Figure 6. Cost data input in WARP
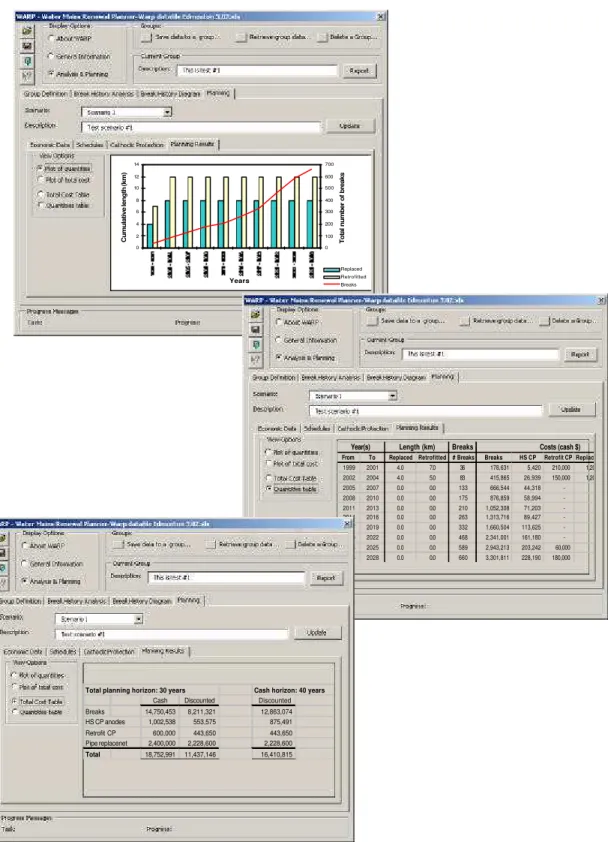
With the appropriate economic data (see input screen in Figure 6), such as costs of breakage consequences, pipe replacement and cathodic protection, long-term planning can be done. WARP can perform some rudimentary optimisations as well as calculate the life-cycle costs of any user-defined strategy that may include combinations of cathodic protection and pipe replacement over several years as is illustrated in Figures 6,7,8.
11
Figure 8. Planning results in WARP 0 2 4 6 8 10 12 14 Years Cumulative length (km) 0 100 200 300 400 500 600 700
Total number of breaks
Replaced Retrofitted Breaks
Year(s) Length (km) Breaks Costs (cash $)
From To Replaced Retrofitted # Breaks Breaks HS CP Retrofit CP Replacement 1999 2001 4.0 7.0 36 178,631 5,420 210,000 1,200,000 2002 2004 4.0 5.0 83 415,865 26,939 150,000 1,200,000 2005 2007 0.0 0.0 133 666,544 44,318 - 2008 2010 0.0 0.0 175 876,859 58,994 - 2011 2013 0.0 0.0 210 1,052,308 71,203 - 2014 2016 0.0 0.0 263 1,313,716 89,427 - 2017 2019 0.0 0.0 332 1,660,504 113,625 - 2020 2022 0.0 0.0 468 2,341,001 161,180 - 2023 2025 0.0 0.0 589 2,943,213 203,242 60,000 2026 2028 0.0 0.0 660 3,301,811 228,190 180,000
Total planning horizon: 30 years Cash horizon: 40 years
Cash Discounted Discounted
Breaks 14,750,453 8,211,321 12,863,074 HS CP anodes 1,002,538 553,575 875,491 Retrofit CP 600,000 443,650 443,650 Pipe replacenet 2,400,000 2,228,600 2,228,600 Total 18,752,991 11,437,146 16,410,815
Summary
WARP is a decision support tool that helps to model the deterioration rates of water mains and subsequently plan their renewal. The analysis of water main breakage patterns considers time-dependent factors such as temperature, soil moisture (rainfall deficit), main replacement rates and cathodic protection (CP) strategies, including hotspot CP as well as methodical retrofit CP. The influence of each of these factors on pipe breakage rate can be quantified to (a) identify the “true” background deterioration rates of buried water mains, and (b) project the impact of various operational strategies on future breakage rates. Static factors affecting breakage rates (e.g., pipe material, diameter, soil) are considered through the grouping of water mains into relatively homogeneous groups. Historical breakage rate patterns are assumed to govern the future behaviour of the water mains. Based on this assumption and with the appropriate economic and cost data, the future impact of various operational strategies can be computed towards efficient planning of water main assets.
13
References
Kleiner, Y., and Rajani, B.B. (2000a). “Considering time-dependent factors in the statistical prediction of water main breaks.” Proc., American Water Works Association Infrastructure Conference, Baltimore. Kleiner, Y., and Rajani, B.B. (2000b). “Forecasting Variations and Trends in Water Main Breaks”,
submitted to the Journal of Infrastructure Systems, ASCE.
Kleiner, Y., and Rajani, B.B. (2002). “Quantifying the effectiveness of cathodic protection in water mains”, NACE International seminar, Northern Area, Montréal Section, Quebéc City, Aug. 2002.
Rajani, B., and Zhan, C. (1996). “On the Estimation of Frost Load.” Canadian Geotechnical J., 33(4), 629-641.
Rajani, B., Zhan, C., and Kuraoka, S. (1996). “Pipe-soil Interaction Analysis for Jointed Water Mains.”
Canadian Geotechnical J., 33(3), 393-404.
Reid, F. (2000), unpublished data collected for the research project “Main breaks prediction, prevention and control” under the auspices of the American Water Works Association Research Foundation, Denver.