Publisher’s version / Version de l'éditeur:
Vous avez des questions? Nous pouvons vous aider. Pour communiquer directement avec un auteur, consultez la
première page de la revue dans laquelle son article a été publié afin de trouver ses coordonnées. Si vous n’arrivez pas à les repérer, communiquez avec nous à [email protected].
Questions? Contact the NRC Publications Archive team at
[email protected]. If you wish to email the authors directly, please see the first page of the publication for their contact information.
https://publications-cnrc.canada.ca/fra/droits
L’accès à ce site Web et l’utilisation de son contenu sont assujettis aux conditions présentées dans le site LISEZ CES CONDITIONS ATTENTIVEMENT AVANT D’UTILISER CE SITE WEB.
27th American Towing Tank Conference [Proceedings], 2004
READ THESE TERMS AND CONDITIONS CAREFULLY BEFORE USING THIS WEBSITE. https://nrc-publications.canada.ca/eng/copyright
NRC Publications Archive Record / Notice des Archives des publications du CNRC :
https://nrc-publications.canada.ca/eng/view/object/?id=38f03a01-c252-4fa6-b2dd-04de2e15044d
https://publications-cnrc.canada.ca/fra/voir/objet/?id=38f03a01-c252-4fa6-b2dd-04de2e15044d
NRC Publications Archive
Archives des publications du CNRC
This publication could be one of several versions: author’s original, accepted manuscript or the publisher’s version. / La version de cette publication peut être l’une des suivantes : la version prépublication de l’auteur, la version acceptée du manuscrit ou la version de l’éditeur.
Access and use of this website and the material on it are subject to the Terms and Conditions set forth at
Accuracy issues and measurement complications pertaining to
standard ship trials
27th American Towing Tank Conference St. John’s, Newfoundland and Labrador Canada, August 6 and 7th, 2004
ACCURACY ISSUES AND MEASUREMENT COMPLICATIONS PERTAINING TO STANDARD
SHIP TRIALS
David Cumming
Institute for Ocean Technology National Research Council
ABSTRACT
This paper discusses accuracy issues and measurement complications related to acquiring data during standard ship trials. Recent Institute for Ocean Technology (IOT) experience using a modern trials instrumentation capability during seakeeping, propulsion and manoevring trials on a small monohull will be discussed at length with a description of the measurement techniques and calibration procedures used, problems encountered, the source of accuracy uncertainties and some general ship/model correlation issues. The paper is designed to stimulate discussion and promote debate for the benefit of all researchers involved in ship performance assessment.
INTRODUCTION
Although physical and numerical model tools are used extensively to evaluate the performance of ships, there is relatively little publicly available full scale trials data available to validate these tools. This paper describes a series of standard sea trials carried out on the 40 m long M/V Louis M. Lauzier off St. John’s, Newfoundland in 2001 as part of a collaborative project between the Institute for Ocean Technology, Memorial University of Newfoundland (MUN) and Oceanic Ltd. The objectives of the project included:
• Validating physical model methodology;
• Validating numerical prediction tools under development;
• Developing standard procedures for carrying out seakeeping, manoeuvring and propulsion trials; • Training IOT technical staff in the installation and
operation of trials equipment and instrumentation; • Developing and validating dedicated trials data
acquisition software that involved integrating and storing signals from both digital and analog sources; and
• Identifying issues that could impact on the correlation of full scale data with physical and numerical model data.
The subject ship was relatively old (built in 1976), has been heavily modified since construction, and is fitted with a complex appendage arrangement. Thus acquiring accurate sea trials data represented a significant challenge. The identification of a number of measurement complications and issues that had a potentially negative impact on the subsequent correlation with physical model data are described in detail.
DESCRIPTION OF THE M/V LOUIS M. LAUZIER
The St. John’s based ‘Lauzier’ is primarily used by the Marine Institute of Memorial University as a training platform for sea going personnel as well as a research ship deployed by the MUN Oceanography Dept. The vessel has a hard chine aluminum hull, is twin screw fitted with fixed pitch propellers, and twin rudders. Other appendages include a set of flat plate bilge keels fitted inboard of the chine and a large sonar caisson located off the longitudinal centerline on the starboard side. Since the ship was commissioned, a bow thruster installed in a cylindrical bulbous bow has been added, new engines and propellers fitted, and the stern has been extended. The ‘Lauzier’ was originally designed as a fisheries patrol boat for the Canadian Government capable of forward speeds over 20 knots however, after the modifications, the maximum forward speed is now limited to 11.5 knots.
Principal Particulars:
Length Overall 40 m Length Between Particulars 37.1 m
Breadth 8.2 m
Draft 2.44 m
Gross Displacement 332 t
Propulsion Type 2*geared Diesel
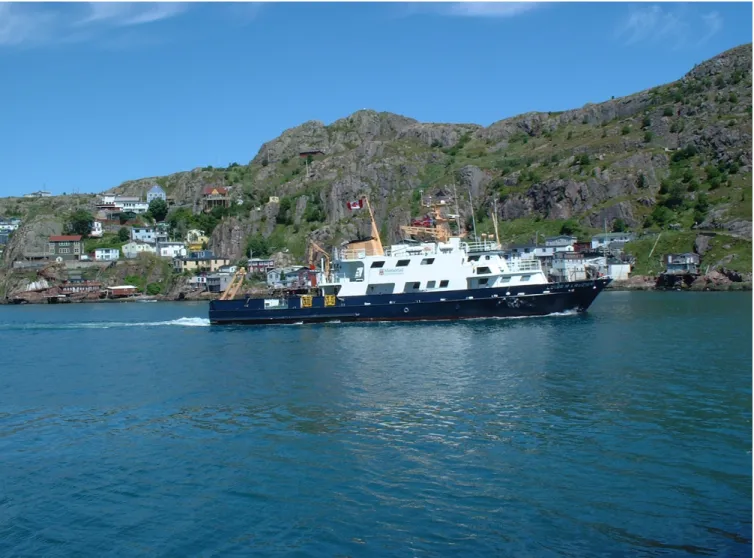
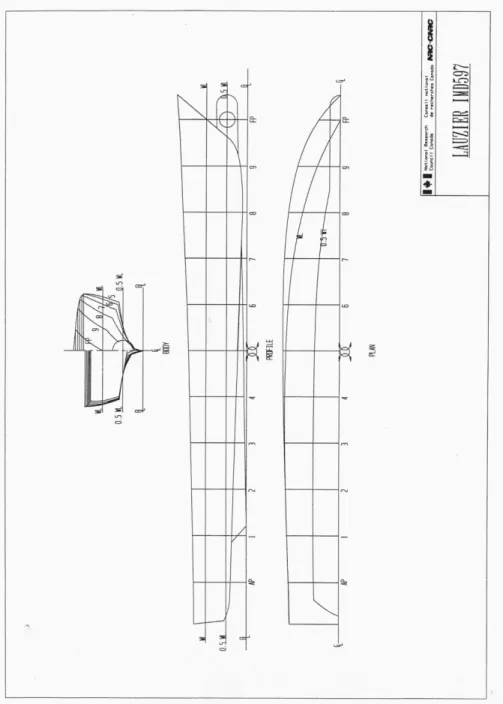
Photographs and body plan of the ship are provided in Figures 1 to 5.
DESCRIPTION OF INSTRUMENTATION
A brief description of the trials instrumentation and calibration procedure used are provided as follows:
Rudder Angle: was measured by winding the cable, with wire extension, from a yo-yo potentiometer linear displacement transducer around a groove cut in a plywood plate mounted on top of one of the rudder posts (the two rudders were controlled in tandem). Rudder angle was calibrated relative to a protractor mounted on top of the plywood plate.
Ship Motions: Pitch and roll angle were measured using a bi-axial electro-mechanical gyro calibrated in the lab relative to the output to an inclinometer. Pitch, roll and yaw rate were measured using electro-mechanical gyros and calibrated using manufacturer’s calibration information. Orthogonal linear accelerations (surge, sway and heave) were measured using accelerometers mounted at the nominal center of gravity of the ship and calibrated in the lab using a set of precision wedges. Heading Angle: acquired by tapping a digital signal off the ship’s navigation gyro.
Forward Speed Over Ground, Course Over Ground, Position: digital signals for these parameters were acquired using a dedicated Global Positioning System (GPS) receiver with antenna mounted on an upper deck augmented with differential correction signal from a Canadian Coast Guard station in Cape Race, Newfoundland – nominally 100 km to the south. Propeller Shaft Speed: signal was tapped off a ship’s repeater located just aft of the data acquisition system and calibrated using a laser tachometer directed at a reflective target on the shaft.
Shaft Torque: measured using strain gages bonded to the shafts with power transmitted to and strain signal transmitted off the shaft via rotor/stator antenna arrangement. Torque was calibrated using a series of shunt resistors across the bridge simulating a torsional load.
Directional Wave Height: (seakeeping trials only): small (0.75 m diameter) battery powered directional wave buoy with mooring.
Sea Water Temperature/Density: measured using a battery powered, hand held salinity, conductivity and temperature meter via a weighted probe on the end of a 7.6 m cable.
Hull Roughness: assessed both on dry dock and underwater using a British Ship Research Association (now British Maritime Technology (BMT)) hull roughness analyzer with output verified using a polycarbonate reference plate provided by the instrument manufacturer.
Data Acquisition System: Data was acquired on a PC using a sampling rate of 50 Hz low pass filtered at 10 Hz. Dedicated
software was used to store data from both analog and digital sources in parallel.
SEA TRIALS DESCRIPTION
Manoeuvring Trials: The following manouevring runs were carried out in calm water conditions (wind < 10 knots, no waves, maximum 0.5 knot current) in Conception Bay west of St. John’s August 2001.
Turning circles terminated by pull-outs after a minimum heading angle change of 540 degrees:
Nominal Forward Speed = 6, 8 and 11.5 knots, rudder angle = 15, 35 degrees port/starboard.
Zig zags were carried out with seven rudder executes:
Nominal Forward Speed = 6, 8 and 11.5 knots, rudder angle = 10/10 degrees, 20/20 degrees.
Propulsion Trials: propulsion runs were also carried out in calm water conditions (wind < 10 knots, no waves, maximum 0.5 knot current) in Conception Bay August 2001. Runs were executed in 1 knot increments over a nominal forward speed range from 5.5 knot to 11.5. For each run, data for two 4 minute runs were acquired on a reciprocal course with an additional run executed on the original course as a check.
Seakeeping Trials: After numerous attempts to acquire seakeeping data failed during the fall of 2001 due to inappropriate environmental conditions or equipment failure, twelve 25 minute long runs were successfully carried out November 6th in sea state 3 conditions in the vicinity of a moored directional wave buoy 17 nm east of St. John’s. Data for a full set of five heading angles (head, bow beam, quartering and following seas) with respect to the incident waves was acquired at nominal forward speeds of 6 and 10.5 knots as well as two zero forward speed drift runs at an initial beam sea heading angle.
ACCURACY & MEASUREMENT ISSUES
After completion of the full scale trials, physical model experiments were carried out in IOT’s facilities using two geosimilar models – a 1:12 scale (seakeeping and manoeuvring) and a 1:6 scale (propeller open water, resistance and propulsion). The accuracy issues and measurement complications that in particular impact on the correlation of the full scale data with the physical model data are described as follows:
Rudder Angle/Steering Issues:
It is a regulatory requirement that a ship will have a graduated template fitted with pointer affixed to the rudder stock or linkage that is used to provide an absolute indication of rudder angle. There was no such template available on the ‘Lauzier’ (this may have been an omission when the vessel was lengthened with a stern addition). Thus there was no definitive mechanical indicator to calibrate rudder angle and determine the position of amidships rudder. IOT fitted a protractor on the top of the rudder post and selected an arbitrary rudder zero angle based on the Bridge rudder indicator. A review of the data implies that the ship’s autopilot recognizes another zero position - approximately 1.9 degrees to port.
It proved difficult for the helmsman to manually control rudder activity effectively especially during zig zag manoeuvres with the small diameter steering wheel on the bridge coupled with the small, coarsely graduated dial for setting rudder angle. This resulted in some anomalies in the rudder angle signal and many poor quality zig zag runs.
It appears from a review of the rudder angle signal for turning circles that there was some hydraulic leakage in the steering mechanism that results in the rudder angle falling off somewhat during a turn. The rudder control system eventually senses the difference between demanded and actual rudder angle and effects a correction.
Ideally, the ship’s rudder deflection rate is emulated on the physical model. This is particularly important for manoeuvring tests however having a different rudder deflection rate can also have a negative impact on model motions during seakeeping tests - especially in an oblique seaway. Although the nominally correct rudder rate was used for manuovering experiments, it was deemed prudent to increase the rudder response during seakeeping experiments in IOT’s relatively small Offshore Engineering Basin to reduce the potential for model damage if the model suffered a loss of radio control.
There was no information on the autopilot gain factors available in the ship’s documentation. Without this information, the gain factors on the physical model were set to arbitrary values. Incorrectly modeling the autopilot control attributes can result in different heading angle control characteristics and subsequently a negative impact on model motions in a seaway – especially on yaw motion. IOT is planning to investigate the possibility of deriving some dedicated full scale manoeuvres with the objective of estimating unknown autopilot gain factors.
The International Towing Tank Conference (ITTC) recommends (Reference 1) that the minimum rudder activity necessary to maintain heading be used during a propulsion run – typically no more than ±3 degrees. The ‘Lauzier’ was set on autopilot control during the steady state portion of the propulsion runs and it was noted that the rudder angle often exceeded 3 degrees. The vessel seemed to be getting pulled to starboard – presumably due to the presence of the large sonar caisson on the starboard side. For the model scale propulsion experiments carried out in a towing tank environment, the rudders were fixed with rudder angle amidships and so the difference in rudder activity would be expected to have a negative impact on the correlation.
Shaft Instrumentation/Propulsion Issues:
When bonding strain gages to a shaft to measure strain, it is important that the shaft surface be clean and free from corrosion and imperfections. The shafts on a relatively old ship like the ‘Lauzier’ required a fair amount of surface preparation bearing in mind that rosettes were bonded to both sides of each shaft, 180 degrees apart, to mitigate the negative influence of shaft bending. The lack of a shaft jacking capability to turn the shafts complicated the set up.
Even a minor misalignment of the strain gages relative to the shaft longitudinal axis can have a significant negative impact on measured values. IOT uses a technique for gage alignment whereby a template is prepared using non-perforated strip chart paper tightly wrapped and faired to the shaft. The lines on the chart paper were used to align the gages within ~ ¼ degree relative to the longitudinal axis of the shaft.
Ideally, the strain gages would be bonded to the shaft with the shaft at the same temperature and humidity as would be experienced during the trial. In reality, the gages are normally bonded to the shaft with the ship tied up in port and the engine room somewhat cooler than would be expected at sea. The temperature of the ‘Lauzier’ engine room during the strain gage installation was about 20 ºC however the strain gages were bonded only a short distance forward of the stern tube and the long tail shafts extended out into the cold water of St. John’s harbour resulting in a significant difference between shaft temperature and ambient engine room temperature. This temperature differential, combined with the relatively high ambient humidity conditions prevalent in the engine room during the instrumentation outfit, represented a challenging environment to achieve a quality strain gage bond. In an effort to reduce this temperature differential during the ‘Lauzier’ trial, the shaft location where the gages were to be bonded was heated for several minutes using a hand held heat gun. Other strategies adopted to mitigate the temperature effects included selecting a gage with a backing material close to the shaft material (i.e.: self-temperature compensation), and avoiding any obvious adjacent heat sources when choosing the gage location.
Although the main engines and propellers had been changed since the vessel was built with subsequent reduction in the ship forward speed from over 20 knots to 11.5 knots, the ‘Lauzier’ shafts were original. Thus the predicted strain levels were much lower than would normally be expected. Measuring torque strain was barely feasible while it was not possible to measure shaft thrust with a maximum predicted thrust strain of only ~ 2.5 strain,
The ‘Lauzier’ shafts were not electrically grounded increasing the potential for signal contamination when measuring minute strain gage signals if there is an accumulation of static on the shaft. Significant problems can also occur if there are local radio transmission sources at, or close to, the same frequencies used to transmit power to, or strain signal off the shaft. No problems were noted during the propulsion trial, however. It is not generally practical to physically calibrate full scale shaft torque or thrust by applying a large physical torsional or thrust load on a ship’s propeller shaft – even with the ship in dry dock. To calibrate the strain gage bridge, loads are simulated using a shunt resistor network with resistor values designed to cover the predicted range of torque. The shunt calibration network consists of a set of resistors shunted across one arm of the bridge at different points along the network. Ideally, the calibration is carried out with the ambient temperature and humidity close to what could be expected during the trial however this is not often feasible. To mitigate temperature induced errors, the gages are powered up a
minimum of 15 minutes prior to the calibration to warm the gages up to their operating temperature.
It was desirable to fabricate geosimilar propellers to be fitted to the physical models during the post-trial model experiments. Neither the ship’s operators nor the propeller manufacturer could supply an accurate three dimensional geometry of the four bladed propellers on the ‘Lauzier’. It proved necessary to physically measure the geometry of the propeller when the vessel was in dry dock complicating the propeller fabrication process and likely reducing the accuracy of the propeller. Ideally, the direction of propulsion runs is aligned with the global drift vector induced by a resultant of current, wind and wave. This global drift direction changes with time and is not always easily derived especially if there is a significant tidal component. IOT is planning to develop a procedure to quickly determine the global drift direction at sea by analyzing the results of a slow speed turning circle every four hours during a propulsion trial and deriving the direction of drift using the methodology described in Reference 2.
A consistently higher torque was measured on the port shaft than the starboard shaft presumably due to the presence of the sonar caisson disturbing the flow into the starboard propeller. Significant erosion of the starboard propeller was also noted when the vessel was in dry dock after the trial. The complex wake effects induced by the sonar caisson combined with the propeller damage cannot be easily duplicated in a towing tank environment and inevitably degrades the correlation. A wake survey is planned to investigate the influence of the sonar caisson on the starboard propeller flow field.
Wave Environment Measurement Issues:
Unless there is an existing operating directional wave buoy moored in the area of a planned seakeeping trial, it will be necessary to deploy a dedicated buoy during the trials period. Deploying and recovering a wave buoy from the moving deck of a small vessel in heavy seas is a high risk endeavor. The overall seakeeping trial risks were increased on the ‘Lauzier’ due to the fact that there was no backup for this expensive instrumentation in the event of loss or damage. An effort was made to mitigate the risks by procuring a small (0.75 m diameter), lightweight (15.7 kg) buoy that could be deployed by hand and easily recovered using the ship’s capstan.
An effort was made to deploy the wave buoy away from normal traffic lanes and fishing activity. The buoy sits low in the water, however, and there is always a risk of collision with a transiting ship – especially in poor visibility and/or at night. To mitigate these risks as well as facilitate relocating the buoy in heavy seas, a second float fitted with a radar reflector and battery powered flashing light on a 2 m long mast was coupled to the wave buoy mooring. The wave buoy was deployed prior to the start of the trial and recovered at the end of the day. In addition, a Notice to Mariners was issued that included the buoy location as well as a description of the buoy and float. The buoy was moored in 165 m of water using a simple 190 m mooring designed by technical staff from the MUN Oceanography Dept. With the second float connected to the wave buoy, however, the wave buoy mooring line became
hopelessly twisted and it is possible that the presence of the float eventually had a negative influence on the buoy’s wave direction measurement capability. Having a float with a radar reflector and flashing light proved indispensable for relocating the wave buoy in fog at night off Newfoundland. In future, however, the float will be deployed close to the wave buoy with a separate mooring although this will increase the cost and effort required to acquire directional wave information. The wave height/direction are measured at a single point during a seakeeping trial – the location of the wave buoy. During the course of any trial, the ship could be several kilometers away from the buoy at any point in time and the wave field is also constantly changing – both spatially and temporally. It is recommended that ship motions for a minimum of 100 pairs of peaks and troughs be measured to acquire a reliable estimate of seakeeping performance (Reference 3). A longer run time is required to record quality data in following/quartering seas than in head/bow seas. The ITTC recommends adopting the following run pattern (Reference 4).
The run time depends on the ship forward speed but typically the following sea run time is twice the head sea run time. It is noted that bow and quartering seas runs are generally much farther from the wave buoy than other headings. During the seakeeping trials on ‘Lauzier’, we attempted a hexagon pattern of constant length runs with the buoy in the center in an effort to acquire data equidistant from the buoy for all runs however, even with the aid of GPS and electronic chart navigation aids, some runs were acquired too far from the wave buoy. In future, IOT will adhere to the ITTC recommended run pattern. IOT is also investigating the potential of measuring the wave environment using recently developed instrumentation (described in References 5, 6) that interfaces with a standard ship X-band radar. This technology, albeit expensive, would significantly reduce the risks inherent in deploying/recovering a wave buoy in heavy seas to acquire directional wave data at sea.
On the ‘Lauzier’ trial, the dominant wave direction was estimated visually and the ship heading for the run pattern based on this decision. Sometimes the wave direction estimated visually can be deceiving. Often part way through the run pattern, what should have been a bow sea appeared more like a beam sea. In future, IOT will acquire and download a file from the wave buoy at the beginning of the trial (while recording a zero speed drift run) to rationalize a dominant sea direction.
Emulating the wave buoy data in a tank environment was also a challenge. There was significant spatial variability and, primarily due to unavoidable reflection, some temporal variability in the tank. Measuring and modeling the wave environment was by far the most significant single factor affecting the seakeeping ship/model correlation.
All sea trials are scheduled for the time of year when there is the highest statistical probability of getting the desired environmental conditions in the proposed trials location. The North Atlantic has a reputation for severe weather but that doesn’t mean that there are no restrictions on scheduling a seakeeping trial. The fall of the year is the optimum time to carry out a seakeeping trial off Newfoundland. In the winter, the weather is often too severe especially for trials on a small vessel. Also, there is the danger of ice accretion on the wave buoy (and ship) degrading the wave buoy data. In the spring, there is often pack ice offshore unacceptably attenuating the incident waves. In summer, the weather is generally too calm.
Ship Motion Measurement/Seakeeping Issues:
For the ‘Lauzier’ seakeeping trial, the ship static stability condition was estimated from the nearest condition described in the ship’s Stability Booklet. This proved to be convenient but resulted in a very crude estimate. In future, if possible IOT will carry out an inclining experiment on the subject ship just before or after a seakeeping trial to derive the metacentric height for the trials condition. Slacking of the lines and measuring the roll motion for 10 minutes proved to be a simple strategy for deriving a good estimate of the roll period.
IOT used the Global Positioning System with a differential correction to provide the most cost effective, accurate data available for determination of course and speed over ground (COG, SOG). Typical errors that can be incurred with and without applying the differential correction (DGPS) are provided in Table 1 below from Reference 7:
TABLE 1: Summary of GPS Errors – in metres per satellite signal acquired:
Typical Error Standard GPS Differential GPS Satellite Clocks 1.5 0 Orbit Errors 2.5 0 Ionosphere 5.0 0.4 Troposphere 0.5 0.2 Receiver Noise 0.3 0.3 Multipath 0.6 0.6
Note that the above listed errors are for absolute position (i.e. latitude, longitude) whereas for any sea trial, the short term
relative position accuracy is what is important and these errors are uncertain. Although the GPS errors are certainly mitigated by using the differential correction signal, they are not eliminated entirely. The actual error incurred changes over time depending in ambient atmospheric conditions, number of satellite signals acquired, distance from the shore based differential correction station, GPS receiver noise attributes and time dependent configuration of the satellite constellation in view. The errors can either cancel out or be cumulative. Multipath error occurs when the incident satellite signals bounce off adjacent ship superstructure. For the ‘Lauzier’ trial, the GPS antenna was fitted on a temporary mast high on the ship however there is unavoidable multipath error potential incurred depending on the satellite configuration and the ship’s heading.
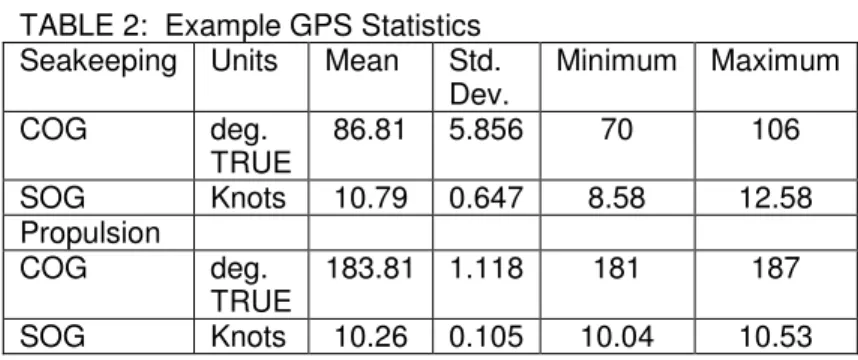
When the vessel is subject to wave induced motions, a GPS antenna placed high on the superstructure moves inducing additional errors. The greater the distance between the antenna and the ship’s axes of rotation, the greater the magnitude of the antenna motion. Note that the data update rate for the GPS data was nominally 1 Hz and thus there is no resolution below 1 Hz. The statistics for example calm water and seakeeping runs on the ‘Lauzier’ are provided in Table 2 below (The GPS antenna location was the same for both runs.):
TABLE 2: Example GPS Statistics Seakeeping Units Mean Std.
Dev. Minimum Maximum
COG deg. TRUE 86.81 5.856 70 106 SOG Knots 10.79 0.647 8.58 12.58 Propulsion COG deg. TRUE 183.81 1.118 181 187 SOG Knots 10.26 0.105 10.04 10.53 Much of the signal oscillation appears due to wave induced vessel motion although it is impossible to dissociate any rudder induced heading deviation due to the hydrodynamic influence of the sonar caisson. Fortunately most of the errors incurred are averaged out over time and the impact on the mean value is assumed to be minor. Thus only the mean value of the data from DGPS can be considered reliable - and only then if there is a long enough sample time to average out short term deviations. It is recommended that the GPS antenna be fitted high on a mast away from any superstructure to mitigate multipath error potential. It is prudent to review the data in the time domain to identify and edit any significant anomalies large enough to impact on the computed average, however.
Ship motions instrumentation is normally calibrated ashore prior to a trial. Care must be exercised with respect to the orientation of the instrumentation relative to the ship based co-ordinate system such that the desired sign convention is retained. Motions measurement instrumentation is often fitted deep inside the ship. Alignment of these sensors is often determined relative to a convenient longitudinal or transverse bulkhead. Motion measurement errors can be incurred if these bulkheads are not aligned with the ship’s axes. The location of angular motion measurement instrumentation can be arbitrary
however the location of such instrumentation as linear accelerometers must be determined as precisely as possible – often relative to the nominal center of gravity. IOT uses ship’s General Arrangement drawings, preferably in electronic format, as an aid to positioning and aligning motion sensors however some misalignment error is unavoidable.
During a seakeeping trial, there is an effort to vary the shaft speed in order to attain a desired nominal ship speed. Typically, the required shaft speed is highest in a head sea and lowest in a following sea, and the speed deviates about some mean as the irregular spectrum is negotiated. During a model experiment in the same wave field, normally a number of runs are spliced together to cover the spectrum. The higher the forward speed, the greater the number of runs required. If there is full scale trials data available, an estimate of the required shaft speed can be made. The validity of this estimate can only be verified once all the runs are acquired, spliced together and the data analyzed. Any difference between the full scale speed and the model scaled speed can result in a difference in measured motions. The higher the forward speed, the greater the potential difference in measured motions as the hydrodynamic lift damping forces are more prevalent.
Ship/Model Correlation - Other Miscellaneous Factors:
Other ship/model correlation issues under review by IOT: Global Ship/Model Dimensions:
The ITTC recommended physical model manufacturing tolerances are breadth within ±1 mm and length within ± 0.05% length or ±1 mm whichever is larger (Reference 8). The IOT standard tolerance on principal model dimensions (Reference 9) is ± 1 mm on dimensions < 2000 mm and ± 0.05% on dimensions > 2000 mm. The International Association of Classification Societies (IACS) recommended ship construction tolerances (Reference 10) are ± 50 mm per 100 m length applied to ships > 100 m length and ± 15 mm breadth applied to ships > 15 m in breadth. IACS, IOT and ITTC scaled model fabrication tolerances and corresponding ship manufacturing tolerances for 6 m long models of typical ships are provided in Table 3. Upon review of this table, it can be determined that:
• the IOT, ITTC and IACS tolerance on model length are identical;
• the IOT tolerance on model breadth matches the ITTC tolerance for models with a beam < 2000 mm; and • the IACS tolerance on model breadth for a given
model scale approaches zero as the ship size increases. None of these standard tolerances take constraints imposed by a specified operational profile into consideration. For example, a PANAMAX vessel or vessel designed to the maximum permissible dimensions of the St. Lawrence Seaway would not be fabricated to length and beam dimensions greater than the allowable as the penalties would be prohibitive. Thus these vessels would have no positive tolerance. What is missing is a database of ‘as built’ dimensional statistics from various shipyards for a range of ship types. What impact does shipbuilding strategy (hull material, design/fabrication methodology, number of hull segments etc.) have on the global ship tolerance? If there is a significant difference between actual ship and model fabrication tolerances, this potentially becomes a ship/model correlation issue.
Impact of Temperature on Ship Global Dimensions:
It is likely that the global dimensions of a metal hull ship could change as the vessel expends and contracts due to variation in temperature. Some of the factors that could be relevant to the temperature induced variation in ship dimensions include:
• ambient water temperature;
• ambient wind speed/air temperature; • draft/freeboard;
• hull material thermal properties; • hull color; and
• internal heat sources.
How much would the global dimensions of a given ship vary due to these temperature factors? Would the results from a propulsion trial off North America be measurably different for the same displacement condition between summer and winter? Would the temperature induced variation in global ship dimensions exceed the ship fabrication tolerance? If so, temperature effects could conceivably become a ship/model correlation issue.
Impact of Temperature on Model Global Dimensions:
IOT fabricates ship models using foam and glass as described in Reference 9. These materials are assumed to be thermally stable – unlike wax models where the length dimension can change 0.15% for a 5 ºC change in ambient temperature (Reference 8). After completion of the model, IOT verifies the model dimensions are within the specified tolerance in the model preparation shop at room temperature – say nominally 20 ºC. The model then may spend several weeks in the Ice Tank in water barely above 0 ºC either for experiments in ice covered water or when, as is often the case, the Ice Tank is being used as an alternative tow tank for open water resistance/propulsion tests. In the near future, IOT plans to measure the global dimensions of a large monohull in the Ice Tank after a test program has been completed to determine if there has been any appreciable contraction. The model only has to contract a few millimetres to exceed the fabrication tolerance.
Minor Appendages:
Many minor features on ships are modified or omitted when fabricating a physical model to reduce time/cost such as:
• the thickness of appendages such as bilge keels and rudders is often not scaled to the correct thickness since they would not have the required strength characteristics;
• propeller shafts extending aft through external bearing supports are fabricated using either a standard shaft diameter or the nearest stock size;
• minor appendages such as shown in Figure 6 are omitted.
On a large model of a small ship such as the ‘Lauzier’, not accurately modeling these features may have a measurable negative impact of the ship/model correlation. Perhaps more attention to detail should be standard for models fabricated to a scale of 1:10.
IOT uses a mean surface roughness of 150*10-6 m when predicting powering (using ITTC 78 method) unless otherwise specified. For the ‘Lauzier’ trials, hull surface roughness was measured just after the propulsion trial and this value was used to improve the model power prediction. The propulsion trials were carried out 13 months after the last hull cleaning on ‘Lauzier’. There is no convenient method of accurately quantifying hull fouling however some recent progress has been made understanding the influence of biofouling (References 11, 12) on the boundary layer. To estimate the influence of hull fouling on the power prediction, IOT used a Canadian Navy standard based on a Royal Navy study (Reference 13) that recommended increasing the frictional resistance coefficient 0.125% per day since the last hull cleaning. For the ‘Lauzier’ this resulted in an increase of 48.75% in the hull friction coefficient and ultimately an overall increase of some 18% in the delivered power using the ITTC 57 method and 26% using the ITTC 78 method. Using such a crude estimate for estimating fouling effect is assumed to have a potentially serious negative impact on the overall correlation effort. The obvious solution is to carry out the propulsion trial within 30 days of the last hull cleaning but this is not always possible.
Air Resistance:
IOT currently uses 0.5*beam2 unless otherwise specified to estimate the frontal area of a ship when computing the air resistance coefficient (using ITTC 78 method). For the ‘Lauzier’ trials, the actual frontal area was used to improve the model power prediction. Determining a frontal area for standard ship types (tanker, containership, cruise ship, various warship types etc.) based on an average value derived from a large database of existing ships should improve the estimate for air resistance when evaluating new designs.
Conversion of Shaft Power to Delivered Power:
IOT measures shaft torque model scale using a Kempf & Remers dynamometer inserted in the shaft line. To derive torque at the propeller to compute delivered power, friction torque in the shaft bearings aft of the dynamometer must be quantified by replacing the propellers with dummy hubs of the same weight and varying the shaft speed in evenly spaced increments from 10% below to 10% above the estimated shaft speed for the experiment. This procedure is carried out at the start and end of the test program. The mean friction torque for the given shaft speed is deducted from the measured shaft torque and used to compute delivered power.
IOT also measures shaft torque full scale however deducting the bearing friction torque induced by bearings fitted aft of the strain gages is not so convenient. To ascertain a zero torque offset, ITTC recommends that the shaft be ‘jacked’ ahead and astern by engaging a small electric motor fitted for this purpose as described in Reference 14:
The shaft is jacked both ahead and astern and the average of the readings noted. The zeros are set at the midpoint of the torque required to jack each shaft ahead and the torque required to jack each shaft astern. Setting the zero in this manner means that the torque measured with the ship under
way includes the torque required to overcome any bearing friction.
This statement in the ITTC standard implies that after performing the shafting jacking procedure and obtaining the zero torque, the measured torque can be used to compute delivered power. This assumes that the friction torque at near zero shaft speed does not vary with increasing shaft speed – a highly unlikely assumption. If no other information is available, IOT will typically apply the following correction to determine delivered power from measured shaft power:
PD = 0.98*PS
If the vessel is fitted with external shaft brackets: PD = 0.975*PS
This method of estimating delivered power from shaft power does not take into consideration the many factors that could impact on shaft bearing friction such as bearing type, lubrication, bearing surface area, maintenance record, relationship between shaft speed and friction etc. To improve the delivered power estimate, perhaps bearing manufacturers could be persuaded to provide an estimate of the bearing friction as a function of shaft speed when the ship is built. Water Density:
During the ‘Lauzier’ trial, the draft and water density at the dock were recorded prior to the trial and after the vessel returned to the dock. The water density was also measured in the trials area. Significant differences in water density between the dock where the draft is recorded and the trials area can occur if:
- either the departure port or the trials area is near a fresh water/salt water interface – especially if there is a tidal influence; or
- the trials area is near fresh water ice or iceberg infested waters where there is a melt water induced measurable local density gradient.
Correcting the trials draft for the influence of water density can improve the overall ship/model correlation.
Ship Condition:
As any trial progresses, the vessel is burning fuel oil and using other consumables. This may result in some a small change in draft, list and/or trim. Other activities being carried out by the crew during a trial may also have an undesirable impact on the ship’s condition. To improve the overall data correlation, it is recommended that an effort be made to minimize any change in the disposition of weight on the ship over the time frame of a sea trial by:
- refraining from transferring fluids (fuel oil, lubricating oil, potable water, ballast water etc.) from one tank to another during the trial; - refraining for washing down decks or cargo
- pumping all bilges prior to the trial and refraining from pumping bilges or operating an oily water separator during the trial; - refraining from flight operations during a trial
if the vessel carries a helicopter;
- refraining from deploying any tow body, submersible or, for warships, weapons fire; and
- not carrying out trials if there is ice accumulating on the ship’s superstructure.
CONCLUSIONS
In conclusion, IOT is reviewing a number of factors that influence the ship/model correlation and is in the process of preparing standard procedures for carrying out propulsion, seakeeping and manoeuvring trials based on guidelines provided by SNAME and the ITTC as well as IOT experience derived from recent trials experience. Once these standards are reviewed and approved by the IOT Standards Committee, an effort will be made to perform an uncertainty analysis on each standard trial.
ACKNOWLEDGMENTS
The author would like to thank the technical support staff at IOT for their assistance during these trials - especially the electronics staff for successfully applying the strain gages to the propulsion shafts under less than ideal conditions, IOT divers for carrying out a hull roughness survey in the contaminated waters of Conception Bay and Jack Foley from the MUN Physical Oceanography Group for his assistance in designing and compiling the wave buoy mooring. In addition, the guidance provided from Dr. Bass and Dr. Bose of Memorial University, funding support from NSERC and the support of the officers and crew of the M/V Louis M. Lauzier was much appreciated.
REFERENCES
1. “Full Scale Measurements, Speed and Power Trials, Trial Conduct”, ITTC Recommended Procedures 2002, 7.5-04-01-01.6, Rev. 1.0.
2. “Guide for Sea Trials – 1989”, SNAME Technical & Research Bulletin 3-47, SNAME Publication, Jersey City, NJ, June 1990.
3. Lloyd, A.R.J.M.,”SEAKEEPING: Ship Behaviour in Rough Weather”, Ellis Horwood Ltd., UK, 1989. 4. Proc. 22nd ITTC, Vol. II, Seoul, Korea & Shanghai,
China, September 5-11, 1999, pp. 505.
5. Sea Image Communications Ltd. web site describing the WaMoS II® Wave and Surface Current Monitoring System: www.wave-radar.com/wamos_intro.htm
January 2004.
6. MIROS A/S web site describing the SM-050 Motion Compensated Directional Wave and Surface Current Radar: www.miros.no January 2004.
7. Trimble Navigation Ltd. web site:
www.trimble.com/gps/errorsources.html, 2003. 8. ITTC Recommended Procedures, “Model
Manufacture – Ship Models”, 7.5-01-01-01, 2002. 9. “Construction of Models of Ships, Offshore
Structures and Propellers”, IOT Standard Test Method GM-1, V8.0, publication pending approval.
10. “Shipbuilding and Repair Quality Standard”, IACS Standard No. 47, August 1999.
11. Subramanian, C.S., Shinjo, N., Gangadharan, S.N.,”A Study of Hydrodynamic Characteristics of Boundary Layer With Algae Roughness”, Marine Technology, SNAME Publication, Vol. 41, No. 2, April 2004. 12. Subramanian, C.S., Ostrem, T.M., Gangadharan,
S.N.,”Noncontact Measurement of Marine Biofouling Roughness”, Marine Technology, SNAME Publication, Vol. 41, No. 2, April 2004.
13. Canadian National Defence Standard: “Hydrodynamic Model Tests and Sea Trials”, D-03-002-009/SG-001, November 27, 1992, p. 3-4-3.
14. ITTC Recommended Procedures, “Full Scale Measurements, Speed and Power Trials, Instrumentation Installation and Calibration”, 7.5-0.4-01-01.4, 2002.
TABLE 3: SHIP, MANUFACTURING TOLERANCES
FIGURE 1: M/V LOUIS M. LAUZIER
For 6 m long models of typical ships:
Ship Manufacturing Tolerance
IACS ITTC IOT L (m) B (m) Scale L (mm) B (mm) L (mm) B (mm) L (mm) B (mm) M/V Louis M. Lauzier 40 8.2 6.67 N/A N/A +/- 20.0 +/- 6.67 +/- 20.0 +/- 6.67 Typical Frigate 134 16.4 22.33 +/- 67.0 +/- 15 +/- 67.0 +/- 22.33 +/- 67.0 +/- 22.33 Great Lakes Bulk Carrier 219.5 23.8 36.58 +/- 109.75 +/- 15 +/- 109.75 +/- 36.58 +/- 109.75 +/- 36.58 Typical Cruise Ship 295 32 49.17 +/- 147.5 +/- 15 +/- 147.5 +/- 49.17 +/- 147.5 +/- 49.17 Typical Supertanker 333 56 55.50 +/- 166.5 +/- 15 +/- 166.5 +/- 55.5 +/- 166.5 +/- 55.5
Model Manufacturing Tolerance Model IACS ITTC IOT L (m) B (m) Scale L (m) B (m) L (mm) B (mm) L (mm) B (mm) L (mm) B (mm) M/V Louis M. Lauzier 40 8.2 6.67 6.0 1.23 N/A N/A +/- 3 +/- 1 +/- 3 +/- 1 Typical Frigate 134 16.4 22.33 6.0 0.73 +/- 3 +/- 0.67 +/- 3 +/- 1 +/- 3 +/- 1 Great Lakes Bulk Carrier 219.5 23.8 36.58 6.0 0.65 +/- 3 +/- 0.41 +/- 3 +/- 1 +/- 3 +/- 1 Typical Cruise Ship 295 32 49.17 6.0 0.65 +/- 3 +/- 0.31 +/- 3 +/- 1 +/- 3 +/- 1 Typical Supertanker 333 56 55.50 6.0 1.01 +/- 3 +/- 0.27 +/- 3 +/- 1 +/- 3 +/- 1 NOTE: IACS tolerance on ship length (50 mm per 100 m length) only applicable to ships > 100 m in length.
IACS tolerance on ship breadth (+/- 15 mm) only applicable to ships > 15 m in breadth. ITTC tolerance is +/- 1 mm on breadth & +/- 0.05% or +/- 1 mm on length whichever is larger. IOT tolerance is +/- 1 mm on dimensions < 2000 mm & +/- 0.05% on dimensions > 2000 mm.
FIGURE 2: M/V LOUIS M. LAUZIER – BULBOUS BOW
FIGURE 5: M/V LOUIS M. LAUZIER – LINES PLANS