Publisher’s version / Version de l'éditeur:
Vous avez des questions? Nous pouvons vous aider. Pour communiquer directement avec un auteur, consultez la première page de la revue dans laquelle son article a été publié afin de trouver ses coordonnées. Si vous n’arrivez pas à les repérer, communiquez avec nous à PublicationsArchive-ArchivesPublications@nrc-cnrc.gc.ca.
Questions? Contact the NRC Publications Archive team at
PublicationsArchive-ArchivesPublications@nrc-cnrc.gc.ca. If you wish to email the authors directly, please see the first page of the publication for their contact information.
https://publications-cnrc.canada.ca/fra/droits
L’accès à ce site Web et l’utilisation de son contenu sont assujettis aux conditions présentées dans le site LISEZ CES CONDITIONS ATTENTIVEMENT AVANT D’UTILISER CE SITE WEB.
Electronic Business and Education: Recent Advances in the Internet
Infrastructure, 12, pp. 249-284, 2001-01-01
READ THESE TERMS AND CONDITIONS CAREFULLY BEFORE USING THIS WEBSITE. https://nrc-publications.canada.ca/eng/copyright
NRC Publications Archive Record / Notice des Archives des publications du CNRC : https://nrc-publications.canada.ca/eng/view/object/?id=9608c2a0-3fb7-4893-af41-412c0b6c1c8c https://publications-cnrc.canada.ca/fra/voir/objet/?id=9608c2a0-3fb7-4893-af41-412c0b6c1c8c
NRC Publications Archive
Archives des publications du CNRC
Access and use of this website and the material on it are subject to the Terms and Conditions set forth at
Virtual reality and content-based management of three-dimensional
objects for e-business
Chapter 12
VIRTUAL REALITY AND CONTENT-BASED
MANAGEMENT OF THREE-DIMENSIONAL
OBJECTS FOR E-BUSINESS
Eric Paquet, Anne Parent and Marc Rioux
Visual Information Technology, National Research Council, Ottawa, Canada
1. INTRODUCTION
Three-dimensional objects are relatively new in E-business [1]. Most if not all E-commerce sites rely principally on text and images. More recently, video has made an apparition with the introduction of broadcast video. There have been many attempts to introduce three-dimensional objects in E-commerce sites. Although many of those technologies look very promising, none of them has been successful: at least from a commercial point of view. There are many reasons for that. The E-business world [2] is closely related to the advertising industry. This industry has relied, for the past fifty years, on text and images. Every step in the chain is fully controlled from market studies, content creation to broadcast. All required standards are well established and defined so that information can be easily exchanged. Images and videos can be created and manipulated very efficiently because the corresponding sensors and softwares are mature technologies. By comparison, three-dimensional modelling and visualisation is still in its infancy.
Nevertheless there are many reasons why the industry would like to move to the third dimension. Up to about ten years ago, three-dimensional modelling and visualisation were a stronghold of specialists. They were mainly used in scientific and medical visualisation and in computer-aided design or CAD. Very few computers were able to handle the large amount of calculations necessary in order to perform real-time rendering. The situation started to change when the movie industry asked for special effects in three-dimension. This demand favoured the development of systems capable of performing modelling, design, animation and virtualisation in three-dimension. Furthermore, the movie industry has favoured the synergy between
three-dimensional technology, advertising, art and business: a condition sine qua non for the application of three-dimensional technologies in the field of E-business.
The second major event was the advent of the game industry. Computer games are part of the life of most children and teenagers. Nowadays, most of those games are in three-dimension, which means that three-dimensional concepts are becoming natural and intuitive. Furthermore, the game industry has favoured the development of affordable and high performance graphic cards. That means that most personal computers are now equipped with the right hardware for handling three-dimensional scenes in real time: at least up to a certain resolution.
In order to be able to move to E-commerce, three-dimensional technology had first to move to the Web. In order to move to the Web, a common file format needed to be defined in order to be able to exchange three-dimensional information. The VRML Consortium, who created the virtual reality modelling language or VRML, undertook this task. Not only the Consortium created the format but it also introduced the concept of a freely available VRML browser. In many aspects, VRML was ahead of his time but the standard did and still suffers from a major drawback: the file size. VRML is a very inefficient ASCII format. Despite of the fact that the bandwidth over the Internet has improved dramatically over the past few years, the download time remains unacceptable for most users and applications. The Consortium addressed this problem by developing a binary format but for many reasons, it never came out. The Consortium, who changed its name to Web3D, is currently working on a new format called X3D. This format is very similar to XML: it defines the basic geometrical elements, supports the definition of new elements and allows the definition of a grammar that governs their relationships. Consequently, X3D can be utilised for defining new three-dimensional formats. Nevertheless, X3D suffers from the same limitation than VRML: the size of the ASCII file.
Some private corporations have decided to create their own proprietary format. The most common is the metastream TM format from MetaCreations
TM
. This format is binary and adaptive. That means that the resolution of the displayed three-dimensional object is chosen according to the speed of the user’s graphic card. This also means that the file can be rapidly transferred over the Internet. Not only the format is adaptive but it is also progressive. If one downloads a VRML file, he has to wait until the operation is completed in order to be able to visualise the file. With metastream TM, the file can be seen right from the beginning: the resolution of the displayed object is increased as information arrives. A similar behaviour can be observed in JPEG. An attempt has been made to create an international multimedia standard that would be able to handle all kinds of media including three-dimensional
objects: MPEG-4. The new standard, which is very impressive from many aspects, is making its debuts in the industry. MPEG-4 provides a binary format called BIFF that integrates sound, image, video and three-dimensional objects. It is possible to synchronise those objects and to make them interact with each other. From the three-dimensional point of view, the structure of MPEG-4 is very similar to the one of VRML. MPEG-4 can also support face and body animation: a characteristic very useful for avatars and virtual mannequins.
Realistic rendering of three-dimensional objects is a very important issue. Magazines have accustomed customers to very high quality pictures. Most of them expect the see the same quality in three-dimensional rendering. This is very important because at a certain point, the customer has to identify the virtualised object with the real object in order to be able to complete the transaction. One of the problems is that most three-dimensional objects are created with a computer. Very often they have a toy-like or plastic-like aspect because of the limitations of the model used to represent the colours and the materials. Nevertheless this problem can be easily corrected by using the most recent techniques for rendering, by scanning in three-dimensions the real objects or by simply mapping real pictures or textures on the three-dimensional geometry.
Different techniques are available for scanning. One can use a laser scanner, stereo vision, time of flight or photogrammetry. The laser scanner scanned the object with a laser: the third dimension is obtained from the position of the reflected beam on a sensor by triangulation. In the stereo vision system, a second sensor replaces the laser. The third dimension is obtained from the positions of corresponding points on the two sensors. The time of flight system measures the time taken by a laser pulse to make a round trip between the sensor and the object. Because of the high speed of light, modulation techniques are used to measure indirectly the duration of the motion. Photogrammetry reconstructs three-dimensional objects and scenes from a set of pictures. The user specifies common points between two pictures and the system calculates the three-dimensional co-ordinates by using triangulation. It is very convenient because the only hardware needed is a standard digital camera. Some systems are more adapted for large objects and scenes while some offer more precision: the right choice depends on the application.
Good rendering is not enough. It is useless to have outstanding rendering if the customer cannot find what he wants: consequently searching is also very important. It is the objective of this chapter to deal with those issues. A technique for searching three-dimensional object databases based on shape is first presented. It is shown how this technique can favour the E-commerce process. A real life case is then analysed: the international CAESAR TM
Project and the virtual mannequin. Finally a dedicated environment for three-dimensional E-commerce is presented: The Virtual Boutique. The Virtual Boutique supports realistic and fast rendering, extensive manipulation, reconfiguration and searching capability. The Virtual Boutique is finally evaluated with MADIS: a design advisor for E-commerce. Some interesting references in the field can be found in [3-6].
2. SEARCHING IN THREE-DIMENSIONS
The Visual Information Technology Group from the National Research Council of Canada has developed a system that can describe automatically the shape, scale and colour distribution of a large set of three-dimensional objects [7-10]. The information about each object is written in a descriptor. The descriptor is an abstract representation of the shape and colour distribution of the object. The descriptor is very compact: the size ranges from 200 to 800 bytes depending on the complexity of the description. The size of the descriptor is totally independent on the size of the original three-dimensional file. A file can represent an object, a part, a person or a scene. The number of objects can easily reach 100,000 objects without compromising the system performances. The system can collect three-dimensional objects from a file system or from the Internet. It can be deployed on our dedicated object oriented database or on a commercial object-relational database like Oracle8i
TM
. The search engine can run as a stand-alone application or on an application server. In the later case, the search engine can be accessed from anywhere over the Internet.
3. DESCRIPTORS
The descriptor should not depend on the orientation of the original object otherwise it would be useless. In order to achieve that, a reference frame that is orientation independent is defined. This reference frame is used to compute all the other shape-related descriptors. In order to perform the calculations, it is assumed that a triangular mesh can represent each model. A triangular mesh is simply a set of connected triangles representing the surface of the object. This is not a restrictive assumption because any cloud of points and any mesh can be converted to a triangular mesh if required. It can also be demonstrated that for any parametric surface representation, like non-uniform rational B-splines or NURBS, it is possible to define a triangular mesh representation. Most of the time, our system can perform automatically those conversions.
3.1 Reference frame
The reference frame is obtained by computing the principal axis of the tensor of inertia. The tensor of inertia is defined as
[ ]
=[
(
−)(
−)
]
=∑
= n i CM i CM i qr S q q r r n I I i 1 1 (1)where Si is the surface of a triangular face, CM is the centre of mass of the
object and q and r are equal to the co-ordinates x, y and z. The principal axes correspond to the Eigen vectors of the tensor of inertia
[
I
a
i=
λ
ia
i]
i=1,2,3 (2)It can be shown that the normalised principal axes are translation, scale and rotation invariant. The axes are identified by their corresponding Eigen values. The Eigen vectors are labelled A, B and C in ascending order of the corresponding Eigen values. The tensor of inertia is not invariant to mirror symmetry. Computing the statistical distribution of the mass around each principal axis solves this problem.
3.2 Scale
Even if it is a simple criterion, the scale is a powerful criterion to filter in and out objects. If one is looking for an object of the size of a screwdriver, it is very easy to discard unrelated objects just based on the scale. A bounding box describes the scale. It is the smallest box that can contain the whole model. The axes of the box are parallel to the principal axes of the object. A rough description of the mass distribution inside the box can be obtained from the corresponding Eigen values.
3.2 Normal vectors
A first description of the shape can be obtained from the distribution of the normal vectors. The angles between the normal vectors and the first two principal axes are defined as
⋅ = − q q a n a n 1 cos q α (3) where
[
(
) (
)
]
(
2 1) (
3 1)
1 3 1 2 r r r r r r r r n − × − − × − = (4) In order to describe the normal vectors, three histograms are used: histogram of the first, second and third kind depending on the complexity of thedescription. The histogram of the first kind is defined as h (αq) where q= 1
and 2. This histogram does not distinguish between the two angles and does not take into account the relations between them. Because of that, it has a low discrimination capability. The histogram of the second kind is made out of two histograms: one for each angle. Thus, it distinguishes the angles but it does not establish any relation between them. The histogram of the third kind is a bidimensional histogram defined as h (α1, α2). Not only it distinguishes
between the angles but it also maps the relation between them.
3.4 Cords
Most of the time, normal vectors are very sensitive to local variation of shape. In some cases, this may cause severe drawbacks. Let us consider an example: a pyramid and a step pyramid. In the case of the pyramid, the orientations of the normal vectors are the same for all triangles belonging to a given face while, in the case of the step pyramid, they have two well-defined orientations corresponding to those of the steps. The histograms corresponding to those pyramids are very distinct although both objects have a very similar global shape. In order to solve this problem, the concept of a cord vector is introduced. A cord is defined as a vector that goes from the centre of mass of the model to the centre of mass of a given triangle. The cord is not a unit vector since it has a length. As opposed to a normal, a cord can be considered as a regional characteristic. If the pyramid and the step pyramid are taken as an example, it can be seen that the cord orientation changes slowly on a given region, while the normal orientation can have important variations. As for normal vectors, the statistical distribution of the orientations can be represented by three histograms namely: histogram of the first, second and third kind. Since the cord has a length, it is also possible to describe the statistical distribution of the length of the cords by a histogram. This histogram is scale-dependent but it can be made scale-independent, by normalising the scale: zero corresponding to the shortest cord and one to the longest.
3.5 Wavelets
Explicitly or implicitly, three-dimensional models are perceived as made out of surfaces. From a certain point of view this is true but at the same time it should not be forgotten that a three-dimensional object also occupied a volume and should be analysed as such [11]. In a 3D discrete representation, the building blocks are called voxels, a short hand for volume elements. Using such a representation, it is possible to binarize a three-dimensional model. The idea is simply to map the model’s co-ordinates to the discrete voxel co-ordinates
x y z i j k x y z ⇒ ∆ ∆ ∆ (5)
Where the ∆’s are the dimensions of the voxel and i, j and k are the discrete co-ordinates. If the density of points in the original model is not high enough, it may be necessary to interpolate the original model in order to generate more points and to obtain a more precise description in the voxel space.
It has been chosen to perform the analysis of the volumetric representation with a wavelet transform [12]. There are many reasons for that: recent experiments tend to demonstrate that the human eye would perform a kind of wavelet transform. This would also mean that the brain would perform a part of its analysis based on such a transform. Since from the user point of view our system should mimic the human system, this is clearly a good direction to investigate. The wavelet transform performs a multiscale analysis. Multiscale means that the model is analysed at different levels of detail. There is a fast implementation of the wavelet transform that makes it possible to perform the calculations very rapidly. The fast wavelet transform is an orthogonal transformation meaning that its base is orthogonal. The elements of the base are characterised by their scale and position. Each element of the base is bounded in space, which means that it occupies a well-defined region. This also means that the analysis performed by the wavelet transform is local and that the size of the analysed region depends on the scale of the wavelet. The one-dimensional wavelet is defined as
(
)
2jw 2jq−n n j Z, ∈ (6) For our purpose DAU4 or Daubechies-4 wavelets are used. The matrix corresponding to the one-dimensional transform is
W c c c c c c c c c c c c c c c c c c c c c c c c c c c c c c c c = − − − − − − − − 0 1 2 3 3 2 1 0 0 1 2 3 3 2 1 0 0 1 2 3 3 2 1 0 2 3 0 1 1 0 3 2 O (7)
where
(
)
(
)
(
)
( )
c c c c 0 1 2 4 1 3 4 2 3 3 4 2 3 3 4 2 11 3 4 2 = + = + = − = (8)From equation (9) it is possible to define
[
]
H∴ c0 c1 c2 c3 (9)
[
]
G∴c3 −c2 c1 −c0 (10) The doublet H and G is a quadrature mirror filter. H can be considered as a smoothing filter while G is a filter having two vanishing statistical moments. That means that this filter yields a zero response to sufficiently smooth data. The one dimensional wavelet transform is computed by applying the wavelet transform matrix hierarchically, first on the full vector of length N, then to the N/2 values smoothed by H, then the N/4 values smoothed again by H until two components remain. In order to compute the wavelet transform in three dimensions, the array is applied sequentially on the first dimension then on the second dimension and finally on the third.
The set of wavelet coefficients represents a tremendous amount of information. In order to reduce this information, the coefficients are first normalised at each level of detail in order to enhance the coefficients corresponding to smaller details. The coefficients are then integrated at each level of detail. A histogram representing the distribution of the signal at different level of detail is then constructed: the vertical axis represents the total amount of signal at a given level and the horizontal axis represents the level of detail. It is important to notice that each level in the histogram represents in fact a triplet of values in the wavelet space.
3.6 Colour
In the following, it is assumed that the model has been computer generated or, if a sensor has acquired the object, the colours have been corrected in order to take into account the ambient illumination. If one is not interested in colour location, the description of their distribution is very simple and can be obtained from a set of histograms. The vertical scale of these histograms corresponds to the occurrence of a given colour while the horizontal scale represents the normalised intensity of the colour. Among the best candidates for the colour space is the hue-saturation-value or HSV space: this space is
cylindrical representation of the RGB space. The red-green-blue or RGB space should not be used because of its insufficient discrimination capability [13]. Because of the sensibility of the human eye, some regions of this space tend to be overused while others have a sparse population.
If one is interested in the location of the colours and their relations with the geometry, it is possible to generalise the wavelet approach in six dimensions: x, y, z, H, S, and V. In order to computer the wavelet transform, the model is first binarized
[
x, y,z,H,S ,V]
⇒[
i∆x j∆y k∆z l∆H m∆S n∆V]
(11)The six-dimensional wavelet transform is then computed. The array is transformed sequentially on the first dimension, then on the second dimension and so on. The wavelet coefficients are normalised at each level of detail and then integrated. The statistical distribution of the signal is presented under the form of a histogram. The horizontal axis of this histogram represents the level of detail while the vertical axis corresponds to the accumulated signal.
3.7 Colour distribution
One of the most common models in computer graphic is the so-called Phong model. It is generally defined as
( ) ( )
[
f]
s d s r r I I ≈ s⋅n + r⋅v (12) where( )
( )
s n n s n n s s r ⋅ + − ⋅ + − = 2 2 (13)and where n is a unit normal at a given point, s is a unit vector from the same point to the light source, v is a vector in the direction of the observer, r is a unit vector that indicates the direction that would be taken by the reflected light if the material would have a perfect reflectivity, f is a measure of the specularity of the surface, Is is the source intensity, rd is the diffuse
reflectivity and rs is the specular reflectivity. The diffuse reflectivity is in fact
the Lambertian part of the reflected light while the specular reflectivity depends on the direction of observation. There are diffuse and specular reflectivity coefficients for the red, blue and green components of the light. This lighting model is more empirical than physical and consequently should be considered as an approximation. Nevertheless, it has shown itself to be quite successful in realistically representing some materials. It is thus possible to identify a given material M by a set of seven coefficients
[
]
M∴ Rd Gd Bd Rs Gs Bs f (14) where R, G and B stand for red, green and blue. All these coefficients are defined on the interval [0,1]. If the model is made out of one material, these coefficients constitute an acceptable definition of it. If the model is made of different kinds of materials, then it is possible to represent the statistical distribution of these materials by a set of seven histograms. Again it is important to notice that, in order to have an acceptable discrimination, the diffuse colour, the specular colour and the corresponding histograms should be mapped in the HSV space
3.8 Texture
The texture can be seen in two different ways: as a pattern that is mapped on an object or as the complete colour description of the object. Most of the time, the texture is an intensity, RGB or RGBA image. Transparency A is not considered here. The texture is usually represented on a bidimensional orthogonal system. The co-ordinates, named S and T, are normalised. If in addition the model has a material it is possible to obtain the resulting colours by modulating the diffuse colours of the model by the texture map
R G B R R G G B B out out out d tex d tex d tex = (15)
The colour distribution of the model can be obtained by calculating the histograms of the hue, saturation and value distributions: the values are obtained by converting the colours from the RGB space to the HSV space.
4. SYNERGY
Up this point the scale, the shape and the colour distribution have been analysed as separate entities. Of course if one is performing a search in a database, he may be interested in using many of those criterion [14]. For example the user can ask: “I would like an object of this size, looking like this one with a bit of blue but the blue is not that important”.
Our task is to translate such a query, into a simple “interface language”. The interface can present a list made of out the scale, shape and colour in which the user indicates the required characteristics. The last part of the sentence is about the relative weight of each parameter. According to this sentence, a low weight should be given to the colour parameter.
Basically the weight can be used in two different ways: they can be applied to the error or to the rank. In the first case, an error is computed for the scale, the shape and the colour and a global error is defined. In the simplest case it can be
(
)
err w err w err w err
w w w
global
scale scale shape shape color color
scale shape color
= + +
+ + (16)
The problem with this approach is that the sensitivity of the scale, shape and colour algorithms may be quite different. Thus the parameter with the highest sensitivity may have the dominant effect. The other possibility is to replace the error by the rank. The classification is made separately for the scale, shape and colour. Then the global rank is determined as follows:
(
)
rank w rank w rank w rank
w w w
global
scale scale shape shape color color
scale shape color
= + +
+ + (17)
Of course, the latest approach involves much more calculations. Two basic problems need to be solved: the choice of the metric and the number of channels or bins in each histogram [15-17]. In order to determine the outcome of the search, the closest histograms to the reference histogram has to be found in the multidimensional space in which each histogram can be seen as an N-dimensional point. Recent studies have shown that only the Hamming L-1 and the Euclidean distance L-2 should be used. Any other metric is meaningless as far as the similarity is involved. The reason is that, from a statistical point of view, the points become equidistant if a metric L-N with N greater than 2 is used. Those studies have also shown that the number of bins should be kept as small as possible. If the number of bins become too important, the points concentrate on a small volume of the space and the discrimination capability drops very rapidly. Not only the discrimination is lost but also the probability to obtain false trues becomes important.
It is possible to reduce this undesirable effect by reducing the number of bins; but then some information is lost and the sampling can become inadequate. Although it is not clear at the moment, those results may indicate that the use of metrics may not be the best way to compare histograms. A histogram can be seen as a distribution. In such a case the metric can be replaced by a hypothesis test that determines if the candidate histogram has a distribution similar to the one of the reference histogram within a given confidence interval. Under certain assumptions, the Chi square test is potentially a good candidate.
5. THE SYSTEM
The system is made out of three parts: the crawler, the analyser and the search engine. The crawler who is also called spider or Web robot collects all the relevant three-dimensional files [18]. Those files can be located on a disc, on a local network, an Intranet or on the Internet. The user can specify the directories and the URLs. While crawling over the Internet, the robot uses the hyperlinks to cover gradually the portion of the Web that has been devoted to him. The crawler has many advantages compare to the standard storage approach. It allows working with different systems of classification or even with no classification at all. The files can be moved and updated as desired since the crawler can keep trace of their locations as often as required.
The second part of the system is the analyser. The analyser reads each file and parses the three-dimensional information. This information include the vertex positions, normal vector orientations, texture co-ordinates, texture maps and materials. All this information is mapped to our internal format. If a triangular mesh does not represent the object, the surface of the object is first converted to a triangular mesh using a callback function. This is done automatically for elementary surfaces, NURBS and polygonal meshes. Once the parsing operation is completed, the descriptors are calculated and saved in a compressed representation. A thumbnail is also generated. This thumbnail is used as an abstract or compact representation for the three-dimensional object that can be easily manipulated and carried over the network. Once all the descriptors have been computed an object oriented database is created. The object database used has been designed and optimised for this specific application. From the object database, an object-relational database can be created on a commercial database like Oracle8i. A custom made loader converts and reformats the object database in order to write it as a set of tables. Any database that supports Java Database Connectivity or JDBC is a suitable candidate for the loader.
The last part of the system is the search engine. The search engine provides the interface and the business logic between the interface and the database. The search engine is designed as a three tiers system. It is made of the client, the search engine logic and the database. The client can be an applet or an HTML form. The second tier is a Java servlet, a C++ Common Gateway Interface or CGI application or an Enterprise Java Beans or EJB. The third tier is the database.
6. APPLICATION TO E
-BUSINESS AND E
-COMMERCE
6.1 Generic databases: Alexandria
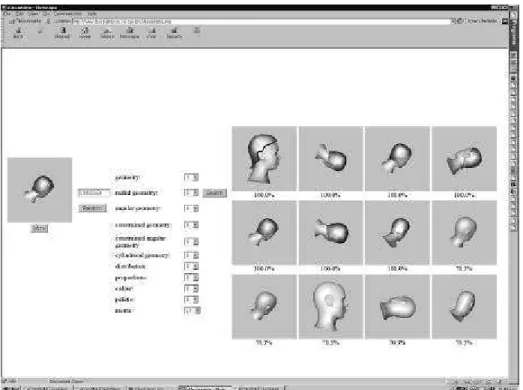
Alexandria is our system for generic three-dimensional object databases. A typical interface is shown below. It is made out of four sections: the
reference, the file, the method and the result section. The first section represents the reference object as a thumbnail. Depending on the interface the reference object can be any object belonging to the database or an object from the outside world. The second section is made of the input file field and the random button that can be used to sample randomly the database. The third section is used to attribute a specific weight to each algorithm or method. The last section presents the outcome of the search. Again the object are shown as thumbnail because it is much faster to transfer a small picture over the network than a three-dimensional object.
Figure 1. Query for a head.
The first three figures show some results obtained from a database composed of 4,500 VRML objects. This database is made out of a variety of three-dimensional models including animals, planes, cars, humans, tools and common objects. Figure 1 shows the query for a head, figure 2 shows the query for a car and figure 3 shows the query for a fighting plane. It should be noticed that similar objects could be found irrespectively of their orientation. This characteristic comes from the reference frame used to compute the descriptors. The system shows the twelve closest matches. It is possible to obtain the next twelve matches by pressing “more”.
The system can also handle, up to a certain point, non-rigid objects. The reason is that for many of those objects, a portion of the shape remains
relatively unchanged when the object is animated. This is the case for the human head: the skull remains almost static when the face is animated. Because of their statistical nature, the descriptors remain relatively stable when such animation is performed within reasonable limits. This capability is very useful for managing three-dimensional object databases in the field of animation. The search engine can be used in many applications like searching artefacts in a museum collection or parts in a CAD database both for design and maintenance or simply selling mechanical parts on the Web.
Figure 2. Query for a car.
On a local network, each query takes less then one second on a dual processor workstation. If desired, it is possible to refine the search by clicking on any thumbnail belonging to the result section. This allows the user to easily navigate through the solution space and rapidly converge to the desire solution. The solution space can be seen as a set of clusters. Similar objects tend to agglomerate together and to form a cluster in the N dimensional space. If the cluster is compact, the class is properly defined but if it is not the case, it means that the class is under-defined. If the user starts with an object within the cluster he may obtain the desire solution after a single query. If the object is located in the outer region of the cluster, the user may need to perform another search by using one of the closest matches as the reference model. By applying those operation of few times, it is possible to rapidly converge to the desire or at least to the best possible solution. This
paradigm integrates the user into the loops and allows him to help the search engine by imputing its understanding and knowledge about the operation in a very simple and intuitive way. Furthermore, the description is not language dependent: it means that the system can be utilised in France, China, Germany or Japan without having to translate any descriptor. This is a clear advantage over the classical text-based approach especially in the context of the globalisation of the economy.
Figure 3. Query for a plane.
6.2
The CAESAR
TMProject: Cleopatra
The CAESAR TM Project is an international anthropometric survey that is carried on in the United States, Italy, Netherlands and Canada. This survey involves thousands of individuals in each country. For each individual, a series of anthropometric measurements is performed and questions of demographic nature are asked like family income, car brand, perception of height, etc. What makes the originality of this survey is that each person is scanned in three dimensions by using a body scanner [19]. Different types of technologies are used but they are all built around the same principles: one or more laser scanners move along a rigid frame and capture a full register body scan in a few seconds time. Each subject is scanned in three anthropometric poses. The CAESAR TM Project is sponsored by the US Air Force and involves about 25 contributing companies mainly from the transportation and
the apparel industry like Boeing and Daimler-Chrysler. The goal of the operation is to design clothes that will fit us better, more comfortable seats in public transportation and more ergonomic cars.
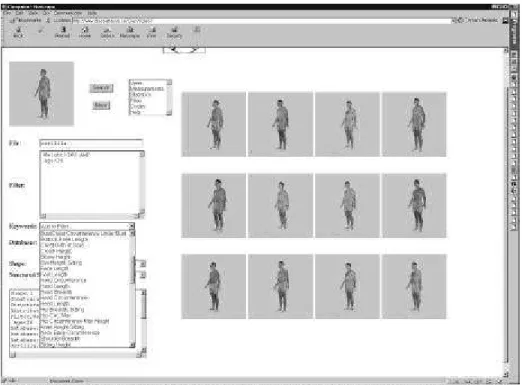
Figure 4. Query for similar bodies. The filtering constraints are: the subject must be a male with weight greater then 160 pounds and age under 30.
A dedicated version of Alexandria named Cleopatra has been created for the CAESAR Project. Cleopatra can interrogate the database using three-dimensional shape, anthropometric measurements and demographic data. From the shape point of view, it works in a very similar way to Alexandria. The measurements and the demographic data are used as a set of filters. The system first filters in and out the bodies according to the constraints that appears in the filter and then constraints further the search by three-dimensional shape. Let us consider figure 4. The system is looking for bodies similar to the one appearing on the left side. The individuals must be males weighting more then 160 ponds and being under 30 years old: this is the filter. The system first retrieves all individuals that satisfy the constraints that appear in the filter and then performs a query by shape on those individuals. This paradigm allows us to integrate in a single tool the classical search by data approach and the most recent query by shape. This paradigm can be applied to any database in which data are associated with three-dimensional objects. The implementation shown here run as a Servlet on an
Oracle Application Server while an Oracle8i database contains the measurements, statistical data and the descriptors.
Cleopatra analyses the body has a whole. If a segmentation of the body is available, it is possible to attach a descriptor to each part of the body like the head or the feet. Then, a query by shape can be performed on a specific part. Many parts are of interest like the feet for the shoes industry and the head and hands for hats and gloves production. One interesting feature of Cleopatra is its flexibility: the descriptors can be modified at any time. Suppose one wants to modify the cord descriptor in order to capture some very particular characteristic of the human body. All that has to be done is to modify the algorithms and to reprocess the models: no human intervention is needed and the process is entirely automatic. The approach is similar if one wants to add new descriptors. This is a clear advantage over conventional manual indexing approaches where a modification in the classification structure is almost impossible or at last extremely expensive and time consuming.
The descriptor is also very compact. Its size varies from 120 to 1000 bytes depending on the complexity of the description. The typical size of the thumbnail is 15 Kbytes. This is very small if compared to the size of the human body file, which occupies 20 Mbytes at low resolution. That means that the description introduces almost no storage overhead. The fact that the descriptor is small helps the search engine to process requests at very high speed.
As for Alexandria, the reference body is situated on the left side with the “file” field. The interface indicates the number of matches as well as the similarity. The “keyword” section allows the user to choose the appropriate keywords for the filter from a list. A weight can be attributed to each algorithm. A window also presents the results under a textual form that can be exported into another statistical package for further analysis. It is also possible to access all the measurements and demographic data for a given individual as well as its corresponding three-dimensional file. In the later case, a viewer is automatically started. The request makes full use of the available information: data and three-dimensional. Figure 5 shows the anthropometric measurements for a given individual.
Figure 6 shows the visualisation of the three-dimensional object corresponding to a given individual. Currently the files are in the VRML97 format but they can be converted into another format if desired. The system does not specify the viewer. As a matter of fact, any viewer that supports the format can be utilised. If a high-end viewer is used, it can be possible to edit the body, change the lighting conditions and even introduce additional elements like clothes. The three-dimensional data can also be used to perform
calculations directly on the bodies like automatic extraction of anthropometric data or modelling of the human body with parametric models.
Figure 5. Measurements for a given individual.
6.3 The CAESAR
TMProject, Cleopatra and E-business
Cleopatra is primarily an E-business tool. It is very unlikely that customers will interrogate directly or indirectly the database: from that point of view Cleopatra is not an E-commerce tool. Nevertheless Cleopatra can be very useful in design, calibration and archetype definition each time a human body is involved. First, let us look at the archetypes. Archetypes are standard representations that are used to produce consumer merchandises. Every one of us is familiar with small, medium and large in the clothing industry. It is very important to define those archetypes according to the distribution of the population. If one of the archetypes is badly defined, the corresponding segment of merchandise may remain unsold at the end of the season or may be produced in insufficient quantity. It is very tempting to use averages in order to define those archetypes. But for most of those applications, the average does not correspond to anything real. If one tries to average many human bodies, he ends up with a blob-like structure, which has absolutely nothing to do with a human body. The best way to find archetypes is to locate the clusters within the population. Once the clusters are located and defined, a representative individual is chosen from each one of them: those
representative individuals are the archetypes. Again, it is important not to average the cluster because a three-dimensional average does not correspond to any real individual within the cluster.
Figure 6. Visualisation of a given three-dimensional file.
Calibration is another important application. Instead of trying on clothes in a real store, it is possible to try them on a virtual mannequin. A virtual mannequin is a three-dimensional avatar of the customer. If the shape of the mannequin corresponds closely to the shape of the customer, there is a high probability that the garment will fit the customer. In practice, it is very difficult to generate a mannequin for every customer: the amount of data involved is too large and it can be very difficult to compute the mannequins and to dress them in real time. Time is an important factor in E-commerce: if the waiting time is too long, the consumer may not complete the transaction, which means that the enterprise will loose money. For those reasons, the mannequins have to be created and dressed before any request is sent to the store. In the actual state of the technology, it is very likely that those mannequins will be created with computers. In order to be representative, those mannequins need to be calibrated on the real population. With Cleopatra it is possible to verify if a mannequin belongs to a cluster and to determine it relative position within the cluster. A well-calibrated mannequin will minimise the returns and consequently maximise the profits. Even if the
calibration reduces returns by a few percents, the process is worth because of the large volume involved.
Finally let us take a look at the application of Cleopatra to design. Many consumer devices are design to fit the customer’s body like seats in cars and aeroplanes. Cleopatra can be a very useful tool in order to determine some archetypes from which the design can be performed. Not only Cleopatra can search the database based on three-dimensional shape and anthropometric data but it can also use statistical data. Statistical data are very useful because they are part of the consumer profile. If one designs seats for first class passengers, he might want to take into account the salary of his potential consumers. So it is very important to perform a detailed analysis of the consumer profile. Based on this profile, it is possible to search and to navigate through the database and to find the clusters and the corresponding archetypes. Those archetypes are then used in the design process. Cleopatra can also help to determine the size of a given cluster and consequently the importance of a given market.
7. V
IRTUALREALITY FOR
E-COMMERCE
: THE
V
IRTUALBOUTIQUE
Shopping is by nature an unorganised process: consumers look, touch, compare, and move in what seems to be a random walk. This is because real shopping is based on comparison and query by example: two paradigms that are absent in most E-commerce sites. In a typical transaction, the vendor shows some items of interest to the customer. If none of the items satisfied the customer’s requirements, the vendor shows additional items that can be either similar or related. If the choice becomes too difficult, the customer puts in front of him all the items of interest and tries to reach a conclusion by comparing them. The first situation uses the query by example paradigm: the consumer provides an example and asks the vendor to find similar and related items. The second situation reflects the fact that for most peoples, it is easier to choose on a relative basis than on an absolute basis: that means that the object should not be isolated but put in context.
Figure 8. The Virtual Boutique: various queries.
The Virtual Boutique is searchable and reconfigurable. The search can be performed in two different manners: either by using the three-dimensional shape algorithms described above or by using a lookup table of predefined classifications. The outcome of the search can be displayed by replacing the reference object with the closest match or through a global reconfiguration of the boutique. In the first case the results are displayed in a sequential manner. The consumer selects an object and asks for similar or related objects. The boutique determines the closest match and displays the result by replacing the
original object. All subsequent results are displayed in the same manner. At the end of the process, the initial object is put back in place. This paradigm is very useful if the consumer tries to co-ordinates many objects together. One may want to buy a table, and two sofas. The main problem is to co-ordinate them. By applying this paradigm to many objects, the consumer can evaluate different combinations and determine which one is the most appropriated for him.
In the second case, the consumer can reconfigure the whole boutique with the outcome of the search. All the items of interest are displayed in the boutique. While the first paradigm allows interclass comparison, the second paradigm allows intraclass comparison. Again one may want to buy a chair. If absolute visualisation is used, it can be very difficult to determine which one he likes the most but if relative visualisation is used it is much easier. Relative visualisation is the paradigm that is the most commonly used in real shopping. Of course, the consumer can bounce back and forth between the substitution and the reconfiguration paradigm. Furthermore the boutique is divided in departments: the consumer can select a department according to his interests: furniture, electronic, etc.
Figure 9. Virtualisation of a medieval room for the Virtual Boutique by photogrammetry. Only two pictures were used in the modelling process.
Figure 7 shows the furniture department of the Virtual Boutique. The user can select any item and cycle through them. He can also select some items and reconfigure the boutique. This is illustrated by figure. It is to be noticed that each object can be rotated and moved. That helps the consumer to co-ordinate different objects both from the appearance and spatial point of view. As stated earlier, the replacement and reconfiguration can be done according to a lookup table or with the help of Alexandria. The search engine looks for similar objects according to three-dimensional shape. The lookup table can use any characteristic but those must be entered manually. The search engine can be used to create the lookup table or both searching mechanisms can be implemented within the Virtual Boutique. Both searching mechanisms are very attractive because the description is language independent from the customer point of view. This is an important advantage in today’s global market. A reconfiguration of the boutique shown in figure 7 is shown in figure 8.
The Virtual Boutique combines realistic rendering, multimedia integration, efficient and intuitive navigation and content-based searching capability. The mouse and the keyboard control the navigation. The mouse controls the direction of navigation and the inclination of the head while the keyboard controls the displacements. The displacements include acceleration when the customer starts to move and deceleration when he becomes immobile. The collisions with the wall are elastic and reproduce the effect of a normal collision between a rigid wall and a human body. The lighting is designed in order to favour the visualisation and to create the required atmosphere. The decor can be created with a computer or can be obtained from the virtualisation or digitalisation of a real scene. In the first case, the boutique is designed with modules and panels. With this modular approach it is very easy to rapidly modify a subsection of the decor. In the simplest case, the walls cannot be moved and the user just chooses the painting and paper wall for each panel.
The virtualisation is by far the most innovative solution for creating the decor. Digital pictures of the scene or boutique are taken. From those pictures a three-dimensional representation of the scene is reconstructed by using photogrammetry [20-22]. Even if the underlying mathematical principles are very sophisticated the basic framework is very simple. The camera is first calibrated on an object of known dimensions. Once the calibration is obtained pictures of the scene of interest are taken. It is very important to take those pictures under the same lighting conditions in order to favour a uniform appearance. The scene can be an outdoor scene, a building, a room or a full boutique. Certain rules apply while taking the pictures: there must be an overlapping between the pictures and each picture must be taken from a distinct viewpoint. The farther the distance between the viewpoints the better the quality of the reconstruction. The density of the sampling depends on the
complexity of the scene. While a few pictures are enough for a simple scene, many pictures may be required for a complicated scene. The first step is to determine common or control points between pictures. An algorithm uses those control points and the calibration in order to create a three-dimensional model of the scene. The number of control points determined the resolution of the reconstructed geometry. Most of the time a triangular mesh models the resulting scene. On this mesh, images or textures are mapped. Figure 9 and 10 show the virtualisation of a medieval room and of an atrium with photogrammery. In the case of the medieval room only two pictures were necessary. The medieval room is very interesting because it has an irregular shape: no geometrical primitives are used in the modelling process. Nevertheless the geometrical shape is very simple: most of the appearance in the rendering is obtained from the texture maps.
Figure 10. Virtualisation of an atrium for the Virtual Boutique by photogrammetry.
Rendering is also very important. The quality of the pictures on E-commerce sites is usually very high. Customers are accustomed to this quality and expect a comparable level for three-dimensional objects. Recently, very sophisticated techniques have been developed in order to simulate realistic colours. The problem with those techniques is that they involve a lot of calculations and the rendering cannot be done in real time even with the most powerful computers. The most viable alternative is texture mapping. In this technique, one or many pictures are mapped on the three-dimensional object. Those maps can be created with a computer but it
is also possible to use real pictures in order to obtain a more realistic effect. Figure 11 show the rendering of an ivory bear. It should be noted that the scissors marks could be clearly seen.
Figure 11. Details for the rendering of an ivory bear.
Multimedia integration is also very important [23]. The Virtual Boutique can be made more attractive and more useful by multimedia integration. One may want to access the web page corresponding to an object or a promotional video. The user selects an object and then presses on the HTML or video button in order to access the corresponding media. The video can be streamed or download. The HTML page is particularly adapted to provide text information and images. An example is shown in figure 12.
One of the problems of three-dimensional E-commerce is the time required to download three-dimensional objects. Texture maps can be compressed by using the JPEG standard or the wavelet transform. The shape can also be compressed. In the Virtual Boutique the following technique is used: the object is converted from a triangular mesh representation to a triangular strip representation. That means that the object is peal from top to bottom in a spiral fashion in order to generate strips of triangles. Then, instead of using the absolute locations of the vertices, the relative locations are used. Finally the relative position is coded on a restricted number of bits, saved in a binary format and zipped. Another solution is to cache the decor and the most commonly used objects on the local machine.
Portability is an important issue in E-commerce. Consumers can buy from any platform namely Windows, UNIX, Apple OS or Linux. It is important
that the E-commerce application can run on those platforms or at least can be easily ported on them. The choice of the API for three-dimensional rendering is consequently very important. The OpenGL API is supported by all platforms. On Linux the API is called Mesa but except for the name, it is identical to OpenGL. Windows has its own API called Direct3D, which is integrated within DirectX. Some APIs are built on top of those API. The most important are Open Inventor, Performer and Java 3D. Those API provide object-oriented programming and scene graph. A scene graph is a hierarchical representation of the scene: it contains all the relations and characteristics of each object belonging to the scene. This representation facilitates the control and the manipulation of the scene and can be easily optimised for fast rendering.
Figure 12. Integration of HTML within the Virtual Boutique.
For the Virtual Boutique, the Java 3D API has been used. There are many reasons for that. Java 3D can run on any platform without modification. Java 3D is built on top of two API: OpenGL and Direct3D: that means that it is possible to take advantage of both API without having to rewrite the code. Java 3D can be executed very rapidly: this is because Java 2 code is executed and not interpreted. Java is compiled on the fly with a compiler called just in time compiler or JIT. Because the JIT compiles optimised and platform independent class files, this optimisation can be performed in almost no time. The Java 3D API is also very sophisticated and can handle complicated
problems like synchronisation of events, collisions, high quality rendering and optimisation.
8. MADIS: A DESIGN
ADVISOR FOR
E-COMMERCE
E-commerce site designers face the challenge of providing easy, friendly and convenient access to potential buyers. Indeed, access to products and product information must allow users improved insight by facilitating research, problem solving and decision-making endeavours. Although the internet revolution is now driving consumer-designed products where each customer gets a unique product, current user interfaces for user-driven product design often remain clumsy to operate [24].
The configurator interface is usually in the form of a long list of pull-down menus, each specifying one variable. Such an example is Landsend.com. The interface does not show alternative choices and makes it hard to compare alternative designs. It does not explain the options or teach users to understand the domain of the design problem. In some cases, it can be overwhelming to novice users and require knowledge beyond user’s reach. Buying furniture when planning the layout of a home, show room, trade show-booth or office buildings are likely examples requiring a more complete interface. The product designed should reflect the customer’s unique style and taste. The buyer of a new home will want to visualise his/her living room within a virtual space of the same dimensions, compare and choose furniture and accessories based on colour, fabric, size and cost within the 3D Web site. An interface to the Virtual Boutique should allow objects to be moved around, features such as colours and lighting to be modified at a glance and alternative choices compared. Current user-driven interfaces suggest the need for tools capable of giving advice to consumer designers, of providing alternative solutions, and helping investigate the consequences of design decisions. Current interfaces do not provide assistance in making such design decisions. In this section a MultimediA Discourse System (MADIS) is presented to support user-driven product design. MADIS was developed to provide information users with answers to single or multiple requests related to a given topic using text and 3D graphics. The system aims to tailor its responses to a particular user based on a user profile and a history of previous exchanges. MADIS was first developed as a question-answering facility applied to conceptual database design [25,26], later as a discourse management system applied to interface design and more recently, in collaboration with Protogon Inc. in Montreal, to the design of ship compartments. The following image illustrates a sample knowledge base created by Protogon for the Automatic Design Deficiency Constraint Checker, which was a part of the Navy's "Human Factors Engineering Intelligent
CADD" (HFEICADD) project. The Constraint Checker is an artificial intelligence application used to identify design flaws based on CAD drawings of ship compartments. The design errors found by the Constraint Checker are shown by "glyphs" - interconnected red squares placed on top of the CAD objects that cause problems.
Although several question typologies [27] have been elaborated to respond to the needs of knowledge system users, most typologies lend only limited support to the generation of advice and explanations related to design applications. Indeed, different tasks lead to different types of questions that require different kinds of schemata to answer them. MADIS was developed to offer a much needed typology specific to design-oriented dialogues. It hopes to contribute to better interface design and more specifically, to more flexible dialogue capabilities. Text has been shown to be particularly appropriate to give users directions, for explanations and clarification type interventions that require the manipulation of abstract concepts.
Within the framework of E-commerce applications, MADIS aims to act as an advisor in order to help consumer designers to determine the features of the product they wish to buy. This process involves deciding which aspects are important to the product being designed and how they relate to each other. Within this system, 12 question–types are assumed relevant to product design. The main question categories include Elaboration (e.g. Tell me about <concept>), Enablement (e.g. How do I decide if I should <task>?), Current-Model (Check the validity of <object>), Validation-Future-Model (Should I <task>) and Clarification (e.g. Do you mean that…). A framework for the generation of 11 of the 12 question-types has been implemented.
MADIS is based on a multi-layered dialogue model. The first is an illocutionary model developed by Stein & Thiel [28] for information-seeking dialogues called COR (COnversational Roles). It involves the pragmatics of the dialogue. COR determines legitimate types and sequences of dialogue acts and regulates the role assignment of the partners, the information seeker and the information provider. Dialogue acts include: request, offer, assert, promise, accept, be contented, be discontented, withdraw request, reject offer, withdraw offer and reject request. The second layer consists in a rhetorical model. It involves the semantics of the dialogue. This layer provides the required criteria in order to determine the contents of the co-operative exchanges.
Table 1. Name, generic expression and example of each of the question-types.
User Request System Assert
Question-Type Generic Expression Strategy Tactic Elaboration (general) (specific)
Tell me about <concept>. Tell me about <attribute> of <concept>. Inform Initiate Consolidate Remind Validation (simple) (comparison) Should I <task><concept>? Should I <task><concept> or <task><concept>? Expose Meaning Evaluate Stipulate Enablement (assignment) (decision-action) (decision-comparison) (decision-time) (decision-value)
How do I decide if I should assign <attribute>?
How do I decide if I should <task> <concept>?
How do I decide if I should <task> <concept> or <task> <concept>? When should I <task> <concept>? How do I decide on? <attribute>
Expose Options Enumerate Evaluate Stipulate Plan Calculate
Clarification What do you mean? Clarify Re-Structure
Re-Word
8.1 The Illocutionary Model
Figure 13 shows the basic schema of COR. The circles represent states on the top level of the dialogue; the squares terminal states and the arrows represent transitions between two states. ‘A’ refers to the information seeker and ‘B’ to the information provider. The order of the numbers describes the possible directions the dialogue may take. All dialogue contributions – except the inform contribution – can be ‘implicit, i.e. they may be omitted when the implicit intention can be inferred from the context. The arrows between 1 and 5, for example, represent two ideal courses of dialogue. In the first case, ‘A” makes a request for information, ‘B” promises to look it up and/or presents the information, and ‘A’ is satisfied and ends the dialogue. In the second case, B offers to provide some information (e.g. anticipating an information need of ‘A’). ‘A’ accepts the offer. ‘B’ provides the information. ‘A’ ends the dialogue.
Figure 13. The basic information seeking conversational model (COR) directives: request and accept.
8.2 The Rhetorical Model
MADIS offers the customer twelve question-types based on the assumed purpose of a user’s request. They are classified under five general categories. Possible examples of each question-type relevant to the Virtual Boutique are given in Table 1.
An Elaboration question is aimed at obtaining general or particular information about a concept. ‘Tell me about….’ <Tell me particularly about … >.
‘Tell me about adjacent colours.’ ‘Tell me about carpet colours.’
Validation questions check if a past or intended action is valid. They are classified as having to do with the user’s current model (Validation-Current-Model) or (Validation-Future-Model) either simple or with the additional requirement of a comparison (e.g. ‘Should I add…? Should I remove… or…?’)
‘Check the validity of my layout.’ ‘Should I add frames?’
‘Should I add a table lamp or floor lamp?’
Enablement questions aim at obtaining information to take action or make a decision (‘How do I decide…? How should I…?). Question-types under this category include decision-action, decision-comparison, decision-time and decision-value.
‘How do I decide if I should add a frame?’
‘How should I decide if I should add a table lamp or a floor lamp?’ ‘When should I use adjacent colours? ‘
‘How do I decide on the colour of the carpet?’
Clarification aims at obtaining greater specificity from the expert. ‘Should I understand that…?
‘Do I understand that I should remove a frame?’
8.3 An Assert Response
The system’s answer to a question is defined by the speech act assert. It consists of a set of rhetorical predicates identified as a tactic within a given strategy. Each question-type is associated with a strategy and with three tactics (Table 2). An assert response is the result of a process that takes into account what to say, how and in what order to say it, based on one or more of the user or task variables. The user’s assumed understanding of a concept or task determines the choice of a tactic. Like a human expert, the system slightly modifies its response when it is determined that the user is acquainted with the concept. This is the case for Elaboration, Validation-Current-Model and Validation-Future-Model questions. To tailor responses to individual users, rules modify the content of the information within a tactic. If the user, for example, is described as unfamiliar with the concept of adjacent colours (i.e. tactic is Initiate) but has shown that he or she knows how adjacent colours are used, then this information (rhetorical predicate ‘representation’) is retracted from the definition. If a preceding question involves the same concept, some reference may be made to the information then given, perhaps in the form of Consolidate or Remind. This approach supports the idea that speakers spontaneously generate a few immediate actions (i.e. a tactic) which seem likely to bring them closer to the intended goal and then adjust other actions according to the particularities of the situation. This view is congruent with a partial-plan model of discourse management [29]. A partial plan model is based on the principle that decisions about what to say require some, but not complete, planning since speakers’ utterances must suit their perceptions of a changing situation.
An Elaboration question is answered with the strategy Inform and with one of three tactics, Initiate, Consolidate or Remind, based on the user’s understanding of the concept. Initiate is selected when the system assumes that the user is unfamiliar with the domain. The tactic identifies eight ‘speech acts’ necessary to give the user a complete definition of the concept. The required information is retrieved by eight rhetorical predicates and it is structured so as to respect principles of human learning and comprehension. Consolidate is selected when the user is assumed to be familiar with, yet uncertain of, a concept. It contains two rhetorical predicates. Consolidate presents the purpose of the concept and a useful heuristic related to its application. Remind is used when the user is assumed to know the concept. It presents the class to which the concept belongs and its purpose. Consolidate and Remind are used to repeat and reinforce information given earlier.
Table 2. Speech acts, question-types, strategies and tactics of the advisor interface
SPEECH ACTS
USER REQUEST ASSERT RESPONSE
QUESTION-TYPE STRATEGY TACTIC
Elaboration (general) (particular) Validation-Current-Model Validation-Future-Model (simple) (comparison) Enablement (decision-action) (decision-comparison) (decision-value) (decision-time) Inform Probe Expose Meaning Expose Options Initiate Consolidate Remind Verify Translate Help Stipulate Translate Help Evaluate Translate Plan
Validation-Current-Model questions are answered with the strategy Probe and the tactic Verify, Translate or Help. Verify is selected when the user is assumed to be unfamiliar with the task of validating a particular concept. It contains three rhetorical predicates applied recursively to all the objects (e.g. stove location) or values (e.g. colours of wall and floor tiles) of interest to the user. In each case the system queries the user about the situation. The queries are actual questions a human expert would ask himself or herself (e.g. interior decorator) when validating a model of his or her own. The tactic Translate assumes that the user is either uncertain or familiar with the validation of the concept. It also contains three rhetorical predicates. One affirms the meaning of the objects or values and the others structure their presentation. Help simply advises the user that the validity of an object have been established. A simple Validation-Future-Model question leads to the selection of the strategy Expose Meaning and one of three tactics. Stipulate is selected when the user is considered unfamiliar with the validation of a particular concept. It contains two rhetorical predicates. One presents the conditions that must be satisfied for the concept’s application to be valid and the other offers an example to demonstrate it. Translate is selected when the user is assumed to be either uncertain or familiar with the validation of the concept. It is