THE CREEP RUPTURE BEHAVIOR OF NOTCHED BARS OF IN-X750
by
Ioannis Platon Vasatis
S.B. National Technical University of Athens
(1980)
SUBMITTED TO THE DEPARTMENT OF MATERIALS SCIENCE AND ENGINEERING
IN PARTIAL FULFILLMENT OF THE REQUIREMENTS OF THE
DEGREE OF
DOCTOR OF PHILOSOPHY
at the
MASSACHUSETTS INSTITUTE OF TECHNOLOGY
February 1986
@ Massachusetts Insti!te of Technology 1986 . 4 / x
Signature of Author:
D srtment of Materials Science and Engineering January 10. 1986 Certified by: !gis M. Pelloux isis Supervisor Accepted by: i // Bernard J. Wuensch ArChiVesChairman, Departmental Graduate Committee MASSACHUSETTS INSTITUTE
OF TECHNOLOGY
MAR 1 9 1986
THE CREEP RUPTURE BEHAVIOR OF NOTCHED BARS OF IN-X750 by
Ioannis Platon Vasatis
Submitted to the Department of Materials Science and Engineering on January 10, 1986 in partial fulfillment of the requirements for
the Degree of Doctor of Philoshopy.
ABSTRACT
The creep deformation and rupture behavior of the AH heat treated and HT heat treated IN-X750 was investigated at 700*C. Creep rupture tests were performed on smooth bars, circular and British standard notched specimens which were monitored with the dc potential drop
technique. The potential drop technique was used to measure creep strain in the three geometries, detect crack initiation and measure crack
propagation rates in British standard notched specimens.
Creep rupture in the AH IN-X750 was found to be controlled by creep deformation. The idealized form of the Monkman-Grant relationship was satisfied in all three specimen geometries. The equivalent stress was shown to correlate the rupture life of the smooth and the circular notched specimens and the crack intiation time of the British standard notched specimens. The strain/time relationships for the three specimen
geometries were analysed with the Continuum Damage Mechanics Theory which provided very good predictions.
The deformation and rupture behavior of the smooth bars and the British standard notched specimens of the HT IN-X750 was considerable
affected by the environment. Correlation of the rupture data based on creep damage mechanisms alone was not feasible. Predictions of the strain/time relationship with the continuum theory were only
satificatory in the case of the circular notched specimens in which the environmental effect was insignificant.
It was shown that micromechanistic models of creep fracture by continuous nucleation of cavities and constrained cavity growth can predict very well the experimental results obtained for AH IN-X750. The experimental results in HT IN-X750 U-notched specimens agreed very well with the predictions of models of creep fracture by continuous
nucleation and unconstrained cavity growth. As yet, the inability of these models to incorporate the effect of environment which was observed in the smooth bar and the British standard notch tests of HT IN-X750, indicated the limited applicability of the micromechanistic models to predict the rupture behavior of engineering alloys.
In the British standard notch specimens, crack initiation was shown to occur early in life and thus rupture was limited by crack
propagation. As a result, understanding and predicting the notch rupture behavior of engineering alloys can only be obtained by
considering both crack initiation and propagation. The dc potential drop technique is an experimental tool which can provide the necessary information.
Thesis Supervisor: Dr. Regis M. Pelloux
Title: Professor of Materials Engineering
-3-TABLE OF CONTENTS Abstract Table of Contents List of Figures List of Tables Acknowledgements Introduction I. CREEP I.1 1.2
DEFORMATION AND FRACTURE ... Phenomenology of Creep Deformation ...
1.1.1 Uniaxial Constitutive Equations ...
1.1.2 Multaxial Constitutive Equations... Mechanisms of Creep Deformation ... 1.2.1 Diffusion Creep ...
1.2.2 Dislocation Creep ... 1.2.3 Power-law Breakdown -...
1.2.4 Deformation Mechanism Maps. 1.3 Phenomenology of Creep Fracture 1.4 Mechanisms of Creep Fracture ...
II. INTERGRANULAR CREEP FRACTURE ...
II.1 The Micromechanistic Approach ...
II.1.1 Cavity Nucleation... 11.1.2 Cavity Growth
...---11.1.3 Time to Fracture by Intergranular 11.2 The Continuous-Damage Mechanics Approach.. 11.2.1 Uniaxial Damage Rate Equations .. 11.2.2 Multiaxial Damage Rate Equations. 11.3 Comparison of the Two Approaches ...
Cavi
11.4 Creep Damage and the Remaining Life Concept..
.21
.21
.21
.24
.25
.26
.28
.30
.31
.31
.38
.41
.41
.43
.46
.48
.50
.50
.56
.60
ties....
63
-4-.. 17
-.
18
.19
. . .. .. . ... . . .. .. .. .. . . .. . . ....III. CREEP
III.1
RUPTURE OF NOTCHED BARS ... Creep Crack Initiation ...
III.1.1
111.1.2
Stress/Strain Distributions...
Damage Accumulation and Stress Redistribution... 111.2 Creep Crack Growth...
111.2.1 Stress Distribution at Cracks... 111.2.2 Modelling Creep Crack Growth ... 111.3 The effect of Environment on the Notch-Rupture
IV. EXPERIMENTAL PROCEDURES ... IV.1 Material... IV.1.1 Heat Treatments... IV.2 Tensile Test Procedures---... IV.3 Creep Test Procedures'... IV.4 Notch Stress Rupture Test Procedures... IV.5 The d.c. Potential Drop Technique ... IV.5.1 The dc potential Drop System... IV.5.2 d.c. Potential Drop Procedures... IV.5.3 Signal Correction Procedures... IV.5.4 Correlation of Potential with...
Deformation and Damage
.68
.70
... .. .75.75
.78
.79
Behavi...
82
... 82
... 82
... 84
...
*....
84
...
88
-...
88
... 89
... 91
... 92
... 94
V EXPERIMENTAL RESULTS ... V.1 Tensile Tests ... V.2 Uniaxial Creep Tests... V.2.1 Creep Deformation ... V.2.2 Creep Rupture ... V.3 Notch Rupture Tests ... V.3.1 Fractography of Notched V.3.2 Creep Damage in Notched A. U-Notch Geometry ... B. V-Notch Geometry ...-5-... 65 ... 67 Rupture Bars Tests
-.
96
..96..
96
..
96
.100
.102
.109
.110
.110
.110
V.4 Application of the Potential Drop to Rupture Testing. Uniaxial Creep Tests...
Notch Rupture Tests - AH Heat A. U-Notch Geometry...
a. Potential/Deformation
b. Step Loading Tests...
B. V-Notch Geometry... a. Crack Initiation .... b. Potential/Deformation c. Crack Propagation -.--Treatment... Relationship ... ... Relationship
d. Reproducibility of Notch Rupture.
Test Results V.4.3 Notch Rupture Test - HT
A. U-Notch Geometry.... B. V-Notch Geometry...
. .. ....
114
. ...
117
.
.
117
.. . .. .
121
...
122
...
125
---.-- .
126
--- -- ..
134
-.--
.-
.
135
...
137
Heat Treatment ... 0....0... ... 0VI. DISCUSSION OF EXPERIMENTAL RESULTS... VI.1 Creep Deformation and Rupture of AH IN-X750 VI.1.1 Creep Deformation ... VI.1.2 Creep Rupture ... VI.1.3 Micromechanisms of Fracture... VI.2 Creep Deformation and Rupture of HT IN-X750 VI.2.1 Creep Deformation... VI.2.2 Creep Rupture... VI.2.3 Micromechanisms of Fracture...
.140
.140
.140
.147
.147
.147
.154
.157
.159
.159
.172
.179
VI.3 Crack Growth Behavior of IN-X750 ... 181VI.4 Damage Mechanics and the Remaining Life Concept...183
VII. CONCLUSIONS ... 185
VIII.RECOMMENDATIONS FOR FUTURE RESEARCH...189
-6-V.4.1
V.4.2
REFERENCES ... ... 191
Appendix 1: Correction of Potential with the Reference Probe ...
206
Appendix 2: Relation between Potential Change and CreepStrain in the Smooth Bar
...
207
-7-LIST OF FIGURES
Figure Number Page
I-i Standard representation of creep curves 22
1-2 Deformation mechanism map of pure nickel 22 1-3 The simplest classification of fracture 32
mechanisms. The upper row refers to low
temperatures where plastic flow does not depend strongly on temperature or time; the lower row refers to high temperature range.
1-4 Fracture mechanism map of IN-X750 shown in the 33
field of normalized tensile stress vs. homologous temperature
1-5 Fracture mechanism map of IN-X750 shown in the 34 field of normalized tensile stress and time to
fracture.
1-6 The four categories of creep damage according to 37
[31].
1) Damage by loss of external section; 2)Damage of loss of internal section; 3) Damage by degradation of the microstructure; 4) damage by gaseous-environmental attack.
II-i A schematic illustration of the development of 42
creep fracture.
11-2 Nucleation of a cavity on a stressed interface 44 11-3 The distribution of stress on a grain boundary 44
outside the cavity.
11-4 Inhomogeneous cavitation of a boundary 45 surrounded by non-cavitating boundaries leading
to load shedding and constrained growth.
11-5 Schematic creep curve indicating the parameters 52 used in the Continuum Damage Theory.
11-6 Normalized creep strain accumulation for an 53
aluminum alloy.
-8-Figure Number
11-7 Comparison of computed and experimental values 54 of creep strain for : (upper) copper, (lower)
aluminum.
11-8 Comparison of computed and experimental values 55
of creep strain for 1/2CrMoV ferritic steel.
11-9 Comparison of computed and experimental values 55
of creep strain for IN-100.
II-10 Two plane stress isochronous rupture surfaces
58
for materials which obey a) the maximum principles stress or b) the effective stress law.
II-11 Comparison of computed and experimental creep 58
curves for 2-1/4 Cr1Mo steel in tension and tersion.
11-12 Isochronous surface predictions based on 59 cavitation studies.
11-13 Relation between cavity density N and the creep 59 elongation in Nimonic 80A.
11-14 Relation between cavity density N and the 59 fractional expired life t/tf in Nimonic 80A.
(The symbols correspond to the same stress levels shown in Fig. 11-13.
III-1 A plot of the ratio of notched to unnotched 66
rupture strength against notch sharpness for four different alloys.
111-2 Circumferentially notched specimens with: a) a 66 round notch; and b) a British standard notch.
Figure Number
111-3
Comparison of the spatial variations of 69normalized components of elastic and stationary-state (s:s) axial stresses with effective stress at stationary state for the circular and the B.S notches at z=O (n=5) - circular notch; -- B.S notch.
111-4 Spatial distribution of: a) normalized stress, 72 b) effective strains normalized to the effective
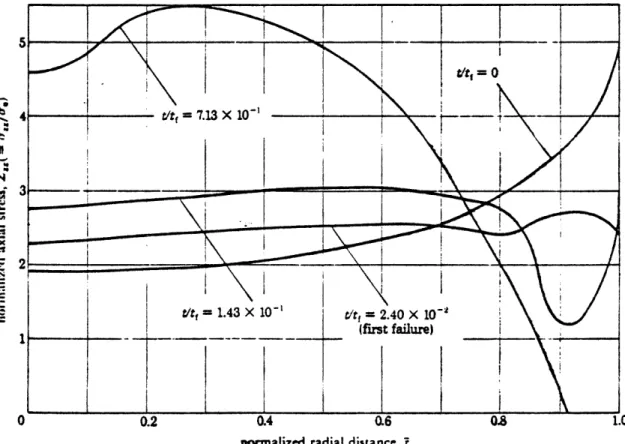
strain at the notch root and c) cavitation damage across minimum notch section-specimen crept at 600MPa(n=9).
111-5 The change of normalized axial stress with 73
normalized time
in
a circular notch for 316 stainless steel (z=O).111-6 The change of normalized stress with normalized 74 time in a B.S notch for 316 stainless steel
(z=O).
111-7 Time dependent change in the computed dominance 76
of different singularities at the tip of a very sharp crack in a creeping alloy.
IV-1 Microstructure of AH heat treated IN-X750 83
IV-2 Microstructure of HT heat treated IN-X750. 83
IV-3 Smooth bar creep rupture and tensile specimen 85
geometry (dimensions in inches).
IV-4 Geometry of circular notched specimen (U-notch; 86
dimensions in inches).
IV-5 Geometry of British standard notched specimen 87
(V-notch; dimensions in inches).
IV-6 Control block diagram of the dc potential drop 90
system.
Figure Number
IV-7 Reference probe potential for two rupture tests. 93
(Note: the values have been offset for
comparison purposes; initial values of the order of 0.5mV).
V-1 Uniaxial creep curves of AH IN-X750. 97
V-2 Uniaxial creep curves of HT IN-X750. 98
V-3 Uniaxial stress rupture results for AH IN-X750 101
and HT IN-X750.
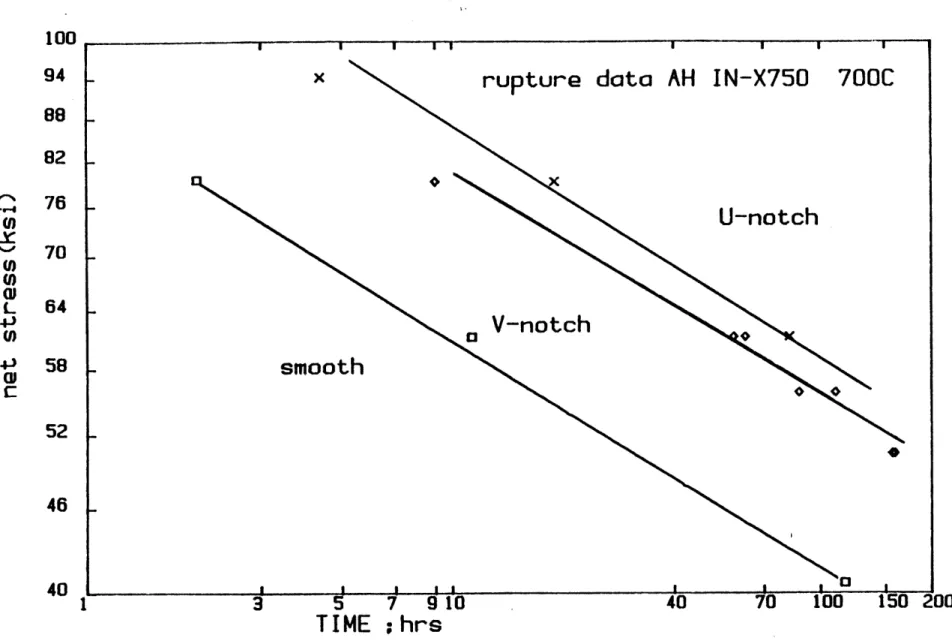
V-4 Stress rupture data for the three specimen 103
geometries of AH IN-X750.
V-5 Stress rupture data for the three specimen 104 geometries of HT IN-X750.
V-6 Macrographs of fracture surfaces of U-notch 106
specimens tested at 700*C showing: a) "cup and cone" type of fracture in AH IN-X750 (94.2 ksi, 4.3 hrs), b) brittle type of fracture in HT
IN-X750.
V-7 Macrographs of fracture surfaces of V-notch 107
specimens of AH IN-X750 tested at 700*C showing that failure occurred by crack propagation.
V-8 a) Macrograph of fracture surface of V-notch 108
specimen of HT IN-X750 showing multiple initiation b) SEM fractograph of initiation site; fracture is intergranular and cavities are observed on the grain boundaries.
V-9 Micrograph showing the distribution of facet 111 cracks near the center of a diametral plane of a
U-notch specimen of AH IN-X750 (79.2 ksi,
19 hrs).
Figure Number
V-10 a) Micrograph showing the distribution of facet 112
cracks near the center of a diametral plane of a U-notch specimen of HT IN-X750 at fracture
(101.5Ksi, 49 hrs) B) detail, showing that facet cracks are formed by coalescence of grain
boundary cavities.
V-11 Micrographs of longitudinal midsections of V- 113
notch specimens which shows the extent of damage associated with the formation of a macrocrack at the root of the notch in a) AH IN-X750 (50.4 ksi
163 hrs) b)HT IN-X750 (90 ksi, 155 hrs).
V-12 Comparison of the creep strain measured by the 115
dc potential drop technique and by LVDT in a smooth bar of AH IN-X750.
V-13 Comparison of the creep strain measured by the 116
dc potential drop technique and by LVDT in a smooth specimen of HT IN-X750.
V-14 Potential vs. time curves for the U-notch tests 118
of AH IN-X750 (note: the values have been offset for comparison purposes; initial values of the order of 2.5mV).
V-15 Potential vs. time/time to fracture curves for 119
the U-notch tests of AH IN-X750 (note: the
values have been offset for comparison purposes; initial values of the order of 2.5mV).
V-15.a Comparison of change in potential expressed in 120 terms of ln(V/V
)
with the axial creep strain0
measured in a U-notch rupture test.
V-16.a Potential vs. time/time to fracture for a two 123
step load test (increasing stress) on a U-notch specimen of AH IN-X750, showing the
applicability of the linear damage accumulation rule.
-1
2-4
Figure Number
V-16.b Potential vs time/time to fracture for a two 124
step load test (decreasing stress) on a U-notch specimen of AH IN-X750, showing the
applicability of the linear damage accumulation rule.
V-17 Potential vs. time curves for the V-notch tests 127
of AH IN-X750 (note: the values have been offset for comparison purposes; initial values are of the order of 1.5mV).
V-18 Potential vs time/time to fracture curves for 128
the V-notch tests of AH IN-X750 (note: the
values have been offset for comparison purposes;
initial values are of the order of 1.5mV).
V-18.a Potential vs. time/initiation time curves for 129
the V-notch tests of AH IN-X750 (note: the
values have been offset for comparison purposes; initial values are of the order of 1.5mV).
V-19 Potential vs. time curves for interrupted V- 130
notch tests of AH IN-X750 indicating the effect of probe location on the potential change.
V-20 a) Potential vs. time curves for interrupted V- 131
notch tests of AH IN-X750 b) longintudinal midsections of V-notch specimen (7.7 hrs interrupted test) c) surface of V-notched
specimen fractured at room temperature (7.7 hrs interrupted test).
V-20.d Comparison of the potential/time curves of the 132
two notches for two V-notch rupture tests of AH IN-X750.
V-21 Creep crack growth rates of AH IN-X750, measured 136
from V-notch rupture tests, vs. the stress intensity factor.
Figure Number
V-22 Potential vs. time curves for dublicate tests on 138
V-notch specimens of AH IN-X750.
V-23 Potential vs. time/time to fracture curves for 139
dublicate tests on V-notch specimens of AH
IN-X750 at the same stress level.
V-24 Potential vs. time/time to fracture curves for 141 U-notch specimens of HT IN-X750.
V-25 Potential vs. time curves for V-notch specimens 142 of HT IN-X750.
V-26 Creep crack growth rates of HT IN-X750, measured 145
from V-notch rupture tests, versus the stress intensity factor.
VI-i Comparison of computed with experimental values 148
of creep strain in uniaxial tests of AH
IN-X750.
VI-2 Comparison of computed with experimental values 149 of diametral creep strain in U-notch tests of AH
IN-X750.
VI-3 Comparison of computed with experimental values 150
of diametral creep strain in V-notch tests of AH
IN-X750.
VI-4 Comparison of the creep curves, presented in 152
terms of normalized strain and time, for the three specimen geometries used in the creep rupture tests of AH IN-X750.
VI-5 Stress rupture data of AH IN-X750, presented in 155
terms of the representative rupture stress.
VI-6 Comparison of experimental with computed values 160
of creep strain in uniaxial test of HT
IN-X750
(89.7 ksi, 1.44 hrs).
VI-7 Comparison of computed with experimental values 161
of creep strain in uniaxial test of HT IN-X750
(77.4 ksi, 13.1 hrs).
Figure Number
VI-8 Comparison of computed with experimental values 162 of creep strain in uniaxial test of HT IN-X750
(75.15 ksi, 20.7 hrs).
VI-9 Comparison of computed with experimental values 163
of creep strain in uniaxial test of HT
IN-X750
(67.2 ksi, 43 hrs).
VI-10 Comparison of computed with experimental values 164
of creep strain in uniaxial test of HT IN-X750
(65.2 ksi, 116.7 hrs).
VI-11 Comparison of experimental with computed values 166
of diametral strain in U-notch rupture test of HT IN-X750 (104 ksi, 42.1 hrs).
VI.12 Comparison of computed with experimental values 167 of diametral creep strain in U-notch rupture
test of HT IN-X750 (101.5 ksi, 49 hrs).
VI-13 Comparison of computed with experimental values 168 of diametral creep strain in U-notch rupture
test of HT IN-X750 (90.4 ksi, 163.1 hrs).
VI-14 Minimum creep strain rate vs. time to rupture 169 for uniaxial tests of AH X750 and HT
IN-X750.
VI-15 a) Micrograph of longintudinal section of smooth 170
bar of HT IN-X750 showing surface initiation and oxidation around the crack (65.2 ksi,
116.7 hrs).
b) Micrograph of the high stress side of the
same specimen showing cracking along twin boundaries.
VI-16 Comparison of experimental with predicted values 173 of tertiary stage creep strain in uniaxial test
of HT IN-X750 (75.15 ksi, 20.7 hrs).
Figure Number
VI-17 Comparison of experimental with predicted values 174 of tertiary stage creep strain in uniaxlal test
of HT IN-X750 (67.2 ksi, 43 hrs).
VI-18 Comparison of experimental with predicted values 175 of tertiary stage creep strain in uniaxial test
of HT IN-X750 (65.2 ksi, 116.7 hrs).
VI-19 Minimum creep strain rate vs. time to rupture 176
for uniaxial tests of HT IN-X750; x min. creep rates were calculated from the tertiary stage predictions by the continuum theory, and the time spent in tertiary stage creep.
VI-20 Stress rupture data of HT IN-X750 in terms of 177 the equivalent stress.
LIST OF TABLES
Table Number Page
IV-1 Chemical Composition of IN-X750 (wt.%) 82
IV-2 Heat-Treating Sequence 84
IV-3 Output Characteristics 91
V-1 Tensile Test Results 96
V-2 Summary of Creep Test Results 99
AH Heat Treated IN-X750
V-3 Summary of Creep Test Results 100
HT Heat Treated IN-X750
V-4 Summary of U-Notched Rupture Tests 122
AH Heat Treated IN-X750
V-5 Summary of Stepload Tests (U-Notch) 125
AH Heat Treated IN-X750
V-6 Summary of V-Notched Rupture Tests 134
AH Heat Treated IN-X750
V-7 Summary of Repeated V-Notched Rupture Tests 137
AH Heat Treated IN-X750
V-8 Summary U-Notched Rupture Tests 143
HT Heat Treated IN-X750
V-9 Summary V-Notched Rupture Tests 143
HT Heat Treated IN-X750
VI-1 Summary U-Notched Rupture Tests 181
HT IN-X750
-17-ACKNOWLEDGMENTS
I would like to express my sincere appreciation to Professor Regis
Pelloux, for his guidance and continuous support. His positive influence and involvement certainly exceeded that of a thesis
supervisor. I am very thankful to the members of my thesis committee; Professor David Parks, for his help and suggestions during my studies and Professor Nicholas Grant for his valuable recommendations.
I have been extremely fortunate to be among people whose integrity
and unselfishness taught me how to be a better person. So, I will
always be deeply thankful to my colleagues and friends Normand Marchand, John Prybylowski, Jon Peltier, Bertrand Journet, Glenn Romanoski, Jun Feng and Allison Warren.
I dedicate this thesis to my family and friends for their constant moral support.
Financial support by the National Science Foundation is gratefully acknowledged.
-18-INTRODUCTION
The technical relevance of creep and creep fracture became apparent with the increase in the operating temperatures of electricity
generating plants, petrochemical installations and aircraft engines. These engineering developments focused attention on the need for
improved materials having a satisfactory combination of high temperature mechanical properties and a good resistance to degradation in order to withstand the hostile service enviornment imposed for long periods of
time.
The complexity of most commercial high temperature alloys has meant that studies aimed at identifying and quantifying the mechanisms by which creep fracture occurs, have usually been undertaken using pure metals and simple alloys. Similarly, most fundamental investigations and even the majority of engineering design procedures are based on data which has, for the most part, been determined on idealised specimens tested under simplified conditions of temperature, loading and
environment. Whereas, components and structures are generally required to operate under complex conditions which differ significantly from those of available data.
Since the aim of engineering work on creep and fracture is towards
the better prediction of performance of structures, it is not surprising that there has been a considerable amount of component testing reported in the engineering literature. Additionally, multiaxial creep testing of materials at high temperatures was employed, in order to study the influence of stress system on fracture. The principal objective was to develop safe design methods suitable for engineering structures in which the stress system is invariably complex and therefore different from the uniaxial stress system normally used in the laboratory. The most widely used technique for collecting data under a triaxial state of stress, is the uniaxially loaded circumferentially notched bar.
Uniaxially loaded circumferentially notched bar test data are presently used as one of the qualitative guides in selecting the best available material for a specific structure but, as yet, they are not used to effect a more economical design of that structure. The fact
-19-that such data are used only in a qualitative way, reflects our limited understanding of the notch stress rupture test and our difficulty in interpreting the experimental results in a unified and integrated way. The recognized influence of numerous variables such as notch geometry, temperature, strain rate, metallurgical state, notch preparation, composition, time, mode of fracture, and ductility, along with the contradictory results of some of the investigations, emphasize the extreme complexity of the subject [1]. Despite the systematic work undertaken to investigate the role of some of the variables mentioned above [2], many issues are still unresolved, partly due to the limited amount of information, that are normally obtained from a notched stress
rupture test (i.e. fracture time). It is clear that if one wishes to understand the notched stress rupture behavior of engineering alloys,
then additional information, regarding the deformation and fracture characteristics of the notched bars, will be required.
The main aim of this resarch work was to investigate the parameters controlling the creep rupture of notched bars. The effects of notch geometry, stress level, state of stress, stress distribution and heat treatment on the rupture behavior, were investigated. In order to achieve these goals a computerized dc potential drop system was developed and used to monitor the deformation, microcracking and
macrocracking characteristics of notched bars of IN-X750. Further, the applicability of Continuum Damage Mechanics in quantifying the rupture behavior fo notched bars and predicting the notched rupture life from uniaxial-rupture data was examined. Finally the issue of the relation between the macroscopic quantities that describe the deformation and rupture behavior of notched bars and the micromechanisms controlling the rupture process was addressed.
-20-I. CREEP DEFORMATION AND FRACTURE
Creep is a time dependent deformation which occurs when a material is subjected to a load for a prolonged period of time. Of course the material cannot deform indefinitely and ultimately creep will lead to
fracture or "creep rupture". This type of deformation and fracture becomes important in engineering applications at temperatures above
about 0.30 times the absolute melting temeprature of the material. A review of the current knowledge of the mechanisms of creep deformation and fracture is presented in the following sections.
I.1 Phenomenology of Creep Deformation
The macroscopic description of the physical process is best
depicted by the standard creep curve shown in Figure (I-1). This curve is conventionally obtained by applying a constant load on a uniaxial tensile specimen at a constant temperature. There is an initial elastic-plastic time independent response upon the application of the load. Thereafter the creep curve is described in three parts: a part of decreasing creep strain rate called primary creep, a part of
approximately constant creep strain rate called secondary or steady state creep and a final portion of increasing strain rate called
tertiary creep preceeding fracture. This standard curve is not always found, and the relative importance of the different stages can vary for different matierals [3]. In single-phase and microstructurally simple materials all three stages are generally observed, however in creep
resistant materials, such as nickel base superalloys, there is little evidence of steady state creep; rather after a small primary creep
strain that varies in extent with testing conditions, most of the creep curve consists of steadily increasing creep rate [4]. Additionally, the relative importance of the different stages of the standard creep curve, can also vary with different stress/temperature regimes, environment and type of loading [6,7,8].
I.1.1 Uniaxial Constitutive Equations
The majority of experimental creep data is collected from uniaxial
-21-RUPTURE LIFE (tf)
TIME TO
TER TIARY (tt)
TERTIARY
STRAIN
SECONDARY
STRAINPRIMARY STRAIN
INITIAL STRAIN
TIME
Figure I-l. Standard representation of creep
TVAPERATURE (*C)
HOMOLOGOUS TEMPERATURE T/T.
Figure 1-2. Deformation mechanism map of pure nickel. -22--I * 1~ curves.
z
w
w~ i4 0is
0tensile tests so that, it is not surprising that the development of constitutive equations has concentrated on this simple stress state. In the broadest sense the creep strain may be written as a function of stress a, time t, and temperature T as
e = f(a,t,T) . (I-1)
One method of simplifying equation (I-1) is to assume that it can be
split into separate functions of the variables, namely
e = f1(a)f2(t)f3(T) . (1-2) In such cases, the various functions can in principle, be determined from simple isothermal constant stress creep curves. The stress
function may be either a simple power relationship, often referred to as Norton's law, or a hyperbolic relationship, which reduces to a power or
an exponential relationship at low and high stress levels respectively
[3,71. The temperature function is often taken to be an Arrhenius type exponential. The time function was suggested to be either a polynomial
equation of the following general form [3]:
e = blti/3+b2t+b3t3 (1-3) where bl, b2, b3 are constants for any specified stress and temperature or an exponential equation of the following general form [3,5,61
E = p]1-exp(-Y pt)] + s t + s exp [YT(t-tT) (1-3) where Sp is the primary strain
y relates to the rate of decay of the primary stage op
es is the secondary creep strain rate
5T' T define the tertiary stage which starts at
time tT'
Expressions of this kind envisage normal creep curves as being made up of three stages, i.e. primary, secondary and tertiary creep. An
alternative description sees the shape of the normal curves as a
consequence of two competing events; decaying primary and accelerating tertiary processes, i.e. the secondary stage is then, merely the period
of inflection when the decaying rate during primary creep is offset by
the acceleration due to the tertiary creep processes giving an
apparently "constant" rate. This type of approach does not require the
-23-separation of variables in equation (I-1) which can rarely be justified experimentally. An experimental expression, compatible with this
concept, representing the shape of standard creep curve, was suggested to have the following form [6]:
e = 0111-exp(-02t)] + 03[exp(04t)-1] (1-4)
where 01, 2, 03, 04 function of stress for specified temperature. In this case, 01 and 03 act as scaling parameters, which control the extent, with respect to strain, of the primary and tertiary stages of creep. 02 and 8. rapidly increases the deceleration in creep rate during primary creep and acceleration during tertiary creep.
This type of constitutive equations were derived to describe simple loading histories, such as constant stress or constant load conditions, and therefore cannot account for more complex stress histories. This problem of creep transient behavior has led to the development of more complex types of constitutive equations. It is assumed that creep rate is not only a function of stress and temperature but also of one or more
"internal variables" which are themselves functions of the history of
the material. The internal variables are intended to describe the nature of metallurgical structural changes (such as recovery and work hardening) and hence, allow realistic estimates of transient behaviour.
A wide variety of models are available [12], the more complex requiring
the evaluation of a large number of material constants. Thus, although the concepts are likely to lead to more precise constitutive equations, few engineering materials have yet been sufficiently well investigated to allow detailed evaluation.
Acutal components and structures are however normally subject to multi-axial stress conditions; consequently constitutive equations describing the creep behavior of materials under multiaxial stress conditions are necessary.
1.1.2 Multiaxial Constitutive Equations
Multiaxial stress states have been investigated by the use of biaxial plates, torsion specimens, pressurised thin-walled tubes and circumferentially-notched specimens
[9].
The overwhelming evidence-24-[10,11] of tests on various metals and at various temperatures indicated
that the von Mises stress, controlled the primary and secondary creep rates. Therefore, equation (I-1) will take the following form in the
case of multiaxial stress state.
e = f(a ,t,T) (1-5)
e e
where the effective strain (e ) and effective stress (a
)
can be defined in terms of the principal strain and stress components asa = 1//2
[(a-F2)2+(
2-a3)2+(a3- 1 )2]1/2 (I-5a)e=
/2/3
[(a
1-a
2)
2+(a2~S3)2+(33~*)2]1/2
(I-5b)
where a., e. are principal stress and strain respectively. Further, it was found that the effective strain rate is related to the effective stress in the same way as in the uniaxial case and this conformed to one
equation of the type [10,111.
rs . = 3/2Aa e S (1-6)
where S.. = creep strain rate tensor
S.. = stress deviator tensor
A = A(t) for primary creep and a constant for secondary creep.
or i. = 3/2 ; (S../a ) (I-6a)
,13 u 13 e
where su = uniaxial creep rate.
Thus, creep rates for the primary and secondary stages, under any arbitrary stress system, can be derived from uniaxial data, using Equation (I-6a). On the contrary, the tertiary creep strain rates
cannot be derived from the uniaxial data because tertiary stage creep is not necessarily describable in terms of the von Mises stresss as it will
be discussed later.
General internal variable models can also be used to describe transient behavior under multiaxial stress state, but the large number of material constants required to deal with the multiaxial stress state, makes the determination of suitable relationships very difficult.
1.2 Mechanisms of Creep Deformation
With exponential descriptions of the standard creep curve, and also
-25-with most of the polynomial expressions, direct relationships have been found between the secondary creep rate and the various terms used to quantify the primary and tertiary stages [13]. These relationships
suggest that the mechanisms by which deformation takes place, are essentially the same throughout the normal creep curve. This is in agreement with the simple picture of Bailey (14] and Orowan [15] that
high temperature creep combines two competing mechanisms of strain
hardening and thermal recovery. As a consequence, most theoretical studies then attempt to identify the processes controlling creep
behavior by reference to the way in which the secondary or steady-state creep rate ( s) varies with stress (a), temperature (T) and grain size
(d), using an expression of the general form
s = A(l/d )m n exp(-Q /RT) (1-7)
where Qc is the activation energy for creep
R is the gas constant.
Most creep processes cannot be quantified sufficiently well to allow the relevant mode to be ascertained from a comparison of measured and
predicted creep rates. As a result, the dominant creep process is generally identified by comparing measured values of the grain size exponent (m), the stress exponent (n) and the activation energy for creep (Q c), with the theoretical values expected for specific creep
mechanisms [16] which are briefly described below.
1.2.1 Diffusion Creep
For low stresses, creep deformation of individual grains proceeds by stress driven diffusion [17,181 either, by bulk volume diffusion
(Nabarro-Herring creep) or by grain boundary diffusion (Coble creep). No dislocation motion is involved in this diffusion creep mechanism. By
assuming that the grain boundaries are perfect sources and sinks of vacancies, so that the concentration of vacancies in the grain
boundaries can be predicted from the application of thermodynamic principles, the steady state creep strain rate in pure metals can be
calculated as [17,181.
-26-e = 14 ai/kT l/d2 D (1 + Td/d D /D ) (1-8)
s v B V
where Q = the atomic volume
k = Boltzman's constant
D = the volume self-diffusion coefficient
6 = the grain boundary thickness
DB = the grain boundary self-diffusion coefficient (the other symbols have already been defined previously).
The activation energy of the volume diffusion process is usually larger than the activation energy of the grain boundary diffusion process. Coble creep is thus dominant at relatively low temperatures and it is only at very high temperatures that Nabarro-Herring creep may become
dominant [17, 181.
As individual grains deform by diffusion creep, grain boundary sliding is required by compatibility in order to maintain the coherency and the continuity of a polycrystal [19,20,21]. No diffusion creep deformation of a polycrystal can hence take place without any grain boundary sliding. The overall diffusion strain rate of a polycrystal is
then equal to the creep strain rate associated to the deformation of each individual grain provided that the internal stress redistributions
due to grain boundary sliding be taken into account [19,201. Two limiting cases have been considered where 1) the grain boundaries are assumed to slide freely so that shear stresses along these boundaries are fully relaxed, or 2) diffusion is assumed to be fast compared to grain boundary sliding so that the normal stresses across the boundaries are fully relaxed [19,20]. Such stress redistributions have been shown from equilibrium considerations in two-dimensional regular arrays of hexagonal grains to increase the diffusion flow rate in and around the grains by a factor of 2 approximately in the first case [20], and to increase the shear stress along the grain boundaries by a factor of 2 in
the second case [22]. If the grain boundaries are assumed in this latter case to slide according to a linear viscous law e.g. by diffusional accomodation around grain boundary obstacles [19], the diffusion creep strain rate in a polycrystal is expected to be about
-27-twice that of a homogeneously stressed body under the same overall applied stress for both cases [20].
Grain boundary migration coupled to grain boundary sliding is often necessary to preserve the coherency of a polycrystal undergoing
diffusion creep [23]. Diffusion creep is thus expected to be inhibited if grain boundary sliding or grain boundary migration are impeded.
1.2.2 Dislocation Creep
The stress sensitivity of the creep strain rate has been found to increase, as the applied stress is increased to levels where dislocation motion is possible [18]. In this regime of dislocation-creep, the
steady state creep strain rates are usually fitted to a power-law function of the applied stress:
n
S = B ac (1-9)
S c
where B is a material and temperature dependent constant. The value of c
the exponent n has been experimentally found to be close to about 5 for
most BCC, FCC an HCP pure metals [181. Solid solutions are usually classified into 1) "Class I" alloys for which the stress exponent nc takes a value of approximately 3 and 2) "Class II" alloys for which the stress exponent nc has a value close to 5 [18]. No definite trend can be determined for precipitation hardened alloys, for which stress exponents as low as 3, and as high as 30, have been measured [18].
Under most conditions, the activation energy of steady state dislocation creep in pure metals and solid solution alloys has been found to be similar to that of lattice self-diffusion [18]. The
constitutive equation for steady state dislocation creep in pure metals and solid solution alloy is thus often given as [18]:
s A D ijb/kT (a/u)nc (I-10)
where A = a material constant
u = the material's elastic shear modulus
b = Burger's vector.
Diffusion plays thus an important role in dislocation creep. This is in agreement with the fact that dislocation creep deformation can take
-28-place by dislocation climb controlled mainly by lattice self-diffusion as well as by dislocation glide. Morever, it has been found that the material constant "A" in equation (I-10) for FCC and HCP pure metals and Class II alloys could be written as [24,25].
A
=
A'(YSF 3 ()-3.5where YSF the stacking fault energy.
As expected, the steady state dislocation creep strain rates are low in low stacking fault energy materials (i.e. FCC and HCP), in which the partial dislocations are widely spaced which hinders dislocations climb
by volume difusion [25].
Stable and homogeneous dislocation cell structures develop in the grains during steady state dislocation creep [24,26]. The subgrain size has been found to depend primarily on the applied stress, and not on the
grain size [24,26].
The transgranular deformation during dislocation creep in Class I solid solution alloys is controlled by the glide of mobile dislocations with a viscous drag exerted by solute atom atmospheres [18]. The creep strain rates are then limited by the diffusion rate of the solute atoms accompanying moving dislocations. The strain rate for this "glide controlled" dislocation creep mechanism have been shown to be given by
[18,26]
s = A Diyb/kT (a/u1) 3 (1-12)
where D = the chemical interdiffusion coefficient of the alloy.
In pure metals and Class II solid solution alloys, the dislocation creep deformation is due both to dislocation climb and to dislocation glide [18]. Although the dislocation glide contributes significantly to
the strain, the resulting creep strain rates are controlled by
dislocation climb [18]. At creep temperatures, dislocation climb can proceed independently by volume diffusion or by dislocation core diffusion [18]. The constitutive equation which describes the strain rates for the steady state "climb-controlled" dislocation creep is given
by [18]:
-29-D
= A B pb/kT (a/1)3 (1-13)
s eff
where D eff= an effective vacancy volume diffusion coefficient, defined by [18].
D = D[1+2.5(a/y)2 D /D] (1-14)
eff c
where D = the vacancy dislocation core diffusion coefficient. c
D = the vacancy volume diffusion coefficient.
The stress sensitivity of the dislocation creep deformation rate of the grains is usually higher than that of the grain boundary sliding rate [20, 22]. At sufficiently high applied stress and strain rate, grain boundary sliding is thus negligible compared to the very rapid grain deformation rate. Almost no grain boundary relaxation takes place then, and both the stress and the deformation distributions remain close to being uniform [20,22]. In this high strain rate limit, the steady state dislocation creep strain rates of a polycrystal are thus equal to that of the individual grains (Equation 1-9). On the other hand, the grain boundaries slide almost freely for sufficiently low applied stress and strain rate. The grain boundaries are fully relaxed in this case, and the stress and deformation distributions become extemely
non-uniform. In this low strain rate limit, this results in an enhancement of the overall steady state dislocation creep strain rate, and several models have been proposed to account for that [20,22].
1.2.3. Power-law Breakdown
At the very high stress levels. (i.e. a/p > 10-3-10-2), the steady state creep strain rates have often been observed to be much larger than those predicted by extrapolating the power-law dislocation creep strain rates [18]. Several dislocation creep models were proposed to account-for the enhancement of the creep strain rates at high stress levels
[18]. Since it has been shown that it is very difficult to determine
which model fits the experimental data best, only a semi-empirical power law equation (1-9) at low stresses is given here [18]:
A Db [sinh(aa/i)]nc (1-15)
s kT
-30-where $ and A are material constants. This constitutive equation is yet to be considered as an approximation only since the activation energy for dislocation creep in this high stress regime is usually larger than
that of volume diffusion [18].
1.2.4. Deformation mechanism Maps
Deformation mechanism maps, where fields of dominance of given deformation mechanisms are drawn as a function of the temperature and the applied stress are now available for many pure metals and alloys
[18]. On these deformation maps, fields for the high temperature
deformation mechanisms, which have been reviewed in the present chapter, are shown along with fields for low temperature deformation mechanisms (Figure 1-2).
Deformation mechanism maps allow a considerable range of
information to be presented in a compact, highly visual form. It must however, be emphasized that the accuracy of a map is only as good as the experimental data, and/or, the theoretical equations employed for
construction. Also, maps represent only "steady state" creep.
Moreover, it should be recognized that the "steady-state", if present at all, usually accounts for a relatively small portion of the full creep
curve.
1.3. Phenomenology of Creep Fracture
At temperatures relevant to operation of high temperature components and structures, fracture can take place in a ductile
transgranular or intergranular manner, or as a result of the formation of intergranular wedge cracks or cavitation. Further, at high
temperatures and rapid strain rates, dynamic recrystallization can allow materials to deform and finally fail by necking down to virtually zero cross-section [27] (See Figure 1-3).
Ashby, Gandhi and Taplin [27] have catalogued the
phenomenologically different types of fracture in a number of important engineering alloys in the creep range. The information is presented
typically into complementary forms as shown in Figures (1-4) and (1-5)
-31-BROAD CLASSES OF FRACTURE MECHANISM
DUCTILEFigure 1-3. The simplest classification of fracture mechanisms. The upper row refers to low temperatures where
plastic flow does not depend strongly on temperature or time; the lower row refers to the high temperature range.
-32-BRITTLE
TEMPERATURE, (C)
Z0
60
w
10 W -j7z
w
HOMOLOGOUS TEMPERATURE,(T/T.)
Figure 1-4. Fracture mechanism map of IN-X750 shown in the field of normalized tensile stress vs homologous temperature. U,
(w
0)w
ccz
P40
z
RUPTURE
VEIIESWARAN A TAPLIN fig?4
r:.
NTIERNAIONAL NICXE. CO 1NC1970
(CREEP RACTURE OATA)
INTERNMATONAL NICXKEL Co iNC fig9lT
ITErNSILE TEST OATA)7S 0
10 10' Jo
TIME
TO FRACTURE. (sec)
Figure 1-5. Fracture mechanism map of IN-X750 shown in the field of normalized tensile stress and time to fracture.
-34-z
500w-Z 3000cO
200C
1o0
sofor the case of IN-X750. In Figure (1-4) the isochronal fracture data is presented 4n the field of the normalized tensile stress and
homologous temperature conditions under which the tests were conducted. The strains to fracture in each case are indicated by the number next to the data point. This form of presentation, when taken together with the corresponding deformation mechanism map, for the same material, relates the fracture information to the deformation process that has preceded it. The fields outlined by the tie-contours characterize the regions in which one of the specific phenomenologically different forms of fracture depicted in Fig. (1-3) dominates. Figure (1-5) shows the information in terms of isothermal contours on a field of normalized tensile stress and time to fracture, familiar to the design engineer. As the figure demonstrates clearly, the type of fracture in a typical
commercial alloy such as IN-X750 at high stress and high strain rates, leading to short times to fracture, is transgranular and occurs by
micro-void coalescence, with features almost identical to those in ductile fracture at low temperature. As the stress is decreased to increase the fracture time, fracture becomes intergranular and is apparently dominated by wedge cracks leading to the accumulation of grain facet fractures which then collectively lead to final fracture by eventual interaction and linkage. At lower stresses leading to long fracture times, typically encountered in service, the fracture is dominated by the coalescence of individual grain-boundary cavities.
The transition of fracture from a transgranular form of micro-void coalescence to intergranular cavitation is influenced more than anything else, by grain boundary sliding [20,28]. At high strain rates where grain-boundaries are unrelaxed and the stress distribution is uniform, the deformation of the polycrystal approximates that of a continuum and only non-deformable particles perturb the deformation, regardless of their location (see Section 1.2.2.). If the resulting interface
tractions are high enough, or the particle strength itself is reached, cavities form and grow by power law creep to coalescence [29,30] and eventual transgranular fracture. At lower stresses the tractions on
-35-The following pages are missing from the
original
LOSS OF SECTION (a)
~
s 9 (C) COARSENG S4 t + VMS (d) N0 Y (g) * - i OAMAGE ZONE e A (h) INTERNAd CKICATVN1. ca. at4 0,4 OATION cRAcKING SPLu NGFigure 1-6. The four categories of creep damage according to [31]. 1) Damage by loss of external section 2)Damage by loss of internal section 3)Damage by degradation of the microstucture 4)Damage by gaseous-environmental attack.
matrix particles becomes insufficient to cavitate their interfaces, but much larger stress concentrations begin to arise at particles along sliding as boundaries the shear tractions on the boundary between such particles are relaxed. This results in the nucleation of grain boundary cavities, which grow under the local prevailing normal boundary
tractions.
Although the most common types of creep fracture can be
phenomenologically categorized in three major groups, as it was shown in
Fig. (1-3), there is a big variety of micromechanisms that are
responsible for this process, which we briefly review in the next section.
1.4. Mechanisms of Creep Fracture
Creep fracture is the end result of accumulation of creep damage. Creep damage is a term which has been employed to describe the material degradation which gives rise to the acceleration of creep rates, known as tertiary creep, and eventually leads to creep fracture. Metal science can distinguish between those internal damage processes that
"soften" the material and thus, cause the creep rate to increase and thereby indirectly induce failure, and those that are directly
responsible for the actual fracture of the material.
Ashby and Dyson [31] distinguish four broad categories of creep-damage while recognising that each may contain more than one mechanism Fig. (1-6). Any one mechanism operating alone can cause final fracture or rupture. More usually, fracture is the result of the opertion of two or more mechanisms, sometimes operating sequentially, sometimes
simultaneously. The categories of creep damage according to Ashby and Dyson [31] are the following:
Damage by Loss of External Section
Deformation at constant volume causes a shape change. During creep under a constant tensile load, the section decreases, stress slowly
increases and the creep rate accelerates (Figs (I-6a) and (I-6b)). In
the absence of other damage mechanisms, failure occurs when the material necks to a point. Usually, other damage mechanisms (discussed below)
-38-intervene and lead to failure at a finite reduction in area; but at very
high temperatures (T>0.8Tm) pure metals and solid solution alloys often rupture by this mechanism alone.
Damage by Loss of Internal Section
(a) Formation of holes at grain boundaries. The mechanism most widely studied experimentally and modelled theoretically is hole
formation, or cavitation, either within the grains (Fig (I-6c)) or at the grain boundaries (Fig (I-6d)). Most commonly, the holes appear on boundaries which lie roughly perpendicular to the maximum principal tensile stress direction. Their presence reduces the section and so accelerates the creep and this, in-turn, increases the rate at which the
damage grows. At low stresses the damage is void-like; at high, the voids may link to give grain-boundary cracks (Fig. (I-6d)). Many pure metals and industrial alloys can fracture by this mechanism alone,
though it is more usual for other mechanisms to contribute also.
(b) Growth of single dominant cracks. An industrial component
has a spatially-inhomogeneous stress distribution which may result in the formation of discrete crack, which then generates an even smaller zone of damage around its tip (Fig. (I-6e)).
Damage by Degradation of the Microstructure
(a) Thermal coarsening of particles. Many alloys in service under load at high temperatures are deliberately strengthened by second-phase particles: y' in superalloys, intermetallics in aluminum alloy,
carbides in ferritic and austenitic steels. During creep, those coarsen or are replaced gradually by more stable particles; both forms of aging can accelerate creep (Fig. (I-6f)), and eventually cause fracture.
(b) Substructure induced acceleration of creep. Although
particle-coarsening can account for some observations of tertiary creep without loss of section, it is unable to explain data for a large family
of nickel-based superalloys [8]. Here an acceleration of creep is
-39-associated with the way in which dislocations accumulate during creep. This is the least well understood mechanism of tertiary creep.
Damage by Gaseous-Environmental Attack
(a) Damage by internal oxidation. Exposure to aggressive gases before or during creep often accelerates creep and reduces the life. If a component is heated in an oxidizing atmosphere for example, oxygen penetrates the metal. The inward-diffusing oxygen reacts with impurities to give a zone of internal oxidation (Fig. (I-6i)). In this
zone, gas bubbles (C02, H20) may form on grain boundaries; or
precipitated solid oxide may act as nuclei for voids. Both the bubbles and the voids degrade the strength within the zone.
(b) Damage by failure of external oxide. Creep can disrupt an
otherwise-protective surface film, by straining it until it fractures. (Fig. (I-6)j). If it does, environmental attack restarts at cracks or spalls, which may also act as sources for internal oxidation.
For each mechanism described above, a pair of differential
equations is derived, which describes the creep and fracture behavior of the material, if that mechanism operates alone throughout the life. One equation describes the rate at which damage accumulates, and an
associated equation for the rate at which the material creeps [311. Since the intergranular mode of fracture due to cavitation and internal cracking is the most dominant in service conditions we will concentrate our attention on this mechanism of fracture, while
recognizing the fact that other mechanisms may become critical for particular materials and service conditions.
-40-II. INTERGRANULAR CREEP FRACTURE
Metals and alloys with high ductilties at room temperature have
been observed to fail with a very limited ductility under creep
condition (T>0.3Tm) for low applied stresses. This ductility reduction has been found to be related to the fact that premature brittle
intergranular fracture becomes predominant as the temperature is
increased and the strain rate decreased. The internal damage ultimately responsible for interganular creep fracture starts as individual grain boundary cavities. The cavities multiply and grow to form cracks on individual grain surfaces (single grain facet cracks) (Fig. (II-1)). From a predictive point of view we need to determine which of the two
stages, formation of single grain facet cracks by individual cavity nucleation and growth or formation of a critical multiple grain facet crack is life limiting. This problem will be addressed in the next
chapter. In either cases, we need to develop constitutive equations that describe the kinetics of the materials' deterioration process and establish relationships with measurable macroscopic quantites that can be used to predict the rupture behavior of alloys.
In the development of constitutive equations two approaches have been used. The first, is the approach of the material scientist which concentrated directly on the nature and the mechanisms of creep damage. The second is the phenomenological approach of Continuous Damage
Mechanics in which creep damage is treated as a scalar quantity, with no particular reference to the specific nature of damage.
II.1 The Micromechanistic Approach
Integranular creep fracture is generally associated with the formation of wedge cracks at the grain boundary triple points or with the nucleation, growth and eventual coalescence of grain boundary
-cavities. During long term creep exposure, intergranular failures are normally associated with cavitation. A comprehensive understanding of creep fracture thus requires, the investigation of the mechanisms of cavity nucleation and growth.
-41-DISLOCATIONS CAVITIES
MICROCRACKI
MICRO-SLIP
INITIATION
PROPAGATIONJ
BANDS
MACROSCOPIC
MACRO-CRACK
PROPAGATION
INITIATION
DAMAGE MECHANICS
-
FRACTURE
|
MECHANICS
VITATION WEDGE CRACK
ONE MAINd
:
MACROSCOPIC
CRACK
Figure II-1. A schematic illustration of the development of creep fracture.
-42-II.1.1 Cavity Nucleation
The nucleation of grain boundary cavities is due to the
agglomeration of vacancies on boundaries in which large normal stresses are present. This problem has been examined as a classical nucleation process (Fig. (11-2)) and a rate equation describing the nucleation rate has been proposed (28,33,34,35):
p = p exp(-AG /kT) (II-1)
p =(2lr D
6/Q4/
3)exp(a
n/kT)
(II-1.a)
r =2a2X /a (II-1.b)
* s n
G= 4/3 a2X /a2 F (a) (II-1.c)
s n v where a = cos- 1(X /2X
)
freB s
WG= free energy of critical nucleus *
r = radius of critical nucleus
Db= grain boundary diffusivity
6 = grain boundary thickness
Q = atomic volume
a = local normal stress
n
X sX = surface and boundary free energy respectively F (a) shape factor .
v
Argon et al
[35]
have shown that the nucleation rate drops significantly even at high temperature, when (a /E) is less than 5 x10⁻³. Since then
applied stresses are much below this value, it is necessary to conclude that nucleation of cavities is the results of stress concentration along the grain boundaries. That this must be so, was established by Grant and co-workers [36,37] who have demonstrated experimentally that
cavity or crack formation along grain boundaries in creeping alloys requires both the presence of grain-boundary particles and grain
boundary sliding. Argon et al [28,35] have obtained solutions for the stress concentrations that arise from grain boundary sliding at: (I) hard g.b particles giving rise to round grain-boundary cavities; and (II) triple points giving rise to wedge cracks. The stress
-43-Figure 11-2. Nucleation of a cavity on a stressed interface.
Grain boundary
C
Cavity
A
B
IC
A
Figure 11-3. The distribution of stress on a grain boundary outside the cavity.


![Figure 1-6. The four categories of creep damage according to [31]. 1) Damage by loss of external section 2)Damage by loss of internal section 3)Damage by degradation of the microstucture 4)Damage by gaseous-environmental attack.](https://thumb-eu.123doks.com/thumbv2/123doknet/14517980.530879/37.918.196.720.152.740/figure-categories-according-external-internal-degradation-microstucture-environmental.webp)