HAL Id: inserm-00482661
https://www.hal.inserm.fr/inserm-00482661
Submitted on 11 May 2010HAL is a multi-disciplinary open access archive for the deposit and dissemination of sci-entific research documents, whether they are pub-lished or not. The documents may come from teaching and research institutions in France or abroad, or from public or private research centers.
L’archive ouverte pluridisciplinaire HAL, est destinée au dépôt et à la diffusion de documents scientifiques de niveau recherche, publiés ou non, émanant des établissements d’enseignement et de recherche français ou étrangers, des laboratoires publics ou privés.
Trends in the association between height and
socioeconomic indicators in France, 1970-2003.
Archana Singh-Manoux, Julie Gourmelen, Jane Ferrie, Karri Silventoinen,
Alice Guéguen, Silvia Stringhini, Hermann Nabi, Mika Kivimaki
To cite this version:
Archana Singh-Manoux, Julie Gourmelen, Jane Ferrie, Karri Silventoinen, Alice Guéguen, et al.. Trends in the association between height and socioeconomic indicators in France, 1970-2003.. Eco-nomics & Human Biology, 2010, 8 (3), pp.396-404. �10.1016/j.ehb.2010.03.002�. �inserm-00482661�
Trends in the association between height and socioeconomic indicators in France, 1970-2003 Archana Singh-Manoux 1,2,3* Julie Gourmelen 1 Jane Ferrie 2 Karri Silventoinen 4 Alice Guéguen 1 Silvia Stringhini 1 Hermann Nabi 1 Mika Kivimaki 2 *
Corresponding author & address
1
INSERM, U1018, Centre for Research in Epidemiology and Population Health Hôpital Paul Brousse, Bât 15/16
16 avenue Paul Vaillant Couturier 94807 Villejuif Cedex, France
Tel: + 33 177747410; Fax: + 33 177747403 Email: Archana.Singh-Manoux@inserm.fr
2
Department of Epidemiology and Public Health University College London, UK
3
Centre de Gérontologie, Hôpital Ste Périne, AP-HP
4
Abstract
Average physical stature has increased dramatically during the 20th century in many
populations across the world with few exceptions. It remains unclear if social inequalities in height persist despite improvements in living standards in the welfare economies of Western Europe. We examined trends in the association between height and socioeconomic indicators in adults over three decades in France. The data were drawn from the French Decennial Health Surveys: a multistage, stratified, random survey of households, representative of the population, conducted in 1970, 1980, 1991, and 2003. We categorised age into 10-year bands, 25-34, 35-44, 45-54 and 55-64 years. Education and income were the two socioeconomic measures used. The slope index of inequality (SII) was used as a summary index of absolute social inequalities in height. The results show that average height increased over this period; men and women aged 25-34 years were 171.9 and 161.2 cm tall in 1970 and 177.0 and 164.0 cm in 2003. However, education-related inequalities in height remained unchanged over this period and in men were 4.48 cm (1970), 4.71 cm (1980), 5.58 cm (1991) and 4.69 cm (2003), the corresponding figures in women were 2.41, 2.37, 3.14 and 2.96 cm. Income-related inequalities in height were smaller and much attenuated after adjustment for education. These results suggest that in France, social inequalities in adult height in absolute terms have
remained unchanged across the three decades under examination.
1. Introduction
Average height has increased dramatically during the 20th century in many populations across the world with some notable exceptions (Cole, 2003; Moradi, 2010). In Western-European countries, the secular trends suggest an increase of about 1 cm in height per decade (Cole, 2000). There are at least two reasons to suggest that socioeconomic factors contribute to differences in height. First, differential economic development is reflected in the mean height of populations; a comparative study on Sweden and Finland shows narrowing height differences between the two countries in parallel with a narrowing of economic differences after the Second World War (Silventoinen et al., 2001). Second, socioeconomic factors within countries have repeatedly been shown to be associated with height (Batty et al., 2009;
Cavelaars et al., 2000; Deaton & Arora, 2009; Meyer & Selmer, 1999; Peck & Vagero, 1987; Walker et al., 1988). Childhood socioeconomic conditions influence stature in childhood and adulthood (Billewicz et al., 1983; Bogin & MacVean, 1983; Peck & Vagero, 1987; Rona et
al., 1978) and higher adult social position is associated with taller adult height (Cavelaars et al., 2000; Marmot et al., 1984; Meyer & Selmer, 1999; Silventoinen, 2003; Walker et al.,
1988). The most important non-genetic factors affecting body height are seen to be nutrition and disease, both of these are socially patterned (Silventoinen, 2003). Another explanation for this association is the discrimination hypothesis, where discrimination against short stature has been suggested as an explanation for lower attained education in a study on 950 000 Swedish men born between 1950-75 (Magnusson et al., 2006).
The association between height and socioeconomic indicators exists also in “officially classless” societies such as the former German Democratic Republic (Komlos & Kriwy, 2002). However, the extent of inequalities remains unclear given the improvements in living standards in the welfare economies of Western Europe. Data on the height of children have been used to support both continuing (Whincup et al., 1988) and diminishing social
inequalities (Li & Power, 2004; Liestol & Rosenberg, 1995). Data on adult height are also not conclusive in terms of the trend in height differences as a function of markers of
socioeconomic position (SEP). A study on British men born between 1919 and 1939 shows height differences related to SEP to be similar in the younger and the older cohorts (Walker et
al., 1988). A European comparative study on adults born between 1920 and 1970 also showed
persistent education related differences in height (Cavelaars et al., 2000).
A key issue in the estimation of trends is the changing nature of socioeconomic
indicators such as education. As the education levels of populations improve and as fewer and fewer people leave school with no academic qualifications, it becomes meaningless to
compare the height of the most and the least educated if this cohort effect has not been taken into account. Thus, estimates of social inequality need to take into account the distribution of the socioeconomic measure. The objective of the present study is to examine the trends in inequalities in height in France as a function of education and income using 4 waves of data that cover birth years from 1906 to 1978. We use a weighted summary index, the slope index of inequality to be described below,(Mackenbach & Kunst, 1997) to allow comparisons to be made across time despite changes in the population distribution of education and income.
Numerous studies have shown that socioeconomic position across the lifecourse is associated with health and well-being (Hallqvist et al., 2004; Lynch & Smith, 2005). The two socioeconomic indicators used in this study, education and income, come from different points in the lifecourse. Education reflects early socioeconomic circumstances, including parental social position. Income is a later life measure of socioeconomic circumstances, which can change over the adult life course and is therefore less tightly connected with
socioeconomic origins. Furthermore, education is mostly unchanging once one enters professional life whereas income continues to change over adulthood. Estimation of height inequalities related to both education and income, particularly that for income after
adjustment for education, will allow us to shed light on the “discrimination” hypothesis (Magnusson et al., 2006).
2.1 Data
Data are drawn from the Decennial Health Surveys (DHS, Enquête Décennale Santé,
http://www.irdes.fr/EspaceRecherche/Enquetes/EnqueteSanteSoinsMed.htm) of 1970, 1980, 1991 and 2003. The DHS data are collected every 10 years by the French National Institute of Statistics and Economic Studies (Institut National de la Statistique et des Etudes
Economiques, INSEE) using a multistage, stratified, random survey of households sampled on the basis of data from the last available national population census. A random sample of households, at least 5% in each strata, is drawn from the census list of households stratified on regions in France and using 5 categories of population density (rural, <20 000 inhabitants, between 20 000 and 100 000 habitants, ≥100 000 inhabitants, and Paris). The DHS surveys are representative of the French population with the exception of people in institutions (e.g., retirement homes, religious communities, prisons and hospitals), mobile homes and the homeless; approximately 98% coverage of the entire population (Maillard et al., 1999). Using a combination of face-to-face interviews and self-administered questionnaires, the DHS collects data at the individual and household levels, including information on demographic
characteristics, socioeconomic and health status, insurance coverage complementary to the basic coverage provided to all French residents and the use of medical care. The response rate in the four surveys was as follows 64.2% (1970), 63.7% (1980), 66.3% (1991), and 68.4% (2003).
2.2 Variables
Education, based on participants' report, was assessed as the highest achieved education level, categorised into six levels: no formal education, primary school, lower secondary school, vocational qualification, “Baccalauréat” (secondary school diploma, usually taken at age 18 ), and higher than “Baccalauréat”.
Income measure was annual household income reported by the participant (de Saint, 2009). In the event the respondent did not want to provide precise information on income, they were offered a range, and the mid value of this range was considered to be the household income. The French National Institute for Statistics and Economic Studies (INSEE), which carried out the surveys, has a complex procedure of imputation of income for those with missing values. The measure of income used in the analysis was further converted to income per consumption unit to reflect household size and composition. In France, INSEE defines consumption units as follows: the first adult (head) of a multiple-person household as 1 unit, subsequent adults and children over 14 in the household as 0.5 units and children under 14 as 0.3 unit.
Height was self-reported in all four surveys.
Place of birth was a multiple choice question on nationality with the following response categories: born in France, acquired French nationality, or of another nationality. This measure was included only in the 1991 and 2003 survey and we will analyse these two years separately in order to ascertain the extent to which birthplace affects our results.
3. Methods
The association between height and the two measures of SEP, first education and then income, was examined using the slope index of inequality (SII) (Mackenbach & Kunst, 1997). The socioeconomic groups were first ordered from highest to lowest. The population of each socioeconomic group, each category in the case of education and each value in the case of household income, was assigned a ridit score (a fractional rank from 0 for the highest SEP to 1 for the lowest SEP), based on the midpoint of their range in the cumulative distribution in
the population. For example, if the highest category for education comprises 20% of the population, each individual in this category is assigned a value of 0.1 (0.2/2), and if the second highest category comprises 30% of the population, the corresponding individuals are assigned a value of 0.35 (0.2 + (0.3/2)), and so forth. Height was then regressed on the ridit score, the beta or slope coefficient is the SII and represents the predicted difference in height between the theoretical highest (percentile rank 0) and lowest (percentile rank 100)
educational level in the population. The SII has considerable advantage for comparisons across time as it takes into account the changing size of the education categories or income. An additional advantage is that the fractional rank allows the size of the socioeconomic groups to be taken into consideration. The resulting estimate of inequality thus uses all the available data and is not restricted to comparisons between extreme socioeconomic groups.
We calculated the SII using the DHS data from 1970, 1980, 1991 and 2003 for
education and income. We categorised individuals into four groups: 25-34 years, 35-44 years, 45-54 years and 55-64 years for age-group specific analyses. For each survey year and for the four age-groups, we calculated the fractional ranks for education and income. We also
examined overall trends in men and women aged 25-64 years; these latter analyses were adjusted for age, treated as a continuous variable. A linear test for trend was used to examine whether inequalities increased over time. The analysis using income also involved adjustment for education as a second step. Sampling weights provided by INSEE were used to correct for systematic non-response bias. This procedure allows data to be weighted in an inversely proportional relationship to the non-response probabilities of individuals with the goal of the data being representative of the French population.
French constitutional law embraces equality as a founding principle and prohibits the collection of data on race, ethnicity or religion. As it is well known that race and ethnicity are associated with body size (Bogin & Rios, 2003), we undertook further analyses in order to assess the extent to which our results were influenced by immigration into France. For the last two waves, 1991 and 2003, the DHS surveys included information of whether the participant “was born in France”. 92.2% of the men and 92.9% of the women surveyed in 1991 indicated that they had been born in France; the corresponding figure in 2003 was 89.8% for both sexes. We reanalysed inequalities related to education and income in this subgroup for the surveys conducted in 1991 and 2003. It must be noted that this is only an indirect measure of “ethnicity” and does not allow us to exclude non-Caucasians if they were born in France
4. Results
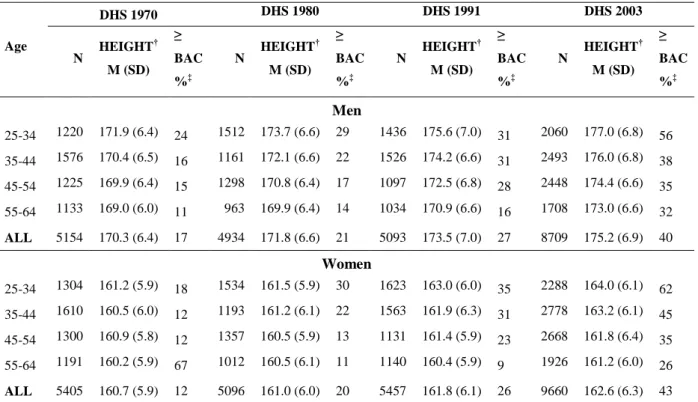
Table 1 presents the average height of men and women in four age-groups and for the four DHS surveys. For any given survey year, height decreased with age. This increasing trend in mean height in recent years was also suggested by the increase in height in all age-groups in the later surveys compared to the earlier surveys. Table 1 also shows the proportion of the population educated at least to “Baccalauréat” level to increase.
TABLE 1 ABOUT HERE
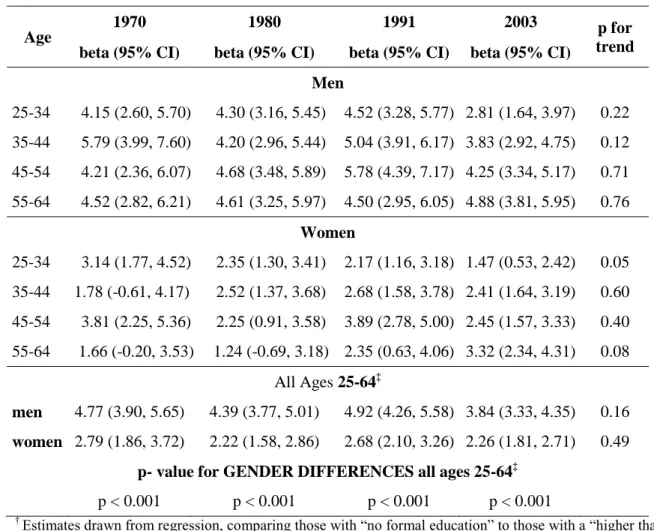
Table 2 shows the height advantage of the most educated group (qualification higher than “Baccalauréat”, secondary school diploma, usually taken at age 18) compared to the least educated those with “no formal education”. Interpretation of the differences is made difficult by the fact that the composition of these groups changed over the survey years. In men, the least educated group shrank over the survey years from 34.2% in 1970, to 27% 1980 and then to 19.7% and 14.7% in the 1991 and 2003 surveys, respectively. The size of the most
educated group grew from 4.6% in 1970 to 27% in 2003. In women the changes were similar. The least educated groups over the four surveys were: 37.6% (1970), 28.6% (1980), 21.2% (1991) and 15.6% (2003). The most educated group grew from 2.5% in 1970 to 27.7% in 2003. Thus, it is difficult to interpret these results in any meaningful way.
TABLE 2 ABOUT HERE
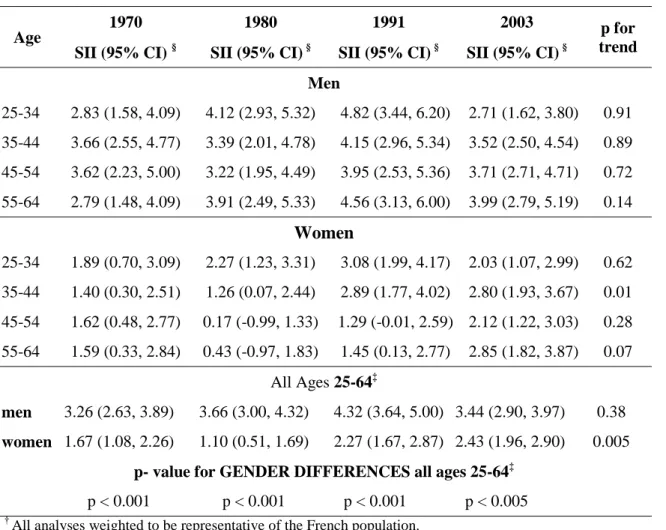
Next we estimate the linear gradient of the relationship between education and height using the index of inequality, rather than the discrete education categories as in Table 2. In Table 3 we present the mean difference between the most and least educated individuals using the estimated slope parameter. The test for trend suggests no evidence of increasing or
decreasing inequality in height in men, except for the oldest age group where there appears to be some evidence of increasing inequality. The results for women also tend to show persistent educational inequalities in height over time. The analysis of men and women of all age-groups combined together show greater inequalities in men than in women at all survey phases.
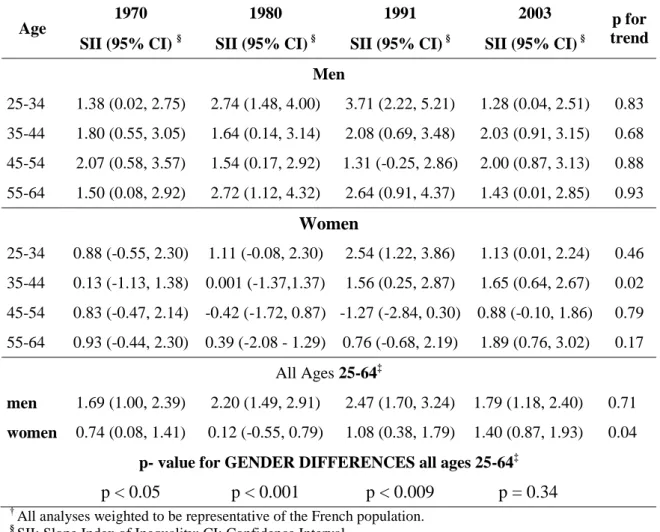
Table 4 shows results using income to assess inequalities in height in the four survey years using the SII slope estimates. Here again, the height inequalities were greater in men than in women. These inequalities, albeit smaller than those associated with education, also appear to have remained unchanged over time in men with some evidence of an increase in women. Next, these analyses were adjusted for the effect of education by entering it into the regression containing the ridit score for income as the predictor variable (Table 5). There are two key findings. First, inequalities in height related to income were much attenuated after adjustment for education. Second, inequalities in men remained larger than in women and there was no trend among men but some evidence of a trend among women
TABLES 4 & 5 ABOUT HERE
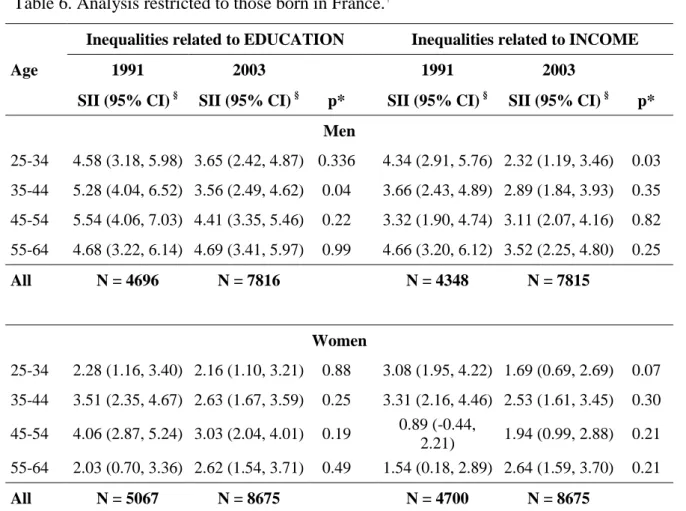
Table 6 shows height differences of those born in France as a function of education and income and are comparable to the results on the total population presented in tables 2 and 3. Analysis restricted to those born in France somewhat reduces the inequalities but they still remain substantial. There were no differences in inequalities at the surveys 1991 and 2003. Income related inequalities in this sub-group when adjusted for education yielded results similar to that using all the data (results not shown).
TABLE 6 ABOUT HERE
5. Discussion
The four Decennial Health Surveys cover three decades and birth cohorts from approximately 1906 to 1978. Analysis using these data reveals that height in France has continued to increase over this period. However, education-related inequalities in height, at between 4.5-5.6 cm in men and 2.4-3.1 cm in women depending on the survey year, have remained basically unchanged over this period. The association between income and height is smaller and confounded by the effect of education. The principal strength of the study is the wide observation window used to examine social inequalities in height in a dataset which represents the French population at each of the four time points. A further strength is the use of estimates of absolute inequality in height that are comparable across time.
5.1 Comparison with other studies
Previous analysis of historical data from the time of the French revolution shows that men from an elite academic institution, the Ecole Polytechnique, were 7cm taller than their countrymen (Komlos et al., 2003). We found a mean 5 cm increase in height between 1970 and 2003 in men and a 2 cm increase in women, with no real change in gender differences in height. Recent analysis of Swedish data from the 10th to the end of the 20th century shows no real increase in gender differences in height (Gustafsson et al., 2007). It has been suggested that both genetic and environmental factors, diet in particular, may lie behind gender differences in height (Costa-Font & Gil, 2008; Gray & Wolfe, 1980).
The fact that height increased over the observational period in our study is in keeping with other historical data on secular increases in height in European countries starting from as far back as the middle of the 19th century (Floud, 1989; Gustafsson et al., 2007). Height of the French male population, drawn from military records, born between 1660 and 1760 has been shown to vary as a function of the socioeconomic environment (Komlos et al., 2003). Such trends cannot be explained by genetic influences. Indeed, despite the large heritability component of body height, the importance of environmental factors is seen to be non
negligible as they contribute to 20% of the within population variation in height (McEvoy & Visscher, 2009; Silventoinen et al., 2003). Striking examples of the importance of
environmental factors also come from evidence on growth plasticity in immigrant children (Bogin & Loucky, 1997; Smith et al., 2003). Maya children living in the United States were reported to be 11.54 cm taller than those living in Guatemala (Bogin et al., 2002).
One key issue in examining trends in the association between height and socioeconomic indicators is to assess whether secular increases in height, improving socioeconomic conditions and establishment of the welfare state has eradicated this association in recent cohorts. Our results show this not to be the case in France, a wealthy Western European country with universal health care since 1945. We use data that are
representative of the French population; however, we did not examine whether the trend in the association between socioeconomic factors and height was similar in all regions of France. Our data on place of residence are accurate but as these are cross-sectional surveys we do not have information of the place of residence over the lifecourse and we can take geographical mobility within France into account in the analysis. Thus, we chose to focus on trends over time in France, using data that are representative of France.
In principle, the association between markers of socioeconomic circumstances and height could be due either to; a common cause, due to the consequence of poor nutrition and
diseases in childhood, or due to processes such as discrimination in the labour market. The first explanation views common social, psychological or biological factors as being
responsible for both height and education. Data from the StockholmBirth Cohort Study show the net effect of height on education, given a certain level of cognition, to be modest (Vagero & Modin, 2006). Many authors emphasize the second explanation, childhood nutrition or disease, for social inequalities in adult stature (Cavelaars et al., 2000; Peck & Vagero, 1987; Silventoinen et al., 2001). A recent paper supports the third explanation, discrimination against short stature in the labour market, as it found childhood SEP and cognitive ability to explain little of the education-height association (Magnusson et al., 2006). Further support for the discrimination hypothesis comes from French data showing that even after controlling for educational achievement taller men have better careers as they are given more supervisory responsibilities (Herpin, 2005).
Our analysis provides indirect evidence against discrimination in the labour market as an explanation for inequalities. We found greater inequalities with education rather than income and furthermore income inequalities were substantially attenuated after adjustment for education. Education, often used as a proxy indicator of childhood SEP, is associated with later life measures such as occupational position and income(Singh-Manoux et al., 2002) and is likely to be a confounder of the association between income and height. Substantial
attenuation of this association after adjustment for education suggests that discrimination against short stature is not a major explanation of social inequalities in height. Similarly, other studies have shown a weaker association between height and adult SEP than childhood SEP (Power et al., 2002; Silventoinen et al., 2001).
In general, socioeconomic factors in childhood might influence height through their effect on living conditions such as bad housing, malnutrition or inadequate access to health care. However, economic development and health care provision in France suggests that these are unlikely to be important in more recent birth cohorts. Cavelaars et al suggest that
improvements in the living conditions of the lower socioeconomic groups might have been counterbalanced by other adverse factors such as unbalanced diets and maternal smoking (Cavelaars et al., 2000). This is a plausible hypothesis and along with alcohol consumption in pregnancy needs further exploration in future studies.
5.2 Trends in social inequalities: Methodological issues
There are several methodological issues that beset analysis of trends in the association between SEP and height. First, age related shrinkage in height requires the analysis to be able
to separate ageing effects from those of birth cohort effects (Cline et al., 1989). We grouped age into 10 year bands to examine height differences as a function of SEP in each age-group. Thus, the effect of shrinkage is unlikely to play a major role in the conclusions drawn in our study.
Second, the choice of method used to assess social inequalities and trends in
inequalities is not straight forward and increasingly seen to be an important issue (Keppel et
al., 2005; Krieger et al., 2008). Inequalities in an outcome measure such as height can be
analysed in two ways. The first involves a pair-wise comparison either with each
socioeconomic group compared to a „reference‟ group or height difference between extreme categories of a measure of SEP. The second involves use of a summary measure, as is the case in our analysis, where the interest is in the inequality in height across the entire distribution of the socioeconomic measure. Summary measure of social inequality can either be unweighted or weighted to reflect the population distribution of the socioeconomic indicator under consideration.
Much research on social inequalities in height uses unweighted pair wise comparisons. For example, the results from 10 European countries showing height difference of 1.6 - 3.0 cm in men and 1.2 - 2.2 cm in women between the low and high education groups do not take the size of these groups into account (Cavelaars et al., 2000). Cavelaars and colleagues categorised the 5-level measure of education from the 10 countries into two groups, low and high education as those with less and more than upper secondary school education. These provide relatively robust results even though there is tremendous loss of information on the measure of education. Furthermore, had the comparisons been based on the 5 level measure, it is possible that the extreme education categories, here no education and a university degree or more, would have had a different population distribution in the 10 European countries. Use of a summary weighted index in this scenario would have allowed estimations of inequality in height across the population distribution of education.
Use of weighted summary indices is particularly valuable for the analysis of trends in social inequalities in height. For instance, a British study reported that the average height of manual workers born in 1938 was the same as that of non-manual workers born in 1920 without taking into account changes in the proportion of the population engaged in manual work (Walker et al., 1988). Unweighted measures of trends in social inequalities imply that the interest is in a specific socioeconomic group, regardless of its share of the population over time. Thus, had our research objective been to examine the height disadvantage among those with “no education” across the 4 surveys from 1970, 1980, 1991, and 2003 we would not have
used summary indices. However, our objective was to examine trends in social inequalities in height across the 4 surveys and not using weighted indices would bias the results. For
example, a 25 year old man with no education in 1970 survey is likely have different characteristics from someone the same age with no education in 2003 in his social and behavioural profile and indeed in his employment prospects. Table 1 clearly shows the improving education levels over time, or the cohort effects, in these data. Comparing extreme educational groups over time is meaningless as a 25 year old man with no education in 2003 is in the minority.
The advantage of using SII is that it is a weighted index with the weights being the proportions of the population in each education category or income measure. The SII incorporates the average height in all groups and the proportions of the population they reflect. Education measures are prone to cohort effects due to upward secular trends in educationalattainment among all groups (Hadden, 1996). Our use of a weighted summary index allows us to incorporate the changing structure of educational achievement within a society. Thus, the SII is interpreted as the average difference in height over the entire population ordered by level of the socioeconomic indicator. An SII of 0 would indicate that there is no consistent relationship between height and the socioeconomic variable. There is considerable evidence to show that the association between measures of socioeconomic position and height is linear (Magnusson et al., 2006; Whincup et al., 1988), allowing easy interpretation of this index .
The SII does not show social inequalities in height to have decreased over the four survey years in France; in women there is some evidence of an increase. It is possible that the increase in inequalities in women is related to the changing economic role of women in that as they enter the labour market in larger numbers, they are more subject to discrimination. It must be noted that the income related inequalities in women are no larger than those related to education so discrimination in the labour market is not a complete explanation of increasing inequalities in women. It must also be noted that the increase in inequalities in women is not consistent in our data as it is not evident in every age-group.
Previous research on adult height, despite methodological limitations, mostly suggests persistence in social inequalities (Cavelaars et al., 2000; Kuh et al., 1991; Silventoinen et al., 2001; Walker et al., 1988). However, some studies suggest a trend of decreasing inequalities (Peck & Vagero, 1987), with greater secular increases in height in the lower socioeconomic groups seen to be the explanation of this reduction in social inequalities in height (Peck & Vagero, 1987). This hypothesis makes sense as the last century has seen the emergence of
welfare states and universal health care in most European countries. Nevertheless, our data, using a wider observation window than has been possible previously, suggest no reduction in social inequalities in height.
Finally, recent immigration could be an artefactual explanation of the persistence of height inequalities in France. However, immigrants compose under 10% of the French population, a figure that has been stable for the last 25 years (Boeldieu & Borrel, 2000). Furthermore, we were able to repeat the analysis for the last two surveys on participants born in France and these estimates do not provide evidence for immigration as an explanation of the results. Nevertheless, these results need to be interpreted with the “healthy immigrant effect” in mind as filtering through self-selection, official health screening, and employability, are seen to select healthier immigrants relative to those left behind.
The use of self-reported rather than directly measured height is a limitation in our study. It is well known that height is overestimated in self-report data, particularly among men (Niedhammer et al., 2000) and this has also been shown with the DHS data (Dauphinot
et al., 2009). There is some evidence to suggest an underestimation of socioeconomic
differences in height when it is self-reported (Bostrom & Diderichsen, 1997; Niedhammer et
al., 2000). Therefore, the use of self-reported data is problematic when the goal is to assess
social inequalities as socioeconomic indicators might influence the reporting of height,
leading to an under or an over estimation of social inequalities. However, when the goal is the assessment of trends over time, as in our case, then the results are biased if socioeconomic factors influence reporting of height differently at different time periods. This is unlikely and there is no reason for the analysis of trends to be biased when height is self-reported at every survey (Bostrom & Diderichsen, 1997). In surveys, the precise method used to collect reported data has been shown to influence discrepancies between measured height and self-reported height with in-person interviews, like in the DHS, showing less bias than telephone interviews (Ezzati et al., 2006). For our analysis, the key point is not the extent of the bias in self-reported height but whether the bias changes over time. Ezzati and colleagues use data from the American National Health and Nutrition Examination Surveys (NHANES) to show that the difference between self-reported and measured anthropometric data run parallel over time. Thus, one can conclude that the analysis on trends in height over time, are unlikely to be biased in our study. A final caveat is related to change in data collection methods in the DHS surveys. Until 1991 one person in the household provided information on all members of the household, but at the 2003 survey a decision was made to collect data on individual
these data, no change in social inequalities in height was seen after this change in methodology, suggesting that methodological bias in trends is unlikely. Indeed previous analysis of trends in obesity shows self-report data accurately to reflect the trend in France (de Saint, 2009; Singh-Manoux et al., 2009).
In summary, our analysis based on cross-sectional surveys repeated four times suggests no decrease in absolute social inequalities in height in France between birth cohorts from 1906 to 1978, either as a function of education or of income.
Acknowledgements
ASM is supported by a “European Young Investigator Award” from the European Science Foundation and a grant from Drees – MiRe, Convention n°07/997. We would like to thank all members of the INSERM research unit 687 who contributed to discussions on relative and absolute measures of inequality. ASM, MK and JEF are supported by the National Institute on Aging, NIH (R01AG013196 and R01AG034454), NIH, US; MK is supported by the National Heart, Lung, and Blood Institute (R01HL036310) and the Academy of Finland. We would like to thank Jean-Louis Lanoe at U687, INSERM for providing information on the DHS surveys.
Table 1. Data on height and education from 4 Decennial Health Surveys (DHS) 1970-2003 for samples of adult *men and women representative of the French population.
Age DHS 1970 DHS 1980 DHS 1991 DHS 2003 N HEIGHT † M (SD) ≥ BAC %‡ N HEIGHT † M (SD) ≥ BAC %‡ N HEIGHT † M (SD) ≥ BAC %‡ N HEIGHT † M (SD) ≥ BAC %‡ Men 25-34 1220 171.9 (6.4) 24 1512 173.7 (6.6) 29 1436 175.6 (7.0) 31 2060 177.0 (6.8) 56 35-44 1576 170.4 (6.5) 16 1161 172.1 (6.6) 22 1526 174.2 (6.6) 31 2493 176.0 (6.8) 38 45-54 1225 169.9 (6.4) 15 1298 170.8 (6.4) 17 1097 172.5 (6.8) 28 2448 174.4 (6.6) 35 55-64 1133 169.0 (6.0) 11 963 169.9 (6.4) 14 1034 170.9 (6.6) 16 1708 173.0 (6.6) 32 ALL 5154 170.3 (6.4) 17 4934 171.8 (6.6) 21 5093 173.5 (7.0) 27 8709 175.2 (6.9) 40 Women 25-34 1304 161.2 (5.9) 18 1534 161.5 (5.9) 30 1623 163.0 (6.0) 35 2288 164.0 (6.1) 62 35-44 1610 160.5 (6.0) 12 1193 161.2 (6.1) 22 1563 161.9 (6.3) 31 2778 163.2 (6.1) 45 45-54 1300 160.9 (5.8) 12 1357 160.5 (5.9) 13 1131 161.4 (5.9) 23 2668 161.8 (6.4) 35 55-64 1191 160.2 (5.9) 67 1012 160.5 (6.1) 11 1140 160.4 (5.9) 9 1926 161.2 (6.0) 26 ALL 5405 160.7 (5.9) 12 5096 161.0 (6.0) 20 5457 161.8 (6.1) 26 9660 162.6 (6.3) 43
* Analysis restricted to those 25 to 64 years of age.
† M: Mean; SD: Standard deviation.
Table 2. Difference in height between the most and the least educated using conventional categories of education.†
Age 1970 1980 1991 2003 p for
trend beta (95% CI) beta (95% CI) beta (95% CI) beta (95% CI)
Men 25-34 4.15 (2.60, 5.70) 4.30 (3.16, 5.45) 4.52 (3.28, 5.77) 2.81 (1.64, 3.97) 0.22 35-44 5.79 (3.99, 7.60) 4.20 (2.96, 5.44) 5.04 (3.91, 6.17) 3.83 (2.92, 4.75) 0.12 45-54 4.21 (2.36, 6.07) 4.68 (3.48, 5.89) 5.78 (4.39, 7.17) 4.25 (3.34, 5.17) 0.71 55-64 4.52 (2.82, 6.21) 4.61 (3.25, 5.97) 4.50 (2.95, 6.05) 4.88 (3.81, 5.95) 0.76 Women 25-34 3.14 (1.77, 4.52) 2.35 (1.30, 3.41) 2.17 (1.16, 3.18) 1.47 (0.53, 2.42) 0.05 35-44 1.78 (-0.61, 4.17) 2.52 (1.37, 3.68) 2.68 (1.58, 3.78) 2.41 (1.64, 3.19) 0.60 45-54 3.81 (2.25, 5.36) 2.25 (0.91, 3.58) 3.89 (2.78, 5.00) 2.45 (1.57, 3.33) 0.40 55-64 1.66 (-0.20, 3.53) 1.24 (-0.69, 3.18) 2.35 (0.63, 4.06) 3.32 (2.34, 4.31) 0.08 All Ages 25-64‡ men 4.77 (3.90, 5.65) 4.39 (3.77, 5.01) 4.92 (4.26, 5.58) 3.84 (3.33, 4.35) 0.16 women 2.79 (1.86, 3.72) 2.22 (1.58, 2.86) 2.68 (2.10, 3.26) 2.26 (1.81, 2.71) 0.49
p- value for GENDER DIFFERENCES all ages 25-64‡ p < 0.001 p < 0.001 p < 0.001 p < 0.001
† Estimates drawn from regression, comparing those with “no formal education” to those with a “higher than
“Baccalauréat” (secondary school diploma, usually taken at age 18 ) qualification.
Table 3. The education gradient in height using the Slope Index of Inequality.†
Age 1970 1980 1991 2003 p for
trend SII (95% CI) § SII (95% CI) § SII (95% CI) § SII (95% CI) §
Men 25-34 4.27 (2.95, 5.60) 4.44 (3.26, 5.63) 4.91 (3.55, 6.27) 3.96 (2.80, 5.12) 0.87 35-44 5.40 (4.23, 6.56) 4.57 (3.20, 5.93) 5.64 (4.45, 6.83) 4.56 (3.54, 5.58) 0.57 45-54 4.47 (3.16, 5.79) 4.88 (3.63, 6.13) 6.44 (4.98, 7.90) 4.92 (3.92, 5.92) 0.29 55-64 3.24 (1.87, 4.60) 4.41 (2.97, 5.86) 5.22 (3.75, 6.68) 5.78 (4.59, 6.97) 0.004 Women 25-34 2.34 (1.16, 3.52) 3.19 (2.12, 4.26) 2.52 (1.43, 3.62) 2.38 (1.37, 3.38) 0.82 35-44 2.79 (1.65, 3.92) 2.61 (1.36, 3.85) 3.35 (2.22, 4.49) 3.02 (2.14, 3.91) 0.54 45-54 2.18 (0.98, 3.37) 1.58 (0.39, 2.78) 4.39 (3.20, 5.59) 3.38 (2.45, 4.31) 0.009 55-64 2.15 (0.87, 3.43) 1.29 (-0.25, 2.82) 2.17 (0.88, 3.46) 3.25 (2.20, 4.30) 0.13 All Ages 25-64‡ men 4.48 (3.82, 5.14) 4.71 (4.03, 5.38) 5.58 (4.88, 6.27) 4.69 (4.14, 5.25) 0.29 women 2.41 (1.80, 3.02) 2.37 (1.73, 3.02) 3.14 (2.53, 3.76) 2.96 (2.46, 3.47) 0.06
p- value for GENDER DIFFERENCES all ages 25-64‡ p < 0.001 p < 0.001 p < 0.001 p < 0.001
† All analyses weighted to be representative of the French population.
§ SII: Slope Index of Inequality; CI: Confidence Interval ‡ Adjusted for age as a continuous variable.
Table 4. The income gradient in height using the Slope Index of Inequality.†
Age 1970 1980 1991 2003 p for
trend SII (95% CI) § SII (95% CI) § SII (95% CI) § SII (95% CI) §
Men 25-34 2.83 (1.58, 4.09) 4.12 (2.93, 5.32) 4.82 (3.44, 6.20) 2.71 (1.62, 3.80) 0.91 35-44 3.66 (2.55, 4.77) 3.39 (2.01, 4.78) 4.15 (2.96, 5.34) 3.52 (2.50, 4.54) 0.89 45-54 3.62 (2.23, 5.00) 3.22 (1.95, 4.49) 3.95 (2.53, 5.36) 3.71 (2.71, 4.71) 0.72 55-64 2.79 (1.48, 4.09) 3.91 (2.49, 5.33) 4.56 (3.13, 6.00) 3.99 (2.79, 5.19) 0.14 Women 25-34 1.89 (0.70, 3.09) 2.27 (1.23, 3.31) 3.08 (1.99, 4.17) 2.03 (1.07, 2.99) 0.62 35-44 1.40 (0.30, 2.51) 1.26 (0.07, 2.44) 2.89 (1.77, 4.02) 2.80 (1.93, 3.67) 0.01 45-54 1.62 (0.48, 2.77) 0.17 (-0.99, 1.33) 1.29 (-0.01, 2.59) 2.12 (1.22, 3.03) 0.28 55-64 1.59 (0.33, 2.84) 0.43 (-0.97, 1.83) 1.45 (0.13, 2.77) 2.85 (1.82, 3.87) 0.07 All Ages 25-64‡ men 3.26 (2.63, 3.89) 3.66 (3.00, 4.32) 4.32 (3.64, 5.00) 3.44 (2.90, 3.97) 0.38 women 1.67 (1.08, 2.26) 1.10 (0.51, 1.69) 2.27 (1.67, 2.87) 2.43 (1.96, 2.90) 0.005
p- value for GENDER DIFFERENCES all ages 25-64‡ p < 0.001 p < 0.001 p < 0.001 p < 0.005
† All analyses weighted to be representative of the French population.
§ SII: Slope Index of Inequality; CI: Confidence Interval ‡ Adjusted for age as a continuous variable.
Table 5. The income gradient in height, adjusted for education, using the Slope Index of Inequality.†
Age 1970 1980 1991 2003 p for
trend SII (95% CI) § SII (95% CI) § SII (95% CI) § SII (95% CI) §
Men 25-34 1.38 (0.02, 2.75) 2.74 (1.48, 4.00) 3.71 (2.22, 5.21) 1.28 (0.04, 2.51) 0.83 35-44 1.80 (0.55, 3.05) 1.64 (0.14, 3.14) 2.08 (0.69, 3.48) 2.03 (0.91, 3.15) 0.68 45-54 2.07 (0.58, 3.57) 1.54 (0.17, 2.92) 1.31 (-0.25, 2.86) 2.00 (0.87, 3.13) 0.88 55-64 1.50 (0.08, 2.92) 2.72 (1.12, 4.32) 2.64 (0.91, 4.37) 1.43 (0.01, 2.85) 0.93 Women 25-34 0.88 (-0.55, 2.30) 1.11 (-0.08, 2.30) 2.54 (1.22, 3.86) 1.13 (0.01, 2.24) 0.46 35-44 0.13 (-1.13, 1.38) 0.001 (-1.37,1.37) 1.56 (0.25, 2.87) 1.65 (0.64, 2.67) 0.02 45-54 0.83 (-0.47, 2.14) -0.42 (-1.72, 0.87) -1.27 (-2.84, 0.30) 0.88 (-0.10, 1.86) 0.79 55-64 0.93 (-0.44, 2.30) 0.39 (-2.08 - 1.29) 0.76 (-0.68, 2.19) 1.89 (0.76, 3.02) 0.17 All Ages 25-64‡ men 1.69 (1.00, 2.39) 2.20 (1.49, 2.91) 2.47 (1.70, 3.24) 1.79 (1.18, 2.40) 0.71 women 0.74 (0.08, 1.41) 0.12 (-0.55, 0.79) 1.08 (0.38, 1.79) 1.40 (0.87, 1.93) 0.04
p- value for GENDER DIFFERENCES all ages 25-64‡ p < 0.05 p < 0.001 p < 0.009 p = 0.34
† All analyses weighted to be representative of the French population.
§ SII: Slope Index of Inequality; CI: Confidence Interval
Table 6. Analysis restricted to those born in France.†
Age
Inequalities related to EDUCATION Inequalities related to INCOME
1991 2003 1991 2003
SII (95% CI) § SII (95% CI) § p* SII (95% CI) § SII (95% CI) § p* Men 25-34 4.58 (3.18, 5.98) 3.65 (2.42, 4.87) 0.336 4.34 (2.91, 5.76) 2.32 (1.19, 3.46) 0.03 35-44 5.28 (4.04, 6.52) 3.56 (2.49, 4.62) 0.04 3.66 (2.43, 4.89) 2.89 (1.84, 3.93) 0.35 45-54 5.54 (4.06, 7.03) 4.41 (3.35, 5.46) 0.22 3.32 (1.90, 4.74) 3.11 (2.07, 4.16) 0.82 55-64 4.68 (3.22, 6.14) 4.69 (3.41, 5.97) 0.99 4.66 (3.20, 6.12) 3.52 (2.25, 4.80) 0.25 All N = 4696 N = 7816 N = 4348 N = 7815 Women 25-34 2.28 (1.16, 3.40) 2.16 (1.10, 3.21) 0.88 3.08 (1.95, 4.22) 1.69 (0.69, 2.69) 0.07 35-44 3.51 (2.35, 4.67) 2.63 (1.67, 3.59) 0.25 3.31 (2.16, 4.46) 2.53 (1.61, 3.45) 0.30 45-54 4.06 (2.87, 5.24) 3.03 (2.04, 4.01) 0.19 0.89 (-0.44, 2.21) 1.94 (0.99, 2.88) 0.21 55-64 2.03 (0.70, 3.36) 2.62 (1.54, 3.71) 0.49 1.54 (0.18, 2.89) 2.64 (1.59, 3.70) 0.21 All N = 5067 N = 8675 N = 4700 N = 8675
† All analyses weighted to be representative of the French population.
§
Reference List
Batty, G.D., Shipley, M.J., Gunnell, D., Huxley, R., Kivimaki, M., Woodward, M., Lee, C.M. and Smith, G.D. 2009. Height, wealth, and health: an overview with new data from three longitudinal studies. Economics and Human Biology, 7: 137-152.
Billewicz, W.Z., Thomson, A.M. and Fellowes, H.M. 1983. A longitudinal study of growth in Newcastle upon Tyne adolescents. Annals of Human Biology, 10: 125-133.
Boeldieu, J. and Borrel, C. 2000. Recensement de la population 1999. La proportion d'immigrés est stable depuis 25 ans.
Bogin, B. and Loucky, J. 1997. Plasticity, political economy, and physical growth status of Guatemala Maya children living in the United States. American Journal of Physical Anthropology, 102: 17-32.
Bogin, B. and MacVean, R.B. 1983. The relationship of socioeconomic status and sex to body size, skeletal maturation, and cognitive status of Guatemala City schoolchildren. Child Development, 54: 115-128.
Bogin, B. and Rios, L. 2003. Rapid morphological change in living humans: implications for modern human origins. Comparative Biochemistry and Physiology Part A: Molecular & Integrative Physiology, 136: 71-84.
Bogin, B., Smith, P., Orden, A.B., Varela Silva, M.I. and Loucky, J. 2002. Rapid change in height and body proportions of Maya American children. American Journal of Human Biology, 14: 753-761.
Bostrom, G. and Diderichsen, F. 1997. Socioeconomic differentials in misclassification of height, weight and body mass index based on questionnaire data. International Journal of Epidemiology, 26: 860-866.
Caron, N. and Rousseau, S. 2005. Correction de la non-réponse et calage de l'enquête santé 2002. (INSEE, ed).
Cavelaars, A.E., Kunst, A.E., Geurts, J.J., Crialesi, R., Grotvedt, L., Helmert, U., Lahelma, E., Lundberg, O., Mielck, A., Rasmussen, N.K., Regidor, E., Spuhler, T. and
Mackenbach, J.P. 2000. Persistent variations in average height between countries and between socio-economic groups: an overview of 10 European countries. Annals of Human Biology, 27: 407-421.
Cline, M.G., Meredith, K.E., Boyer, J.T. and Burrows, B. 1989. Decline of height with age in adults in a general population sample: estimating maximum height and distinguishing birth cohort effects from actual loss of stature with aging. Human Biology, 61: 415-425.
Cole, T.J. 2000. Secular trends in growth. Proceedings of the Nutrition Society, 59: 317-324.
Cole, T.J. 2003. The secular trend in human physical growth: a biological view. Economics and Human Biology, 1: 161-168.
Costa-Font, J. and Gil, J. 2008. Generational effects and gender height dimorphism in contemporary Spain. Economics and Human Biology, 6: 1-18.
Dauphinot, V., Wolff, H., Naudin, F., Gueguen, R., Sermet, C., Gaspoz, J.M. and Kossovsky, M.P. 2009. New obesity body mass index threshold for self-reported data. Journal of Epidemiology and Community Health, 63: 128-132.
de Saint Pol, T. 2009. Evolution of obesity by social status in France, 1981-2003. Economics and Human Biology, 7: 398-404.
Deaton, A. and Arora, R. 2009. Life at the top: the benefits of height. Economics and Human Biology, 7: 133-136.
Ezzati, M., Martin, H., Skjold, S., Vander, H.S. and Murray, C.J. 2006. Trends in national and state-level obesity in the USA after correction for self-report bias: analysis of health surveys. Journal of the Royal Society of Medicine, 99: 250-257.
Floud, R. 1989. Measuring European Inequality, the use of height data. In Health Inequalities in Eurpean Countries. (A.J.Fox, ed). Aldershot: Gower.
Gray, J.P. and Wolfe, L.D. 1980. Height and sexual dimorphism of stature among human societies. American Journal of Physical Anthropology, 53: 441-456.
Gustafsson, A., Werdelin, L., Tullberg, B.S. and Lindenfors, P. 2007. Stature and sexual stature dimorphism in Sweden, from the 10th to the end of the 20th century. American Journal of Human Biology, 19: 861-870.
Hadden, W.C. 1996. Annotation: the use of educational attainment as an indicator of socioeconomic position. American Journal of Public Health, 86: 1525-1526.
Hallqvist, J., Lynch, J., Bartley, M., Lang, T. and Blane, D. 2004. Can we disentangle life course processes of accumulation, critical period and social mobility? An analysis of disadvantaged socio-economic positions and myocardial infarction in the Stockholm Heart Epidemiology Program. Social Science and Medicine, 58: 1555-1568.
Herpin, N. 2005. Love, careers, and heights in France, 2001. Economics and Human Biology, 3: 420-449.
Keppel, K., Pamuk, E., Lynch, J., Carter-Pokras, O., Kim, I., Mays, V., Pearcy, J.,
Schoenbach, V. and Weissman, J.S. 2005. Methodological issues in measuring health disparities. Vital Health Stat.2: 1-16.
Komlos, J., Hau, M. and Bourginat, N. 2003. An Anthropometric History of Early-Modern France. European Review of Economic History, 7: 159-189.
Komlos, J. and Kriwy, P. 2002. Social status and adult heights in the two Germanies. Annals of Human Biology, 29: 641-648.
Krieger, N., Rehkopf, D.H., Chen, J.T., Waterman, P.D., Marcelli, E. and Kennedy, M. 2008. The fall and rise of US inequities in premature mortality: 1960-2002. PLoS.Med., 5: e46.
Kuh, D.L., Power, C. and Rodgers, B. 1991. Secular trends in social class and sex differences in adult height. International Journal of Epidemiology, 20: 1001-1009.
Li, L. and Power, C. 2004. Influences on childhood height: comparing two generations in the 1958 British birth cohort. International Journal of Epidemiology, 33: 1320-1328.
Liestol, K. and Rosenberg, M. 1995. Height, weight and menarcheal age of schoolgirls in Oslo--an update. Annals of Human Biology, 22: 199-205.
Lynch, J. and Smith, G.D. 2005. A life course approach to chronic disease epidemiology. Annuual Review of Public Health, 26: 1-35.
Mackenbach, J.P. and Kunst, A.E. 1997. Measuring the magnitude of socio-economic
inequalities in health: an overview of available measures illustrated with two examples from Europe. Social Science and Medicine, 44: 757-771.
Magnusson, P.K., Rasmussen, F. and Gyllensten, U.B. 2006. Height at age 18 years is a strong predictor of attained education later in life: cohort study of over 950,000 Swedish men. International Journal of Epidemiology, 35: 658-663.
Maillard, G., Charles, M.A., Thibult, N., Forhan, A., Sermet, C., Basdevant, A. and
Eschwege, E. 1999. Trends in the prevalence of obesity in the French adult population between 1980 and 1991. International journal of obesity and related metabolic
disorders, 23: 389-394.
Marmot, M.G., Shipley, M.J. and Rose, G. 1984. Inequalities in death--specific explanations of a general pattern? Lancet, 1: 1003-1006.
McEvoy, B.P. and Visscher, P.M. 2009. Genetics of human height. Economics and Human Biology, 7: 294-306.
Meyer, H.E. and Selmer, R. 1999. Income, educational level and body height. Annals of Human Biology, 26: 219-227.
Moradi, A. 2010. Nutritional Status and Economic Development in Sub-Saharan Africa, 1950-1980. Economics and Human Biology.
Niedhammer, I., Bugel, I., Bonenfant, S., Goldberg, M. and Leclerc, A. 2000. Validity of self-reported weight and height in the French GAZEL cohort. International journal of obesity and related metabolic disorders, 24: 1111-1118.
Peck, A.M. and Vagero, D.H. 1987. Adult body height and childhood socioeconomic group in the Swedish population. Journal of Epidemiology and Community Health, 41: 333-337.
Power, C., Manor, O. and Li, L. 2002. Are inequalities in height underestimated by adult social position? Effects of changing social structure and height selection in a cohort study. BMJ, 325: 131-134.
Rona, R.J., Swan, A.V. and Altman, D.G. 1978. Social factors and height of primary schoolchildren in England and Scotland. Journal of Epidemiology and Community Health, 32: 147-154.
Silventoinen, K. 2003. Determinants of variation in adult body height. Journal of Biosocial Science, 35: 263-285.
Silventoinen, K., Lahelma, E., Lundberg, O. and Rahkonen, O. 2001. Body height, birth cohort and social background in Finland and Sweden. European Journal of Public Health, 11: 124-129.
Silventoinen, K., Sammalisto, S., Perola, M., Boomsma, D.I., Cornes, B.K., Davis, C., Dunkel, L., De Lange, M., Harris, J.R., Hjelmborg, J.V., Luciano, M., Martin, N.G., Mortensen, J., Nistico, L., Pedersen, N.L., Skytthe, A., Spector, T.D., Stazi, M.A., Willemsen, G. and Kaprio, J. 2003. Heritability of adult body height: a comparative study of twin cohorts in eight countries. Twin Research, 6: 399-408.
Singh-Manoux, A., Clarke, P. and Marmot, M. 2002. Multiple measures of socio-economic position and psychosocial health: proximal and distal measures. International Journal of Epidemiology, 31: 1192-1199.
Singh-Manoux, A., Gourmelen, J., Lajnef, M., Sabia, S., Sitta, R., Menvielle, G., Melchior, M., Nabi, H., Lanoe, J.L., Gueguen, A. and Lert, F. 2009. Prevalence of educational inequalities in obesity between 1970 and 2003 in France. Obesity Reviews, 10: 511-518.
Smith, P.K., Bogin, B., Varela-Silva, M.I. and Loucky, J. 2003. Economic and
anthropological assessments of the health of children in Maya immigrant families in the US. Economics and Human Biology, 1: 145-160.
Vagero, D. and Modin, B. 2006. Commentary: the associations between height, cognition, and education and their relevance for health studies. International Journal of Epidemiology, 35: 663-664.
Walker, M., Shaper, A.G. and Wannamethee, G. 1988. Height and social class in middle-aged British men. Journal of Epidemiology and Community Health, 42: 299-303.
Whincup, P.H., Cook, D.G. and Shaper, A.G. 1988. Social class and height. British Medical Journal, 297: 980-981.