HAL Id: hal-01881798
https://hal.archives-ouvertes.fr/hal-01881798
Submitted on 28 Sep 2018HAL is a multi-disciplinary open access archive for the deposit and dissemination of sci-entific research documents, whether they are pub-lished or not. The documents may come from teaching and research institutions in France or abroad, or from public or private research centers.
L’archive ouverte pluridisciplinaire HAL, est destinée au dépôt et à la diffusion de documents scientifiques de niveau recherche, publiés ou non, émanant des établissements d’enseignement et de recherche français ou étrangers, des laboratoires publics ou privés.
networks by randomized optimization of modularity
Gilles Didier, Alberto Valdeolivas, Anaïs Baudot
To cite this version:
Gilles Didier, Alberto Valdeolivas, Anaïs Baudot. Identifying communities from multiplex biolog-ical networks by randomized optimization of modularity. F1000Research, Faculty of 1000, 2018, �10.12688/f1000research.15486.2�. �hal-01881798�
Open Peer Review
Discuss this article
(0) Comments
METHOD ARTICLE
Identifying communities from multiplex biological networks by
randomized optimization of modularity [version 1; referees: 1
approved, 3 approved with reservations]
Gilles Didier
,
Alberto Valdeolivas
, Anaïs Baudot
1,3
Aix Marseille Univ, CNRS, Centrale Marseille, I2M, Marseille, France ProGeLife, Marseille, France
Aix Marseille Univ, Inserm, MMG, Marseille, France
Abstract
The identification of communities, or modules, is a common operation in the analysis of large biological networks. The Disease Module Identification
established a framework to evaluate clustering approaches DREAM challenge in a biomedical context, by testing the association of communities with GWAS-derived common trait and disease genes. We implemented here several extensions of the MolTi software that detects communities by optimizing multiplex (and monoplex) network modularity. In particular, MolTi now runs a randomized version of the Louvain algorithm, can consider edge and layer weights, and performs recursive clustering. On simulated networks, the randomization procedure clearly improves the detection of communities. On the DREAM challenge benchmark, the results strongly depend on the selected GWAS dataset and enrichment -valuep threshold. However, the randomization procedure, as well as the consideration of weighted edges and layers generally increases the number of trait and disease community detected. The new version of MolTi and the scripts used for the DMI DREAM challenge are available at: https://github.com/gilles-didier/MolTi-DREAM. Keywords Biological Networks, Multiplex, Multi-layer, Community identification, Clustering, DREAM challenge This article is included in the DREAM Challenges gateway. 1 1-3 1,3 1 2 3 Referee Status: Invited Referees version 1 published 10 Jul 2018 1 2 3 4
report report report report
, Pompeu Fabra Emre Guney University, Spain 1 , Tufts University, USA Lenore J. Cowen 2 , Yale University, USA Yasir Suhail 3 , Harvard Medical School, Arda Halu USA 4 10 Jul 2018, :1042 (doi: )
First published: 7 10.12688/f1000research.15486.1
10 Jul 2018, :1042 (doi: )
Latest published: 7 10.12688/f1000research.15486.1
Gilles Didier ( ), Anaïs Baudot ( )
Corresponding authors: [email protected] [email protected]
: Conceptualization, Formal Analysis, Funding Acquisition, Investigation, Methodology, Software, Visualization, Writing –
Author roles: Didier G
Original Draft Preparation, Writing – Review & Editing; Valdeolivas A: Data Curation, Formal Analysis, Investigation, Methodology, Resources, Software, Validation, Writing – Original Draft Preparation, Writing – Review & Editing; Baudot A: Conceptualization, Funding Acquisition, Investigation, Project Administration, Supervision, Visualization, Writing – Original Draft Preparation, Writing – Review & Editing No competing interests were disclosed. Competing interests: The project leading to this publication has received funding from the Centre National de la Recherche Scientifique (PEPS BMI Grant information: IMFMG), the French ``Plan Cancer 2009–2013'', and the Excellence Initiative of Aix-Marseille University - A*MIDEX, a French “Investissements d’Avenir” programme.
The funders had no role in study design, data collection and analysis, decision to publish, or preparation of the manuscript.
© 2018 Didier G . This is an open access article distributed under the terms of the , which
Copyright: et al Creative Commons Attribution Licence
permits unrestricted use, distribution, and reproduction in any medium, provided the original work is properly cited. Didier G, Valdeolivas A and Baudot A.
How to cite this article: Identifying communities from multiplex biological networks by randomized
2018, :1042 (doi:
optimization of modularity [version 1; referees: 1 approved, 3 approved with reservations] F1000Research 7
) 10.12688/f1000research.15486.1
10 Jul 2018, :1042 (doi: )
Introduction
Biological macromolecules do not act isolated in cells, but interact with each other to perform their functions, in signaling or metabolic pathways, molecular complexes, or, more generally, biological processes. Thanks to the development of experimen-tal techniques and to the extraction of knowledge accumulated in the literature, biological networks are nowadays assembled on a large-scale. A common feature of biological networks is their modularity, i.e., their organization around communities - or functional modules - of tightly connected genes/proteins implicated in the same biological processes1,2.
The Disease Module Identification (DMI) DREAM challenge aims at investigating different algorithms dedicated to the identification of communities, in a biomedical context3. The
challenge has been divided into two sub-challenges, to identify communities either i) from six biological networks independ-ently, or ii) from all these networks jointly. The clustering approaches proposed by the participants are assessed regarding their capacity to reveal disease communities, defined as commu-nities significantly associated with genes implicated in diseases in GWAS studies3,4. The challengers proposed various strategies
and clustering approaches, including kernel clustering, random walks or modularity optimization. We competed with an enhanced version of MolTi, a modularity-based software that we recently developed5. MolTi was initially developed to cluster multiplex
networks, i.e., networks composed of different layers of inter-actions. It extended the modularity measure to multiplex net-works and adapted the Louvain algorithm to optimize this multiplex-modularity. We have demonstrated that this multiplex approach better identifies the communities than approaches merging the networks, or performing consensus clusterings, both on simulated and real biological datasets5.
Grounded on these initial results, we here extended and tested our MolTi software, both on simulated data and on the DMI challenge framework. We improved MolTi with the implemen-tation of a randomization procedure, the consideration of edge and layer weights, and a recursive clustering of the classes larger than a given size.
With simulated data, we observed that considering more than one network layer improves the detection of communities, as already noted5, but also that communities are better detected
with the randomization procedure. With the DMI benchmark, we pointed to a great dependence on the GWAS dataset used for the evaluation and on the FDR threshold defined, but, overall, randomizations and edge and layer weights increase the number of detected disease communities.
Methods
MolTi-DREAM: communities from multiplex networks
We detected communities with an extended version of MolTi5,
a modularity-based software. Although MolTi was specifically designed for multiplex networks, it deals with monoplex networks by considering them as multiplexes composed of a single layer. All the networks are here considered undirected. The new version of MolTi, MolTi-DREAM, and the scripts used for
the DMI DREAM challenge are available at https://github.com/ gilles-didier/MolTi-DREAM.
Modularity. Network modularity was initially designed to measure the quality of a partition into communities6, and subsequently used
to find such communities. Since finding the partition optimizing the modularity is NP-complete, we applied the meta-heuris-tic Louvain algorithm7. Louvain starts from the community
structure that separates all vertices. Next, it tries to move each vertex from its community to another, picks the move that increases the most modularity, and iterates until no change increases the modularity anymore. It then replaces the vertices by the detected communities and performs the same operations on the newly obtained graph, until the modularity cannot be increased anymore. In order to handle multiplexes, we use a multiplex-adapted modularity and an adaptation of the Louvain algorithm for optimizing this multiplex-modularity.
Edge and layer weights Modularity approaches can deal
with weighted networks8, and we modified MolTi to handle
weighted networks. We also added the possibility to weight each layer of the multiplex network: the contribution of each layer in Equation (1) is multiplied by its weight when computing the multiplex modularity.
Multiplex modularity The modularity measure to detect
communities in a multiplex network (X(g))
g can be written as
( ) ( ) ( ) ( ) , c ,c ( ) ( ) { , } , 2 2 i j g g g i j g i j g g i j g i j k k w X m m δ ≠ −
∑
∑
(1)
where X(g) denotes the (monoplex) network of the layer g, w(g) is
the user-defined weight associated to the network g, m(g) is the
sum of the weights of all the edges of X(g), ( )
,
g i j
X is the weight of the edge {i, j} in X(g), ( )g
i
K is the sum of the weights of all the edges involving vertex i in X(g), δ
ci,cj is equal to 1 if i and j
belong to a same community and to 0 otherwise.
Randomization. We implemented a randomized version of the Louvain algorithm, similar to the one in GenLouvain9. Rather
than updating the current partition by picking the move lead-ing to the greatest increase of the modularity, we randomly pick a move among those leading to an increase of the modularity. Different runs of the randomized Louvain generally return different partitions, even if the results are often close. MolTi-DREAM runs the randomized Louvain algorithm a user- defined number of times (from one to ten in this work, four by default), and returns the partition with the highest modularity.
Simulations of Multiplex Networks with a known community structure
We simulated random multiplex networks with a fixed known community structure, namely 1,000 vertices split into 20 bal-anced communities, and various topological properties (i.e., dense/sparse/mixed, with/without missing data)5. Multiplex
structure and fixed intra/inter community edge probabilities (0.1/0.01 for sparse layers and 0.5/0.2 for dense ones). We also generated multiplex networks with missing data in which we randomly withdrawn vertices of each layer with probability 0.5. The relevance of a community structure is assessed by computing the adjusted Rand index10 between the detected
communities and the ones used to simulate the multiplex networks.
The Disease Module Identification challenge benchmark
Biological Networks. The DMI challenge provided six biological networks: two protein-protein interactions, one signaling, one co-expression, one network linking genes essential for the same cancer types, and one network connecting evolutionary-related genes. These six networks have various sizes and edge densities (Table 1). All networks have weighted edges, and all networks but the signaling network are undirected. However, we considered the signaling network as undirected.
Evaluations with GWAS data. The communities identi-fied by the different challengers were evaluated according to the associations of their member genes with GWAS data, following the PASCAL tool4. The procedure leverages the
SNP-based p-value statistics obtained from 180 GWAS datasets, covering common diseases and traits. It is to note that an important parameter is the FDR threshold used to define the significant associations3,4, and to get the number of significant
disease communities. We used three datasets: the “Leaderboard” (76 GWASs) and “Final” (104 GWASs), which were used during the challenge, and their union in a “Total” dataset (180 GWASs).
Obtaining modules in a given size range. The DMI challenge set up two constraints on the submitted communities: no overlap and a size ranging from 3 to 100 nodes. We tested different pre-filters (pruning leaves), parameters (resolution parameter, recursions, combination of graph weights for multiplexes) and post-filters (density, size, pruning leaves) in each leaderboard round. We took into account both the number of significant communities and the total number of submitted communities to evaluate the pertinence of each combination. All partitions were post-filtered to keep only classes containing from 7 to 100 nodes.
Resolution parameter Modularity-based clustering approaches
are often associated to a resolution parameter γ to tune the size of the obtained communities. We tested different values of this parameters (γ = 1, γ = 5, γ = 10, γ = 110), but the leaderboard tests showed clearly better results for the recursive approach. We chose to keep the default γ = 1 and focused on this recursive procedure.
Recursion procedure We re-clustered all the communities
above a certain size (here 100 vertices) by extracting the corre-sponding subgraphs from the networks and applying recursively the MolTi algorithm. We iterated the process until obtaining only communities with less than 100 vertices, if possible (some communities with more than 100 vertices cannot be split by considering modularity).
Results
Randomization improves community detection on simulated multiplex networks
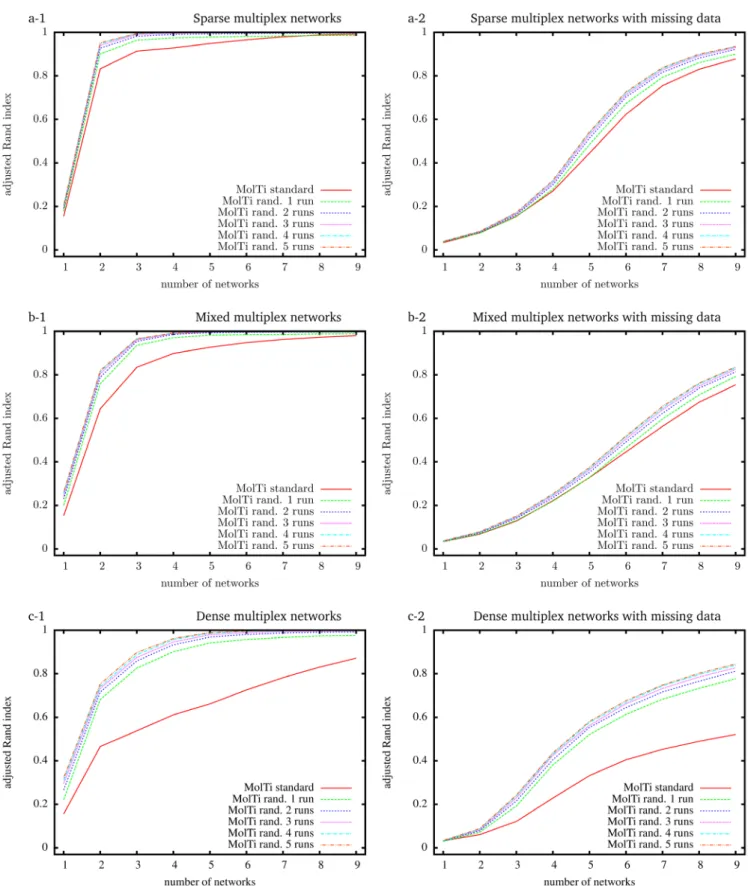
To evaluate the accuracy of the community structures detected from the initial MolTi and its improved version that includes the randomization procedure, we simulated random multiplex net-works with a fixed, known community structure, and various features5. Considering a greater number of layers always improves
the inference of communities, as already observed5 (Figure 1).
In addition, communities are better detected from sparse multi-plexes than from dense ones. We also observed that the randomi-zations improve the accuracy of the detected communities, in particular for dense multiplex networks, with or without miss-ing data. Increasmiss-ing the number of randomization runs improves the results, but to a limited extend after more than four runs.
Finding disease modules with MolTi
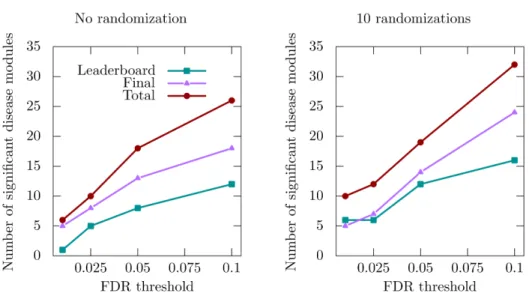
We applied the improved MolTi to the networks provided by the DMI challenge (Methods). We focused on the sub-challenge 2, which was dedicated to the identification of communities from multiple networks. We considered the six DMI biological net-works as layers of a multiplex network, and applied the recursion procedure to obtain communities in the required size range. The significant disease communities were selected regarding their enrichments in GWAS-associated genes (Methods). We observed first that the number of detected disease communities varies in a non-trivial way depending on the GWAS dataset and FDR threshold used (Figure 2). However, we can observe that the number of detected significant disease modules slightly increases after randomization, in particular when the FDR threshold is higher (Figure 2).
Multiplex versus monoplex. We next evaluated the added value of the multiplex approach as compared to the identification of modules from the individual networks. When analyzing the significant disease modules obtained for a FDR threshold of 0.1, we observed that combining biological networks in a mul-tiplex generally increases the number of significant modules (Figure 3). However, this does not stand for the cancer and/or homology networks, which lower the number of significant mod-ules retrieved when added as layers of the multiplex. We hypoth-esize that the community structures of these networks (if they exist) Table 1. Number of vertices, of
(non-zero-weighted) edges and density of the biological networks used in the DMI challenge.
Network of nodesNumber of edgesNumber Density
1-ppi 17,397 2,232,405 1.48 × 10⁻² 2-ppi 12,420 397,309 5.15 × 10⁻³ 3-signal 5,254 21,826 1.34 × 10⁻³ 4-coexpr 12,588 1,000,000 1.26 × 10⁻² 5-cancer 14,679 1,000,000 9.28 × 10⁻² 6-homology 10,405 4,223,606 7.80 × 10⁻²
Figure 1. Adjusted Rand indexes between the reference community structure used to generate the random multiplex networks, and the communities detected by standard and randomized MolTi with 1 to 5 randomization runs. Multiplex networks contain from 1 to 9 graph layers. The indexes are averaged over 2,000 random multiplex networks of 1,000 vertices and 20 balanced communities. Each layer of sparse (resp. dense) multiplex networks is simulated with 0.1/0.01 (resp. 0.5/0.2) internal/external edge probabilities. Mixed multiplex networks are simulated by uniformly sampling each layer among these two pairs of edge probabilities. Multiplex networks with missing data (right column) are generated by withdrawing vertices from each layer with probability 0.5.
Figure 2. Number of significant disease modules identified for different GWAS datasets and FDR thresholds. “Leaderboard” and “Final” datasets were used during the training and final evaluation of the challenge, respectively, whereas the “Total” dataset is the union of the two previous ones.
Figure 3. Number of significant disease modules identified for different combinations of multiplex network layers. Ten randomization have been applied, and the FDR threshold is set to 0.1.
Table 2. Number of significant disease modules detected.
FDR Unweighted Weighted
0.01 5 10
0.025 13 12
0.05 20 19
0.1 30 32
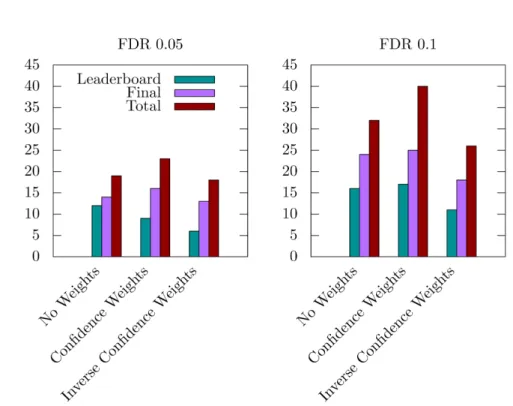
Figure 4. Number of significant disease modules identified with FDR thresholds 0.05 and 0.1, and from three different inter-layer weightings: No Weights, i.e., equal weights for all layers, Confidence Weights, i.e., weights proportional to the expected
biological relevance: 1-ppi=1, 2-ppi=1, 3-path=1, 4-coexpr=0.5, 5-cancer=0.1, 6-homology=0.1, and Inverse Confidence Weights,
i.e., weights inversely proportional to the expected biological relevance: 1-ppi=0.1, 2-ppi=0.1, 3-path=0.1, 4-coexpr=0.5, 5-cancer=1, 6-homology=1.
are so unrelated that it is pointless to seek for a common structure by integrating them.
These observations are consistent with the DMI challenge obser-vations, in which the top-scoring team in the sub-challenge 2 handled only the two protein-protein interaction networks. Our algorithm also performs well with the two protein-protein interactions networks, but the highest number of disease modules is retrieved by considering network combinations that exclude the cancer and homology network layers (Figure 3).
Evaluation of the edge and layer weighting. All the six biological networks used in the DMI challenge have weighted edges. We compared the number of disease modules obtained by considering or not these weights in the MolTi partitioning, for different FDR thresholds (Table 2). We observed that intra-layer
edge weights only has a slight effect on the number of identified significant disease modules, except for the very low significance threshold of 0.01, where it seems pertinent to use these weights. MolTi-DREAM allows assigning weights to each layer of the multiplex network, for instance to emphasize the layers known to contain more relevant biological information. Given the results of the DMI challenge and our first analyses, we decided to test a combination of weights that would lower the importance of the 5-cancer and 6-homology network layers. We observed that this led to detecting more disease modules (Figure 4). Conversely, less disease modules are detected when higher weights are given to these networks (Figure 4).
Discussion and conclusion
We applied here the MolTi software and various extensions to identify disease-associated communities following the DMI challenge benchmark. The new version of MolTi, MolTi-DREAM, runs a randomization procedure, takes into account edge and layer weights, and performs a recursive clustering of the classes that are larger than a given size. We finished tied for second in the challenge. However, even if we obtained higher scores than monoplex approaches, the difference was not significant and the organizers of the DREAM challenge declared the sub-challenge 2 vacant.
In the simulations, all the networks are randomly generated from the same community structure. These networks can thereby
be seen as different and partial views of the same underlying community structure. Combining their information in a suitable way is thereby expected to recover the original structure more accurately. In contrast, combining networks with unrelated community structures (or no structure at all) is rather likely to blur the signal carried by each network. The DMI biological networks are constructed from different biological sources that might correspond to unrelated community structures.
This may explain the results of the sub-challenge 2, in which the top-performer used only the two protein-protein interac-tion networks, and the fact that the highest number of modules retrieved by our approach was not obtained from a multiplex containing all the six networks. From a biological perspective, the protein-protein networks and the pathway networks are expected to contain mainly physical or signaling interactions between proteins. It has been shown that interacting proteins tend to be co-expressed11, which could explain why the co-expression
network also provides complementary information. In contrast, both the cancer and the homology networks are determined from processes operating at a very different level.
Evaluating the relevance of the community structure detected from real-life datasets is a very complicated problem since the actual structure is hidden and generally unknown. In this context, the only possibility for assessing the detected communities is to consider indirect evidence provided by some independent biologi-cal information. Different teams are thereby developing proxies to evaluate the communities, mainly based on testing the enrich-ment of genes contained in each community in Pathways or Gene Ontology annotations. The approach followed by the DMI DREAM challenge is based on GWAS data. This GWAS-based evaluation is specific in the sense that it considers p-value-weighted
annotations rather than usual binary ones, i.e., “annotated/not annotated”. This probably contributed to the volatility of the results observed with the DMI DREAM challenge framework.
Data and software availability
MolTi-DREAM and the scripts used for the DMI DREAM challenge: https://github.com/gilles-didier/MolTi-DREAM
Archived scripts and source code for MolTi-DREAM as at time of publication: http://doi.org/10.5281/zenodo.130120912
License for MolTi-DREAM: GNU 3
Author information
GD designed MolTi and its extensions, AB and AV applied MolTi during and after the challenge. AV and AB are currently at Aix*Marseille Univ, Inserm, MMG, France. All authors partici-pated to the design of the study, the interpretation of the results and the writing of the manuscript.
Competing interests
No competing interests were disclosed.
Grant information
The project leading to this publication has received funding from the Centre National de la Recherche Scientifique (PEPS BMI IMFMG), the French “Plan Cancer 2009–2013”, and the Excellence Initiative of Aix-Marseille University - A*MIDEX, a French “Investissements d’Avenir” programme.
The funders had no role in study design, data collection and analysis, decision to publish, or preparation of the manuscript.
References
1. Hartwell LH, Hopfield JJ, Leibler S, et al.: From molecular to modular cell biology.
Nature. 1999; 402(6761 Suppl): C47–52.
PubMed Abstract |Publisher Full Text
2. Mitra K, Carvunis AR, Ramesh SK, et al.: Integrative approaches for finding modular structure in biological networks. Nat Rev Genet. 2013; 14(10): 719–32.
PubMed Abstract |Publisher Full Text |Free Full Text
3. Choobdar S, Ahsen ME, Crawford J, et al.: Open community challenge reveals molecular network modules with key roles in diseases. bioRxiv. 2018.
Publisher Full Text
4. Lamparter D, Marbach D, Rueedi R, et al.: Fast and Rigorous Computation of Gene and Pathway Scores from SNP-Based Summary Statistics. PLoS Comput
Biol. 2016; 12(1): e1004714.
PubMed Abstract |Publisher Full Text |Free Full Text
5. Didier G, Brun C, Baudot A: Identifying Communities from Multiplex Biological Networks. PeerJ. 2015; 3: e1525.
PubMed Abstract |Publisher Full Text |Free Full Text
6. Newman ME, Girvan M: Finding and evaluating community structure in networks. Phys Rev E Stat Nonlin Soft Matter Phys. 2004; 69(2 Pt 2): 026113.
PubMed Abstract |Publisher Full Text
7. Blondel VD, Guillaume J-L, Lambiotte R, et al.: Fast unfolding of communities in
large networks. Journal of Statistical Mechanics: Theory and Experiment. 2008; 2008(10): P10008.
Publisher Full Text
8. Newman ME: Analysis of weighted networks. Phys Rev E Stat Nonlin Soft Matter
Phys. 2004; 70(5 Pt 2): 056131.
PubMed Abstract |Publisher Full Text
9. Mucha PJ, Richardson T, Macon K, et al.: Community structure in time-dependent, multiscale, and multiplex networks. Science. 2010; 328(5980):
876–8.
PubMed Abstract |Publisher Full Text
10. Santos JM, Embrechts M: On the use of the adjusted rand index as a metric for evaluating supervised classification. In C. Alippi, M. Polycarpou, C. Panayiotou,
and G. Ellinas, editors, Artificial Neural Networks – ICANN2009, 175–184, Berlin, Heidelberg, Springer Berlin Heidelberg, 2009.
Publisher Full Text
11. Rual JF, Venkatesan K, Hao T, et al.: Towards a proteome-scale map of the human protein-protein interaction network. Nature. 2005; 437(7062): 1173–1178.
PubMed Abstract |Publisher Full Text
12. Didier G: gilles-didier/MolTi-DREAM: MolTi-DREAM (Version v1.0). Zenodo. 2008.
Open Peer Review
Current Referee Status:
Version 1 17 August 2018 Referee Report doi:10.5256/f1000research.16880.r36849 Arda Halu Channing Division of Network Medicine, Department of Medicine, Brigham and Women's Hospital (BWH), Harvard Medical School, Boston, MA, USA
In their manuscript entitled “Identifying communities from multiplex biological networks by ,” Didier et al. apply a network clustering method to identify randomized optimization of modularity
communities that are significantly enriched in disease signatures. They build on their previously published community detection method, which is based on the greedy optimization (following the algorithm by Louvain et al.) of multiplex modularity. The study is submitted as part of the DMI DREAM Challenge, which aims to evaluate different clustering algorithms by how well the resulting clusters are associated with GWAS-implicated disease genes. The authors test their approach on simulated datasets as well as DMI benchmark datasets. They have three improvements on their original method: randomization, edge and layer weights, and recursive clustering for large clusters. The DMI DREAM Challenge itself is an important exercise addressing the non-trivial task of identifying biologically meaningful communities in molecular networks. This paper by Didier et al. takes on this challenge by treating the benchmark datasets as a multiplex network. While limited by the constraints of the challenge, I think the paper is an important contribution that offers an insight as to how multiplex methods fare on real-world biological networks of diverse and not necessarily related sources. The paper is well written, but it has room for improvement, especially in the concise way information is presented in the Methods and Results section. Most of my major comments relate to the clarification of details I thought to be missing from Methods and Results. In various places in the manuscript, the reader is assumed to be familiar with the DREAM Challenge and the previous paper [5] on which this paper is based. The Methods section should thus be expanded to render the study more accessible and self-contained. In some places, the results could be interpreted better. Below are my suggestions meant to help the authors improve the presentation of their study: Major comments: 1) Randomly generated synthetic networks: Even if previously published in [5], it would be helpful if this were described a little more in detail. Providing details about how the community structure is defined or what exactly balanced communities means would be helpful to the reader. 2) More information is needed for the network types, even if they’re described elsewhere under the umbrella of the DMI challenge. What were the sources for each network? Which organism are the PPI networks derived from? Are the co-expression networks tissue-specific or not? Details like these would be informative when interpreting the results of Figure 3 from a biological standpoint.
be informative when interpreting the results of Figure 3 from a biological standpoint. 3) It is important to clarify how the multiplex network was constructed out of the six networks. For it to be a multiplex network, the same set of nodes should be represented on each layer, which likely requires the pruning of the six benchmark networks. How many nodes did the final multiplex consist of? How many edges were on each layer? Is there any specific inter-layer link structure? 4) The authors use PASCAL to determine the disease-associated genes from GWAS, which are in turn used to determine the communities that are significantly enriched in disease signals. It is crucial at this point to convey to the reader very clearly what PASCAL does and how it’s translated to “significant disease modules.” The authors should, with a couple of sentences, describe how PASCAL does the SNP-to-gene mapping, and then, more importantly, how the p-value weighted gene annotations from PASCAL are used in the enrichment to determine the significant disease modules. A good description of this would facilitate the interpretations of Figure 2-4. 5) The Methods section on controlling the size of modules could be more informative. “We tested different pre-filters (pruning leaves), parameters (resolution parameter, recursions, combination of graph weights for multiplexes) and post-filters (density, size, pruning leaves) in each leaderboard round.” This sentence contains a lot of information without really getting into details. The authors could elaborate on each item. For instance, the resolution parameter does not really seem to come into play (it is even omitted from the definition of multiplex modularity since it is set to 1). Recursion was used to limit the size of the clusters, and while the authors mention tests conducted in leaderboard rounds, no data here is shown as to how varying the resolution parameter changes the results. Perhaps the authors could either omit the section about the resolution parameter altogether or provide some supplementary figures on it. 6) The 100 cutoff is set by the challenge, but in other settings, is there a way to set this ad hoc limit more concretely? Could the authors comment on this? 7) In Figure 1, the authors note that the randomizations improve the accuracy of the detected communities, in particular for dense multiplex networks. This is interesting. May that suggest that dense networks have more possibilities whereby local maxima in the modularity landscape can lead to better results than the best solution? Can the authors comment on possible reasons why this could be the case? 8) What Figure 2 tells me is that if we simply relax the association criterion (FDR cutoff), we’ll simply get more enriched communities, which is not entirely surprising. Here I think the distinction between the different GWAS datasets is important to discuss, if the authors are saying the results are sensitive to the datasets. What is it that makes the “Leaderboard” and “Final” datasets different? What are the diseases and traits included in the GWAS datasets? Perhaps the authors could comment on this. 9) Also for Figure 2 (I may be missing something obvious here) – are these results based on multiplex or monoplex? 10) “We hypothesize that the community structures of these networks (if they exist) are so unrelated that it is pointless to seek for a common structure by integrating them.” This is an interesting point that should remind us that the multiplex biological network should be constructed with a hypothesis in mind (e.g. various molecular levels from transcripts to proteins to metabolites) rather than piling up different networks into a multiplex structure. There is not much reason to think that just adding different sources of biological information should increase the performance of detecting disease modules. The tradeoff between signal and noise with the addition of diverse biological layers can be added as a point of discussion.
discussion. 11) Multiplex versus monoplex: The notion that multiplex networks help identify a greater number of significant disease modules than monoplex networks combined is an exciting prospect. However, the evidence shown in Figure 3 is a little scant. How was the comparison done exactly? Were the number of significant modules from each separate network summed up and compared to the one from multiplex? These kinds of details should be included. 12) I found the Discussion a bit too DREAM Challenge-oriented. I think the parts comparing the results with those of the top performer are unnecessary (but this may be a requirement of the challenge so ignore if that's the case). The authors should revise the discussion to recapitulate and interpret their results, and to highlight the advantages of using the multilayer approach. I think it is commendable that the authors chose to include all of the six datasets, regardless of how related they are. Even the fact that the addition of some (possibly orthogonal) layers is detrimental to the outcome is an important finding. Minor points: 1) In the definition of multiplex modularity: K^(g)_i should be lowercase, i.e. k^(g)_i. 2) Also in the definition of multiplex modularity, I would suggest the authors use s_i instead of k_i if they’re dealing with weights to denote the strength of the node rather than the degree. This is an optional point, but it would make it more aligned with the network science literature and nomenclature. Typos: - “biological networks are nowadays assembled on a large-scale.” --> on a larger scale - “picks the move that increases the most modularity” --> picks the move that increases modularity the most - “data in which we randomly withdrawn vertices” --> data in which we randomly withdraw (or just say remove) vertices - “but to a limited extend after more than four runs” --> to a limited extent - “obtained by considering or not these weights in the MolTi partitioning” --> obtained by considering and not considering these weights in the MolTi partitioning
Is the rationale for developing the new method (or application) clearly explained? Yes
Is the description of the method technically sound? Yes
Are sufficient details provided to allow replication of the method development and its use by others?
Partly
If any results are presented, are all the source data underlying the results available to ensure full reproducibility?
Yes
Are the conclusions about the method and its performance adequately supported by the findings presented in the article?
Yes
No competing interests were disclosed.
Competing Interests:
I have read this submission. I believe that I have an appropriate level of expertise to confirm that it is of an acceptable scientific standard, however I have significant reservations, as outlined above. 17 August 2018 Referee Report doi:10.5256/f1000research.16880.r36848 Yasir Suhail Department of Biomedical Engineering, Yale University, New Haven, CT, USA Overview The paper presents: 1. a couple of improvements over the method in the authors' previous 2015 paper on multiplexed modularity, and 2. the application of this improved method to the Disease Module Identification DREAM challenge. Method The paper adequately describes the incremental improvement of the general method over the previous paper regarding the following. 1. The algorithm randomly selects one of the moves improving the modularity at every stage. I assume this helps the method to arrive at different local minima for each run, thereby improving its performance on the nonlinear modularity surface. 2. The incorporation of edge and graph weights into the definition of modularity. Both of these points are well justified, and presented in adequate detail. The only minor detail that is missing is that Equation 1 does not include the resolution parameter.
Results and Performance Evaluation
The improvement in performance due to randomization is presented in Figure 1, while Figure 4 presents evidence of improvement due to the graph (layer) weights. The improvement due to edge weights is not presented, but it logically follows that any network model wherein edges with larger weights are likely to form within modules will show improved performance under a weighted definition of modularity. The authors did not have control over the DREAM challenge evaluation, but a reader might have a few questions regarding the performance evaluation. For example, if the judging criterion is the number of significantly GWAS associated modules, does the score improve by dividing one large disease associated module into two, if they both are still significant? Presentaion
Other than the missing resolution parameter, the method is adequately presented. There were a few minor issues with language. For example: 1. The second paragraph of the abstract should end with "the number of trait and disease communities detected." 2. While describing the method of simulating the missing data, another form of the word should be used instead of " ... we randomly withdrawn vertices of each layer ..."
The authors provide source code for both the latest version, and also the version that was used for the DREAM challenge. It would be helpful if the authors also provide, if those are readily available, the scripts that were used to run the DREAM and simulated data for the results presented. This will help answer minor questions regarding details like filtering etc.
Conclusion and suggestions
I think the method described by the paper is scientifically valid and its presentation is adequate, other than the minor issues raised above. Some of the important questions that may be pursued further are related to the selection of the graph weights. Currently, the weights are selected arbitrarily using the relative performance of the individual networks on predicting the disease modules. Could there be a more systematic manner of weight selection based on both the congruency with what's known of the true modules and the relative redundancy in the various layers?
Is the rationale for developing the new method (or application) clearly explained? Yes
Is the description of the method technically sound? Yes
Are sufficient details provided to allow replication of the method development and its use by others?
Partly
If any results are presented, are all the source data underlying the results available to ensure full reproducibility?
Yes
Are the conclusions about the method and its performance adequately supported by the findings presented in the article?
Yes
No competing interests were disclosed.
Competing Interests:
I have read this submission. I believe that I have an appropriate level of expertise to confirm that it is of an acceptable scientific standard.
07 August 2018 Referee Report
doi:10.5256/f1000research.16880.r35949 Lenore J. Cowen Department of Computer Science, Tufts University, Medford, MA, USA The authors explain the method that underlies their submission to the 2016 DREAM Disease Module Identification challenge. The authors only discuss their results from subchallenge 2; they should either say this is what they are going to do up front or also mention their performance on subchallenge 1. The paper is not self-contained, it already assumes some familiarity with the setup of the challenge; since this is being published in a collection on F1000 related to the dream challenge, perhaps that is appropriate, however I would have preferred if the authors had spent more time describing the challenge: i.e. what does it mean in more detail to identify communities from the six biological networks jointly, rather than independently? While the authors release their code, which is commendable, there are not sufficient details in the text to completely understand their methods without returning to the code. For example, they talk about a resolution parameter γ but this parameter is defined nowhere in their paper: is this a parameter of the GenLouvain method to which they refer? The authors present a randomized algorithm which they run from 1 to 10 times, and return the partition with highest modularity, but figure 1 uses only 1 to 5 randomization runs. Furthermore, the authors do not explain how the parameter "5" or "10" is selected. There are other method details that involve parameters that are missing, for example in their set of simulated networks, it is impossible to discover how they set their parameters from just this writeup: They write "we simulated random multiplex networks with a fixed known community structure,... and various topological properties (i.e. dense/sparse/mixed, with/without missing data)" Is this the same collection of simulated networks that they generated in a previous paper (reference 5 that they cite?) if so, please say this explicitly. Even the writeup in reference 5 is somewhat sketchy, but it's better than what is here. The authors conclude that the power of including multiplex networks is dependent perhaps on the networks being generated from partial views of the same underlying community structure; when networks 5 and 6, which were very different were included, the performance of their method degraded, and this was found across the challenge in general.
Is the rationale for developing the new method (or application) clearly explained? Yes
Is the description of the method technically sound? Yes
Are sufficient details provided to allow replication of the method development and its use by others?
No
If any results are presented, are all the source data underlying the results available to ensure full reproducibility?
Yes
Are the conclusions about the method and its performance adequately supported by the findings presented in the article?
Yes
The referee also participated on a top-scoring Dream Challenge team: since all
Competing Interests:
Dream Challenge participants will eventually be invited on the main Dream Challenge paper, the authors of this article will eventually be co-authors on a publication with the referee.
I have read this submission. I believe that I have an appropriate level of expertise to confirm that it is of an acceptable scientific standard, however I have significant reservations, as outlined above. 03 August 2018 Referee Report doi:10.5256/f1000research.16880.r36392 Emre Guney Research Programme on Biomedical Informatics, the Hospital del Mar Medical Research Institute, Pompeu Fabra University, Barcelona, Spain Didier and colleagues present MolTi-DREAM, an update to their previous software for community detection in multiplex networks and its application to the disease module discovery using synthetic and DREAM challenge data. The new version of the software adds the possibility of edge and layer weights, the randomization of the underlying Louvain algorithm and partitioning of large modules into smaller modules based on user defined parameters. Based on their analysis of simulated and biological interaction data, they reaffirm that using multiple layers of networks and randomized repetition of module discovery could improve the accuracy. Overall the article is clearly written and the technical details are clearly explained with several exceptions I mention below: 1. The multiplex modularity formula lacks the resolution parameter (which should appear before ki kj / 2m in the summation). The authors are encouraged to provide data / figures with respect to the reasoning on the selection of the default resolution parameter (currently they mention verbally that it showed better results on leaderboard). 2. Randomization procedure is unclear. I believe the cost function used is the multiplex modularity given in Eq 1 (L) but the “move” leading to an increase of the modularity is not formally stated (sth like i, j: random_pick(argmax ci, cj L)). The choice of 4 by default is also somewhat arbitrary given that the difference between 3,4,5 are all very small. The significance of the difference in Rand index across runs in Figure 1 could be used to decide the number after which the change is not significant. 3. The simulation of the multiplex networks could be explained better. Potentially owing to the previous publication, there is no detail in regards to which model was used to generate these networks. A brief description of SBMs and the underlying assumptions of the model it relies on would help. Are these simulated networks are more ER-like? Could this be the reason why the simulated results do not reflect the results on the real networks? Also, it would certainly be useful to add the standard deviation across 2000 networks in Figure 1. I had difficulties following how exactly the mixed and noisy networks are generated (did the mixed ones still have 1000 vertices, 500 from sparse and 500 from dense, for the missing data if the vertices were drawn half of the time, did they have 500 vertices?).
4. The coverage / precision of disease module discovery is missing. What is the number of all modules identified by the algorithm, how many disease modules are there (or could there be) in total? The latter question could be tricky to answer but I believe a lower and upper bound could be provided (e.g., number of diseases and a number based on the GWAS hits for that disease divided by the min module size). 5. “combining biological networks in a multiplex generally increases the number of significant modules”. The Figure 3 does not exactly reflect this, it seems the number of significant modules for multiplex(ppi1, ppi2) < monoplex(ppi1) + monoplex(ppi2). Maybe the authors could show the numbers for the union of the modules identified using ppi1and ppi2 and put that into the figure as to what to expect when the modules are combined using these networks separately. 6. The choice of the for each biological network seems rather arbitrary. Could these weights be optimized (i.e. using leaderboard data) and their effect be tested on final data? 7. “the community structure of these networks (if they exist) are so unrelated that it is pointless to seek for a common structure by integrating them” I feel that this statement should be supported by further evidence. Could the authors provide some measures in regards to the modularity of each of these networks and the overlap of nodes / edges between them. This would also help to justify the argument on the “DMI biological networks are constructed from different biological sources that might correspond to unrelated community structures”. Minor: Explain what monoplex network means at its first occurrence for readers not familiar with terminology. “hande mulxtiplexes” multiplex networks “following the PASCAL tool” identified using “Considering a greater number of layers...” lacks the main clause / verb “after more than four runs” upto four runs / repetitions “varies in a non-trivial way” non-trivial?
Is the rationale for developing the new method (or application) clearly explained? Yes
Is the description of the method technically sound? Yes
Are sufficient details provided to allow replication of the method development and its use by others?
Yes
If any results are presented, are all the source data underlying the results available to ensure full reproducibility?
Yes
Are the conclusions about the method and its performance adequately supported by the findings presented in the article?
Partly
No competing interests were disclosed.
Competing Interests:
I have read this submission. I believe that I have an appropriate level of expertise to confirm that it is of an acceptable scientific standard, however I have significant reservations, as outlined above. The benefits of publishing with F1000Research: Your article is published within days, with no editorial bias You can publish traditional articles, null/negative results, case reports, data notes and more The peer review process is transparent and collaborative Your article is indexed in PubMed after passing peer review Dedicated customer support at every stage For pre-submission enquiries, contact [email protected]