HAL Id: hal-01787913
https://hal.archives-ouvertes.fr/hal-01787913
Submitted on 7 May 2018
HAL is a multi-disciplinary open access
archive for the deposit and dissemination of
sci-entific research documents, whether they are
pub-lished or not. The documents may come from
teaching and research institutions in France or
abroad, or from public or private research centers.
L’archive ouverte pluridisciplinaire HAL, est
destinée au dépôt et à la diffusion de documents
scientifiques de niveau recherche, publiés ou non,
émanant des établissements d’enseignement et de
recherche français ou étrangers, des laboratoires
publics ou privés.
A reverse signaling pathway downstream of Sema4A
controls cell migration via Scrib
Tianliang Sun, Lida Yang, Harmandeep Kaur, Jenny Pestel, Mario Looso,
Hendrik Nolte, Cornelius Krasel, Daniel Heil, Ramesh Krishnan, Marie-Josée
Santoni, et al.
To cite this version:
Tianliang Sun, Lida Yang, Harmandeep Kaur, Jenny Pestel, Mario Looso, et al.. A reverse signaling
pathway downstream of Sema4A controls cell migration via Scrib. Journal of Cell Biology, Rockefeller
University Press, 2017, 216 (1), pp.199 - 215. �10.1083/jcb.201602002�. �hal-01787913�
JCB:
Article
The Rockefeller University Press $30.00
Introduction
Semaphorins are a large family of secreted, transmembrane,
or glycosylphosphatidylinositol-linked proteins defined by a
semaphorin domain (Kolodkin et al., 1993; Luo et al., 1993).
They exert most of their effects through a family of
trans-membrane receptors, called plexins (Winberg et al., 1998;
Tamagnone et al., 1999). Semaphorins and plexins have
been shown to play crucial roles in a multitude of biological
contexts, including the nervous, immune, bone, and
cardio-vascular systems, as well as in cancer (Takamatsu and
Kuma-nogoh, 2012; Gu and Giraudo, 2013; Messina and Giacobini,
2013; Worzfeld and Offermanns, 2014). In various cell types,
semaphorin–plexin signaling regulates key cellular functions,
particularly cytoskeletal dynamics and cell migration (Kruger
et al., 2005; Casazza et al., 2007).
On the basis of phylogenetic tree analysis and the
pres-ence of additional protein motifs, mammalian semaphorins
are grouped into five classes. Class 3 semaphorins are secreted
molecules, the class 7 semaphorin, semaphorin 7A (Sema7A),
is glycosylphosphatidylinositol linked to the membrane, and
semaphorins of classes 4, 5, and 6 represent transmembrane
proteins (Worzfeld and Offermanns, 2014). The extracellular
portion of class 4 semaphorins can be proteolytically cleaved,
allowing them to also act as soluble ligands (Wang et al., 2001;
Hemming et al., 2009; Fong et al., 2011; Armendáriz et al.,
2012; Nakatsuji et al., 2012). Importantly, all class 4
sema-phorins possess short (between 57 and 149 amino acids)
cyto-plasmic domains, which, in the case of Sema4B, 4C, 4F, and 4G,
have been shown to interact with intracellular proteins,
includ-ing PSD-95 (Inagaki et al., 2001; Burkhardt et al., 2005), SEM
CAP-1 and -2 (GIPC1/2; Wang et al., 1999), Norbin (Ohoka
et al., 2001), and CLCP1 (Nagai et al., 2007). Plexins, in turn,
Semaphorins comprise a large family of ligands that regulate key cellular functions through their receptors, plexins. In
this study, we show that the transmembrane semaphorin 4A (Sema4A) can also function as a receptor, rather than a
ligand, and transduce signals triggered by the binding of Plexin-B1 through reverse signaling. Functionally, reverse
Sema4A signaling regulates the migration of various cancer cells as well as dendritic cells. By combining mass
spectrom-etry analysis with small interfering RNA screening, we identify the polarity protein Scrib as a downstream effector of
Sema4A. We further show that binding of Plexin-B1 to Sema4A promotes the interaction of Sema4A with Scrib, thereby
removing Scrib from its complex with the Rac/Cdc42 exchange factor
βPIX and decreasing the activity of the small
guanosine triphosphatase Rac1 and Cdc42. Our data unravel a role for Plexin-B1 as a ligand and Sema4A as a
recep-tor and characterize a reverse signaling pathway downstream of Sema4A, which controls cell migration.
A reverse signaling pathway downstream of
Sema4A controls cell migration via Scrib
Tianliang Sun,
1Lida Yang,
1Harmandeep Kaur,
1Jenny Pestel,
1Mario Looso,
1Hendrik Nolte,
1Cornelius Krasel,
2Daniel Heil,
1Ramesh K. Krishnan,
1Marie-Josée Santoni,
4,5,6,7Jean-Paul Borg,
4,5,6,7Moritz Bünemann,
2Stefan Offermanns,
1,8Jakub M. Swiercz,
1* and Thomas Worzfeld
1,3*
1Max Planck Institute for Heart and Lung Research, 61231 Bad Nauheim, Germany
2Institute of Pharmacology and Clinical Pharmacy and 3Institute of Pharmacology, Biochemical-Pharmacological Center, University of Marburg, 35043 Marburg, Germany 4Cell Polarity, Cell Signaling and Cancer, Equipe labellisée Ligue Contre le Cancer, Institut National de la Santé et de la Recherche Médicale, U1068, 13009
Marseille, France
5Institut Paoli-Calmettes, 13009 Marseille, France 6Aix-Marseille Université, 13284 Marseille, France
7Centre National de la Recherche Scientifique, UMR7258, 13273 Marseille, France 8Medical Faculty, University of Frankfurt, 60590 Frankfurt am Main, Germany
*J.M. Swiercz and T. Worzfeld contributed equally to this paper.
Correspondence to Tianliang Sun: [email protected]; or Thomas Worzfeld: [email protected]
H. Nolte’s present address is Institute for Genetics and Cologne Excellence Clus-ter on Cellular Stress Responses in Aging-Associated Diseases, University of Cologne, 50931 Cologne, Germany.
R.K. Krishnan’s present address is Dept. of Internal Medicine, Excellence Cluster in Cardio-Pulmonary Systems, University of Giessen and Marburg Lung Center, 35392 Giessen, Germany.
Abbreviations used: BMDC, bone marrow–derived DC; DC, dendritic cell; FRET, Förster resonance energy transfer; GEF, guanine nucleotide exchange factor; GM-CSF, granulocyte–macrophage colony-stimulating factor; HMV EC, human microvascular endothelial cell; PE, phycoerythrin; RIPA, radioimmunoprecipita-tion assay.
© 2017 Sun et al. This article is distributed under the terms of an Attribution–Noncommercial– Share Alike–No Mirror Sites license for the first six months after the publication date (see http ://www .rupress .org /terms /). After six months it is available under a Creative Commons License (Attribution–Noncommercial–Share Alike 4.0 International license, as described at https ://creativecommons .org /licenses /by -nc -sa /4 .0 /).
THE
JOURNAL
OF
CELL
BIOLOGY
on May 7, 2018 jcb.rupress.org Downloaded from http://doi.org/10.1083/jcb.201602002are classified into four subfamiles, A–D, according to structural
characteristics (Tamagnone et al., 1999).
Although it is well established that the binding of
sema-phorins to plexins triggers several plexin-mediated signaling
pathways (Hota and Buck, 2012; Jongbloets and Pasterkamp,
2014), it remains largely unclear whether transmembrane
sema-phorins can also serve as receptors, rather than ligands, and
signal in a reverse manner (Gurrapu and Tamagnone, 2016).
Several studies in the developing nervous system of Drosophila
melanogaster
provide evidence that Sema1a, a transmembrane
semaphorin found in invertebrates, transduces signals evoked
by binding of plexins, which depend on the intracellular domain
of Sema1a (Godenschwege et al., 2002; Cafferty et al., 2006;
Komiyama et al., 2007; Yu et al., 2010). In vertebrates, a
recep-tor function has been assigned to Sema6B, which controls axon
guidance in the developing chick nervous system (Andermatt
et al., 2014). Moreover, it has been suggested that murine
Plex-in-B2 regulates epidermal
γδ T cell functions through Sema4D
(Witherden et al., 2012). However, the underlying molecular
mechanisms remain elusive.
In this study, we show that Sema4A serves as a receptor
for Plexin-B1 and mediates Plexin-B1–induced reverse
signal-ing. Mechanistically, we uncover Scrib as a critical mediator
of Sema4A downstream signaling in cancer and dendritic cells
(DCs). Sema4A interacts with Scrib in a Plexin-B1–dependent
manner, resulting in decreased membrane localization of Scrib
and a loss of the interaction between Scrib and the guanine
nu-cleotide exchange factor
βPIX, thus negatively regulating the
activity of the small GTPases Cdc42 and Rac1. Furthermore,
we provide evidence that this Sema4A–Scrib–
βPIX signaling
pathway is critical to promote Plexin-B1–induced migration and
invasion of various cancer cells as well as the migration of DCs.
Results
Plexin-B1 induces migration and invasion of cancer cells via Sema4A reverse signaling
Class 4 semaphorins and B-family plexins have been linked to
the regulation of the cytoskeleton and cell migration (Driessens
et al., 2001; Swiercz et al., 2008). To test whether class 4
sema-phorins can act as receptors, rather than ligands, in the context
of cancer cell migration, we purified an extracellular portion of
Plexin-B1 containing semaphorins and a
plexin-semaphorin-in-tegrin (PSI) domain (ecPlxnB1). In accordance with published
data, ecPlxnB1 contained all structural elements required for
the binding to the class 4 semaphorin, Sema4D (Fig 1 a; Janssen
et al., 2010). In a panel of cancer cell lines of different origin,
comprising pancreatic (MIA PaCa-2, AsPc, T3M4, and CFP
AC), skin (A431), brain (SHSY-5Y), cervical (HeLa), breast
(MDA-MB-231), and lung (Calu-3) cancer cell lines, we
ob-served that ecPlxnB1 increased the migratory behavior of some,
but not all, cancer cell lines (Figs. 1 b and S1 a). We
hypothe-sized that this was caused by a class 4 semaphorin, which acts
as an ecPlxnB1 receptor and is present on responsive cell lines
but absent from unresponsive cell lines. We therefore
system-atically analyzed the expression of class 4 semaphorins in the
cancer cell lines and found that only Sema4A fulfilled these
criteria (Figs. 1 c and S1 b). Of note, Sema4A has been shown
to bind to Plexin-B1 (Yukawa et al., 2010). To test whether the
ecPlxnB1-induced effects on cancer cell migration are
medi-ated by Sema4A, we silenced Sema4A expression by siRNA
in ecPlxnB1-responsive cell lines (Fig. S1, c and d). Indeed,
knockdown of Sema4A, but not of other class 4 semaphorins,
suppressed ecPlxnB1-induced migratory behavior (Fig. 1 d). To
test whether the intracellular portion of Sema4A is required to
transduce signals triggered by the binding of ecPlxnB1 to
Se-ma4A, we silenced endogenous Sema4A by siRNA, followed
by overexpression of siRNA-resistant wild-type Sema4A or of
siRNA-resistant mutant Sema4A lacking the intracellular
por-tion (Sema4A
ΔC). Both wild-type and mutant Sema4A were
expressed at comparable levels (Fig. S1 e), reached the plasma
membrane, and bound ecPlxnB1 in a similar manner (Fig. S1,
f and g). Whereas expression of wild-type Sema4A rendered
cells fully responsive to the promigratory effects of ecPlxnB1,
expression of Sema4A
ΔC did not (Figs. 1 e and S1 h).
More-over, we engineered MIA PaCa-2 cells to stably express shRNA
directed against endogenous Sema4A as well as cDNAs
en-coding shRNA-resistant versions of either wild-type or mutant
Sema4A (Sema4A
ΔC; Fig. S1 i). Although cells expressing
wild-type Sema4A showed an increase in invasive behavior
in response to ecPlxnB1, cells expressing Sema4A
ΔC lacked
the proinvasive response to ecPlxnB1 (Fig. 1 f). Of note, cells
expressing wild-type or mutant Sema4A (Sema4A
ΔC) showed
similar rates of proliferation (Fig. S1 j). Moreover, we observed
that AsPc cells, which do not express endogenous Sema4A and
do not normally respond to ecPlxnB1, become migratory in
re-sponse to ecPlxnB1 upon expression of wild-type Sema4A, but
not of the Sema4A
ΔC mutant (Fig. S1 k). Collectively, these
data indicate that Sema4A can act as a receptor for Plexin-B1
and signals through its intracellular portion to promote cancer
cell migration and invasion.
Sema4A reverse signaling in DCs induces directional migration toward Plexin-B1
To test for a wider biological significance of Plexin-B1–
Sema4A reverse signaling, we extended our analyses to another
biological system. Because Sema4A was reported to be highly
expressed by bone marrow–derived DCs (BMDCs) and splenic
DCs (Kumanogoh et al., 2002), we tested whether Sema4A
could serve as a receptor for Plexin-B1 also on these cells.
In-deed, we observed that primary BMDCs exhibited chemotaxis
toward ecPlxnB1 (Fig. 2 a). Similarly, ecPlxnB1 also attracted
primary splenic DCs (Fig. S2 a) in transwell migration and 3D
chemotaxis assays (Figs. 2 b and S2 b). To examine whether
these ecPlxnB1-induced effects on DC migration are mediated
by Sema4A reverse signaling, we used Sema4A-deficient mice
(Figs. 2 d and S2 c; Xia et al., 2015) from which we isolated
BMDCs. Indeed, we found that BMDCs lacking Sema4A
showed no directed migration toward ecPlxnB1 (Fig. 2 c).
This was not caused by a general defect in cell motility, as
Se-ma4A-deficient BMDCs reacted normally to the promigratory
chemokine CCL19 (Fig. 2 c) and exhibited similar motility as
wild-type BMDCs (Fig. S2 e). Reexpression of wild-type
Se-ma4A, but not of Sema4A
ΔC, rescued the ability of DCs to
re-spond to ecPlxnB1 (Fig. 2 d). These results show that Sema4A
serves as a receptor for Plexin-B1 on DCs to promote
chemo-taxis via reverse signaling.
The migration of DCs toward lymphatic vessels requires Sema4A and Plexin-B1
To assess the physiological relevance of Sema4A reverse
signal-ing in DCs, we analyzed the migratory behavior of DCs toward
lymphatic vessels of explanted ear sheets of mice. Compared
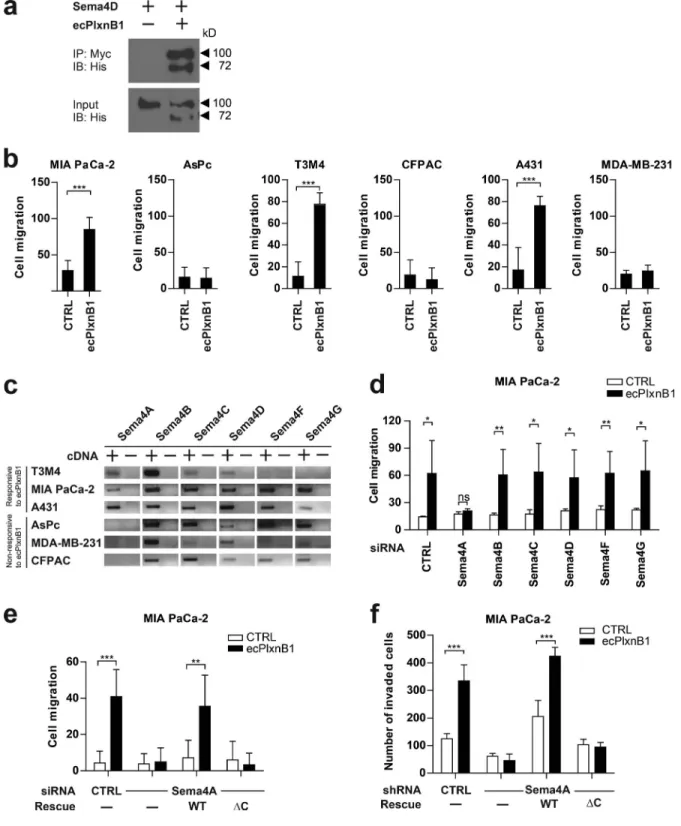
Figure 1. Plexin-B1 promotes cancer cell migration and invasion through its receptor Sema4A. (a) A purified His-Myc–tagged extracellular portion of Plex-in-B1 (ecPlxnB1; amino acids 20–534 of human PlexPlex-in-B1) and His-tagged Sema4D were mixed in equimolar concentrations and incubated in the presence of anti-Myc antibodies. Protein complexes were then precipitated using protein A/G agarose. Proteins were immunoblotted and visualized using an anti-His antibody. IB, immunoblotting; IP, immunoprecipitation. (b) MIA PaCa-2, AsPc, T3M4, CFP AC, A431, or MDA-MB-231 cells were seeded onto 96-transwell migration plates in the absence or presence of 150 nM ecPlxnB1, and cell migration was analyzed as described in Materials and methods. Shown are mean values ± SD from duplicates of three independent experiments (total n = 6 per condition). CTRL, control. (c) Expression analysis of class 4 semaphorins in cancer cell lines by RT-PCR. (d) MIA PaCa-2 cells were transfected with control or siRNA directed against Sema4A, B, C, D, F, or G (as indicated). Cell migration in the absence or presence of 150 nM ecPlxnB1 was tested using a transwell system as described in Materials and methods. Shown are mean values ± SD of three independent experiments (total n = 5 per condition). ns, not significant. (e) MIA PaCa-2 cells were transfected with control or Sema4A siRNA. After 48 h, cells were transfected with cDNA encoding siRNA-resistant wild-type or mutant Sema4A lacking the intracellular part. Cell migration was tested using a transwell system. Shown are mean values ± SD from duplicates of three independent experiments (total n = 6 per condition). (f) MIA PaCa-2 cells were stably transfected with either control shRNA or shRNA against Sema4A. Where indicated, cells were additionally transfected with cDNA encoding shRNA-resistant wild-type Sema4A (WT) or shRNA-resistant Sema4A lacking its intracellular portion (∆C). Cells were seeded onto Matrigel-coated filters (total n = 6 per condition). Invaded cells were stained and counted. Error bars represent means ± SD. *, P < 0.05; **, P < 0.01; ***, P < 0.001.
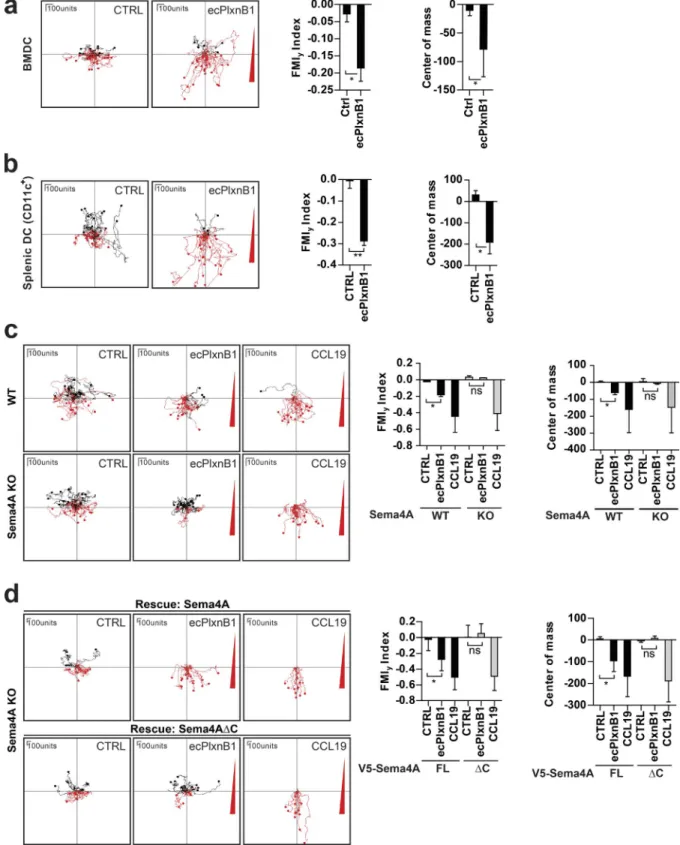
Figure 2. Plexin-B1–Sema4A reverse signaling regulates DC migration in vitro. (a–d) The migratory behavior of mature BMDCs (a, c, and d) or splenic DCs (b) exposed to control buffer (CTRL), to a gradient of ecPlxnB1, or to a gradient of CCL19 was analyzed as described in Materials and methods. Gra-dients are indicated by a red triangle at the right side of the depicted plots. Each line represents a track of an individual cell. Cell tracks with an endpoint in the top half of the plot (i.e., on the side of the lower agonist concentration) are labeled in black, and cell tracks with an endpoint in the bottom half of the plot (i.e., on the side of the higher agonist concentration) are labeled in red. (c) Mature BMDCs generated from wild-type (WT) or Sema4A knockout (KO) mice were examined. ns, not significant. (d) BMDCs isolated from Sema4A knockout mice were infected with lentiviruses carrying full-length wild-type Sema4A (V5-Sema4A FL) or Sema4A lacking the intracellular part (V5-Sema4AΔC). After maturation, cell migration was analyzed. FMIy, y-forward migration index. Total numbers of analyzed cells are CTRL, n = 57 and ecPlxnB1, n = 51 (a); CTRL, n = 32 and ecPlxnB1, n = 60 (b); WT/CTRL, n = 47; WT/ecPlxnB1, n = 38; WT/CCL19, n = 43; KO/CTRL, n = 36; KO/ecPlxnB1, n = 30; and KO/CCL19, n = 40 (c); and FL/CTRL, n = 26; FL/ecPlxnB1, n = 34; FL/CCL19, n = 25; ΔC/CTRL, n = 26; ΔC/ecPlxnB1, n = 33; and ΔC/CCL19, n = 31 (d). Error bars represent means ± SD. *, P < 0.05; **, P < 0.01.
with wild-type BMDCs, Sema4A-deficient BMDCs were
im-paired in their ability to migrate toward ear lymphatic vessels
(Figs. 3 a and S3 a). Given that lymphatic endothelial cells play
an important role in guiding DCs to lymphatic vessels (Heuzé et
al., 2013; Platt and Randolph, 2013), they seemed to be a likely
source of Plexin-B1 to attract DCs via activation of Sema4A
re-verse signaling. Indeed, Plexin-B1 is not only expressed in
arte-rial cells and human microvascular endothelial cells (HMV ECs;
Basile et al., 2005; Giusti et al., 2006), but also in lymphatic
endothelial cells (Fig. S3 b; Nelson et al., 2007). Moreover, an
extracellular portion of Plexin-B1 of
∼70 kD in size is released
from lymphatic endothelial cells (HMV EC-dLyAd; Fig. S3, c
and d). Fully consistent with a role of Plexin-B1 as a ligand
for Sema4A on DCs, BMDCs were impaired in their ability to
migrate toward ear lymphatic vessels of Plexin-B1–deficient
mice (Fig. 3 b). The knockout of Plexin-B1 in ear lymphatic
vessels led to a slightly stronger impairment of BMDC
migra-tion than the knockout of Sema4A in BMDCs (Fig. 3, a and b).
Therefore, although Sema4A accounted for a large fraction of
the Plexin-B1–induced promigratory effect on BMDCs, other
transmembrane semaphorins could serve as additional
recep-tors for Plexin-B1 on BMDCs. Indeed, Sema4D is coexpressed
with Sema4A in BMDCs (Fig. S3, e and f). To examine the
role of Sema4A reverse signaling in BMDC migration in more
detail, we used a live-cell imaging approach (Video 1). This
analysis showed that the migration speed and distance of
Se-ma4A-deficient BMDCs were lower than of wild-type BMDCs
(Fig. 3, c–e). However, these differences were rather subtle and
therefore unlikely to fully explain the observed impairment of
Sema4A-deficient BMDCs to migrate toward lymphatic
ves-sels. Against the background of our in vitro experiments, which
had shown a defective chemotactic behavior of
Sema4A-defi-cient BMDCs toward a Plexin-B1 gradient, we hypothesized
that Sema4A-deficient BMDCs might display an altered
di-rectionality of migration toward Plexin-B1–expressing
lym-phatic vessels. For individual cells, we therefore determined the
angle between the shortest possible distance to the lymphatic
vessel and the observed actual vector of migration (Fig. 3 f).
Indeed, we found that Sema4A-deficient BMDCs migrated at
higher angles (i.e., less directly toward lymphatic vessels) than
wild-type BMDCs (Fig. 3 f).
Identification of downstream effectors of Sema4A
Our data show that the intracellular portion of Sema4A is
crucial to mediate reverse signaling. To further elucidate the
signaling pathway downstream of activated Sema4A, our
goal was to identify proteins that interact with its
intracellu-lar portion. We therefore expressed the recombinant
intracel-lular portion of Sema4A, incubated it with lysates of various
cell lines (MIA PaCa-2, SK-OV-3, HEK293T, and CaD2), and,
after precipitation, identified binding partners by mass
spec-trometry (Fig. 4 a). An analogous approach was taken for all
other class 4 semaphorins (not depicted). As
Plexin-B1–Se-ma4A reverse signaling promotes cell migration, we reasoned
that the functional relevance of Sema4A-interacting proteins
could be assessed by testing their involvement in this
promigra-tory effect. We therefore silenced the expression of individual
candidates by siRNA in MIA PaCa-2 cells and tested for the
impact on ecPlxnB1-induced cell migration. The knockdown
of several Sema4A-interacting proteins severely impaired the
ability of cells to respond to ecPlxnB1, with the knockdown of
Scrib having the strongest effect (Fig. 4 b). The critical role of
Scrib in ecPlxnB1-induced cell migration was confirmed with
an independent siRNA in both MIA PaCa-2 cells (Fig. S4, a
and b) and in T3M4 cells (Fig. S4, c and d). To verify the
in-teraction between Scrib and Sema4A, we performed
coimmu-noprecipitation experiments in HEK293T cells. Although we
could not detect an interaction of the intracellular portion of
Sema4A with Scrib in the absence of ecPlxnB1, we observed
binding in the presence of ecPlxnB1 (Fig. 4 c). These results
were confirmed in MIA PaCa-2, T3M4, and CaD2 cells, which
express endogenous Scrib (Fig. 4 d). Furthermore, in primary
BMDCs, application of ecPlxnB1 resulted in the formation of
a Sema4A–Scrib complex (Fig. 4 e). In addition to Scrib, our
GST-pulldown approach (Fig. 4 a) had identified seven other
potential Sema4A-interacting proteins, the siRNA-mediated
knockdown of four of which showed an inhibition of the
ecPlx-nB1-induced promigratory effect (Fig. 4 b). However, in
coim-munoprecipitation experiments in the absence and presence of
ecPlxnB1, we could not detect an interaction between Sema4A
and these proteins (encoded by the snx27, tln1, prkd2, or ran
genes; not depicted). To map the interaction sites between
Scrib and Sema4A, we cloned several deletion mutants of Scrib
(Fig. 4 f) and tested for their ability to interact with the
intra-cellular portion of Sema4A in HEK293T cells. This analysis
showed that Scrib binds to the intracellular portion of Sema4A
via its C-terminal part (amino acids 1224 and 1630), a region to
which no functions have been assigned so far (Fig. 4 g).
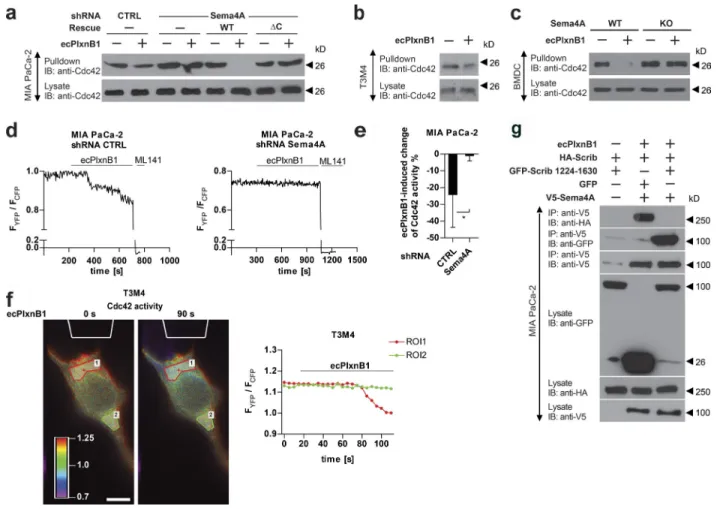
Sema4A reverse signaling regulates the activity of small GTPases
Scrib has been shown to control the activity of the small
GTPases Rac1 and Cdc42, which are crucially involved in the
regulation of cell migration (Audebert et al., 2004; Osmani
et al., 2006; Momboisse et al., 2009; Spiering and Hodgson,
2011). We therefore tested whether Plexin-B1 regulates Cdc42
and/or Rac1 activity through Sema4A and Scrib. We found that
application of ecPlxnB1 to MIA PaCa-2 or T3M4 cells resulted
in a reduction of Cdc42 and Rac1 activity (Fig. 5, a and b; and
Fig. S5, a–c). Furthermore, exposure to ecPlxnB1 also lowered
the activity of Cdc42 in BMDCs (Fig. 5 c). The inhibition of
Cdc42 and Rac1 activity by ecPlxnB1 was dependent on
Se-ma4A, as shRNA-mediated knockdown of Sema4A in MIA
PaCa-2 cells (Figs. 5 a and S5, a and b) or knockout of Sema4A
in BMDCs (Fig. 5 c) rendered cells unresponsive to ecPlxnB1.
The loss of the ecPlxnB1-induced effect on Cdc42 and Rac1
activity in MIA PaCa-2 cells with shRNA-mediated
knock-down of Sema4A could be fully rescued by overexpression of
shRNA-resistant wild-type Sema4A, but not overexpression of
Sema4A
ΔC (Figs. 5 a and S5, a and b). Of note, the effect of
ecPlxnB1 on the activity of small GTPases was restricted to
Cdc42 and Rac1, as activities of the closely related small
GT-Pases RhoA, RhoB, or RhoC were not influenced (Fig. S5, d–f).
To gain further insight into the ecPlxnB1-induced
Sema4A-me-diated modulation of Cdc42 and Rac1 activity, we tried to
visualize Cdc42 and Rac1 activity with spatial and temporal
resolution. Along these lines, we used Förster resonance energy
transfer (FRET) assays using Cdc42 and Rac1 biosensors
(Mar-tin et al., 2016) in different experimental setups. In a first series
of measurements, we applied ecPlxnB1 to the medium so that
the plasma membrane of each analyzed cell got uniformly
ex-posed to ecPlxnB1. In full accordance with the pulldown assays,
this led to a reduction of Cdc42 and Rac1 activity in a Sema4A-
dependent manner (Fig. 5, d and e; and Fig. S5 g). However, in
our in vitro and ex vivo migration assays, and likely also under
physiological conditions in vivo, the concentration of Plexin-B1
is not uniform around the cell, but rather it forms a gradient.
In an attempt to mimic a physiologically relevant situation, we
therefore exposed cells to a polarized ecPlxnB1 stimulus. We
observed that Cdc42 activity decreased at the site of ecPlxnB1
application (Fig. 5 f), indicating that a gradient of ecPlxnB1
translates into polarized modulation of Cdc42 activity. To test
whether ecPlxnB1 regulates Cdc42 and Rac1 activity through
Sema4A/Scrib, we aimed at specifically interfering with the
Se-ma4A–Scrib interaction. We hypothesized that overexpression
of the C-terminal portion of Scrib (amino acids 1224–1630),
which interacts with Sema4A (see Identification of downstream
effectors of Sema4A), could compete for the interaction of
wild-type Scrib with Sema4A, thereby acting as a dominant-negative
form. Indeed, we found that overexpression of the C-terminal
portion of Scrib decreased the ecPlxnB1-induced interaction of
Sema4A and Scrib and blocked ecPlxnB1-induced Rac1
deacti-vation (Figs. 5 g and S5 h).
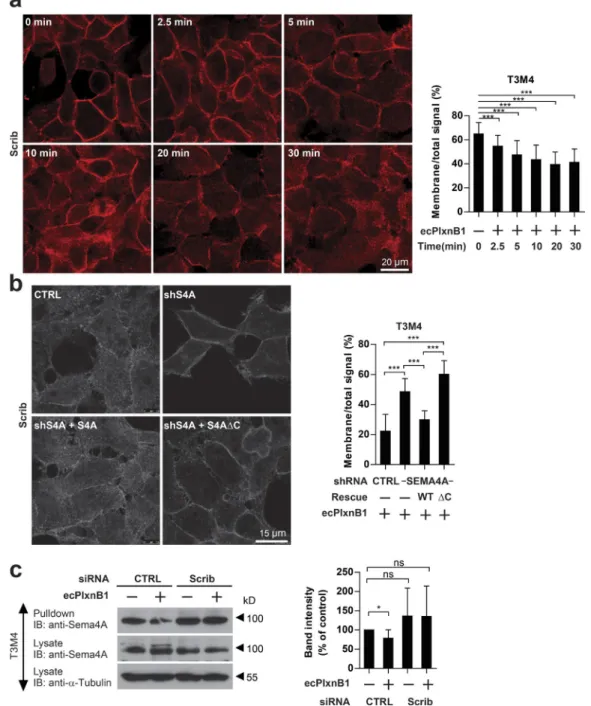
Plexin-B1 regulates Scrib localization through Sema4A
Scrib localization critically influences Scrib activity (Navarro et
al., 2005; Osmani et al., 2006). We therefore tested whether
Se-ma4A could regulate the distribution of Scrib within cells.
Al-though Scrib localized to the plasma membrane of T3M4 cells
in the absence of ecPlxnB1 (Fig. 6 a), application of ecPlxnB1
induced the internalization of Scrib in a time-dependent
man-ner (Fig. 6, a and b, top left panel). This effect of ecPlxnB1
was dependent on Sema4A, as shRNA-mediated knockdown
of Sema4A (Fig. S5 i) restored the plasma membrane
localiza-tion of Scrib (Fig. 6 b). Expression of shRNA-resistant
wild-type Sema4A in Sema4A shRNA–expressing cells rendered
the cells responsive to ecPlxnB1 again, whereas expression of
shRNA-resistant mutant Sema4A
ΔC did not (Fig. 6 b). These
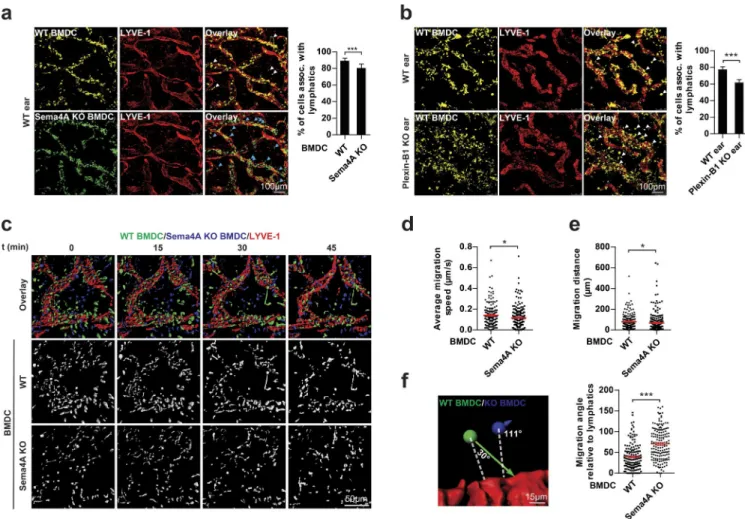
Figure 3. Plexin-B1 and Sema4A regulate DC migration ex vivo. (a) Mature BMDCs generated from wild-type (WT) and Sema4A knockout mice (Se-ma4A KO) were fluorescently labeled (WT, yellow; Se(Se-ma4A KO, green), mixed 1:1, and used for the ex vivo migration assay (right). After 1.5 h, BMDCs associated with lymphatic vessels were quantified (left). Examples of wild-type (white arrows) and Sema4A-knockout (blue arrows) BMDCs not associated with lymphatic vessels are marked. (b) Mature BMDCs generated from wild-type mice were allowed to migrate into ear sheets of wild-type or Plexin-B1 knockout mice for 1.5 h (right). BMDCs associated with lymphatic vessels were quantified (left). Examples of BMDCs not associated with lymphatic vessels are marked with white arrows. (c) Mature BMDCs generated from wild-type and Sema4A knockout mice were fluorescently labeled (WT, green; Sema4A KO, blue), mixed 1:1, and used for live-cell imaging (different time points shown). (d and e) Quantification of migration speed (d) and distance (e) of BMDCs with the indicated genotypes. (f) Analysis of the migration angle of BMDCs relative to the lymphatic vessel. Dashed white lines represent the shortest possible distance to lymphatic vessels. Red horizontal lines indicate means ± SEM. Colored arrows represent vectors of BMDC migration. Bar graphs in a and b show mean values ± SD from three independent experiments. Graphs in d–f are based on six independent experiments. Total numbers of analyzed cells are WT, n = 1,993 and Sema4A KO, n = 1,785 (a); WT ear, n = 1,786 and Plexin-B1 KO ear, n = 1,560 (b); WT, n = 172 and Sema4A KO,
results indicate that Plexin-B1 regulates Scrib localization
through Sema4A reverse signaling. Given that Scrib has been
shown to be involved in the regulation of protein trafficking
(La-huna et al., 2005), we next asked whether Scrib, in turn, controls
the localization of Sema4A. After application of ecPlxnB1, we
detected a significant decrease of Sema4A surface expression
(Fig. 6 c). This effect was abrogated by siRNA-mediated
knock-down of Scrib (Fig. 6 c).
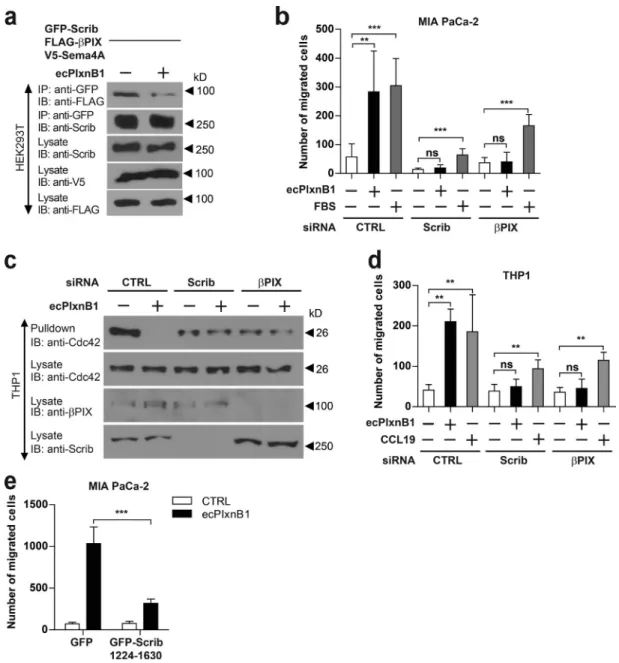
Plexin-B1–Sema4A reverse signaling interferes with the interaction of
Scrib and
β
PIXScrib has been shown to regulate Rac1 and Cdc42 activity
through its interaction with the Rac1/Cdc42 guanine
nucle-otide exchange factor (GEF)
βPIX (Audebert et al., 2004;
Osmani et al., 2006; Nola et al., 2008). Therefore, we tested
whether Plexin-B1, through its receptor Sema4A, could impact
the Scrib–
βPIX complex. In HEK293T cells, application of
ecPlxnB1 reduced the binding of Scrib to
βPIX (Fig. 7 a). To
test for the functional significance of the Scrib–
βPIX interaction
in the Plexin-B1–Sema4A reverse signaling pathway, we
per-formed siRNA-mediated knockdown of
βPIX in MIA PaCa-2
cells. We observed that
βPIX silencing abolished the effects of
ecPlxnB1 on cell migration (Fig. 7 b). In THP1 cells
differen-tiated to DCs, which endogenously express Sema4A (Fig. S4
e), ecPlxnB1 led to the deactivation of Cdc42 and increased
cell migration in a Scrib- and
βPIX-dependent manner (Fig. 7,
c and d; and Fig. S4 f). Cells with siRNA-mediated knockdown
of Scrib or
βPIX were still partially responsive to the known
promigratory factors FBS or CCL19 (Fig. 7, b and d; Berges
et al., 2005; Marsland et al., 2005), indicating a specific role
for Scrib and
βPIX in the Plexin-B1–Sema4A reverse signaling
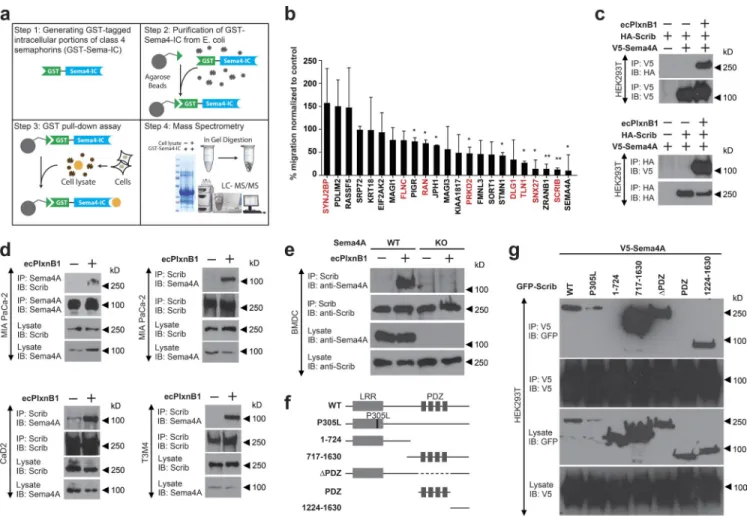
Figure 4. Scrib mediates reverse signaling of Sema4A. (a) Workflow for the identification of proteins interacting with the intracellular portion (IC) of class 4 semaphorins by mass spectrometry. For details, see Materials and methods. (b) MIA PaCa-2 cells transfected with the indicated siRNAs were examined in transwell migration assays in the absence or presence of 150 nM ecPlxnB1. The ecPlxnB1-induced effect on cells transfected with siRNA directed against the gene of interest is normalized to the ecPlxnB1-induced effect on cells transfected with control siRNA (percentage). Genes encoding for proteins identi-fied as potential Sema4A-interacting partners by the GST pulldown approach are colored in red. Error bars represent the mean ± SD. (c) HEK293T cells were transfected with plasmids encoding HA-tagged Scrib (HA-Scrib) alone or together with V5-tagged Sema4A (V5-Sema4A). After serum starvation and stimulation with or without ecPlxnB1, cells were lysed, and proteins were immunoprecipitated (IP) using anti-V5 or anti-HA antibodies coupled to protein A/G sepharose. Bound proteins were then separated and visualized using anti-HA or anti-V5 antibodies (as indicated). (d) MIA PaCa-2, CaD2, or T3M4 cells were serum starved and stimulated as indicated. Sema4A or Scrib were immunoprecipitated using the respective antibodies (IP). Protein complexes were visualized by Western blotting (immunblotting [IB]). (e) Mature BMDCs were generated from wild-type mice (WT) or Sema4A knockout mice (Sema4A KO). Cells were stimulated with or without 150 nM ecPlxnB1 and lysed, and protein complexes were immunoprecipitated using anti Scrib antibodies. Proteins were then immunoblotted using specific antibodies as indicated. (f) Schematic representation of GFP-tagged Scrib constructs used in this study. (g) HEK293T cells were transfected with V5-tagged Sema4A and constructs encoding GFP-tagged wild-type or deletion mutants of Scrib (as indicated). Protein complexes were immunoprecipitated in the presence of 150 nM ecPlxnB1 using anti-V5 antibody and visualized using the indicated antibodies. Error bars represent means ± SD. *, P < 0.05.
pathway. Moreover, blocking the Sema4A–Scrib interaction by
overexpressing the C-terminal portion of Scrib (amino acids
1224–1630) in MIA PaCa-2 cells inhibited the promigratory
effect of ecPlxnB1 (Fig. 7 e).
Discussion
Class 4 semaphorins are a widely expressed group of
transmem-brane proteins (Yazdani and Terman, 2006; Gu and Giraudo,
2013; Kang and Kumanogoh, 2013). Although the role and
im-portance of these semaphorins as ligands have been well
es-tablished (Gu and Giraudo, 2013; Roney et al., 2013; Worzfeld
and Offermanns, 2014), their potential function as receptors to
mediate cellular effects through reverse signaling is poorly
un-derstood (Battistini and Tamagnone, 2016). In this study, we
systematically characterized a potential receptor function of
a particular semaphorin, Sema4A, and analyzed cell behavior
and changes in signaling pathways induced by a soluble
extra-cellular portion of Plexin-B1. Indeed, we found that Plexin-B1
increases the migration of cancer and of DCs through reverse
signaling mediated by Sema4A.
Plexin-B1 is known to bind to both Sema4A and Sema4D
(Granziero et al., 2003; Yukawa et al., 2010). However, our
data show that Plexin-B1 can trigger cellular effects through
reverse signaling of Sema4A, but not of Sema4D. This may be
explained by the existence of additional, not yet identified
core-ceptors or by semaphorin-specific downstream mediators.
In this study, we used a soluble extracellular portion of
Plexin-B1 to activate Sema4A-mediated reverse signaling. In
contrast to full-length plexins, the role and function of their
secreted versions remain largely unexplored. In the case of
Plexin-B1, the secreted ectodomain may be the result of
al-ternative splicing or of proteolytic cleavage of the full-length
Figure 5. Sema4A reverse signaling regulates the activity of Rac1 and Cdc42. (a) MIA PaCa-2 cells stably expressing control shRNA or Sema4A shRNA either alone or together with shRNA-resistant wild-type (WT) or mutated (ΔC) Sema4A (as indicated) were starved and stimulated with or without 150 nM ecPlxnB1, and active Cdc42 was precipitated as described in Materials and methods. (b) T3M4 cells were treated with or without 150 nM ecPlxnB1, and Cdc42 activity was measured (pulldown). (c) Mature BMDCs generated from wild-type or Sema4A knockout mice (Sema4A KO) were stimulated with or without 150 nM ecPlxnB1 for 20 min. Cells were then lysed and the activity of Cdc42 was analyzed (pulldown). (d and e) MIA PaCa-2 cells stably expressing control or Sema4A shRNA were transfected with a FRET biosensor for Cdc42 and FRET ratios in response to 150 nM ecPlxnB1, and 100 µM of the Cdc42 inhibitor ML141 were analyzed as described in Materials and methods. (d) Representative traces are shown. CTRL, control. (e) The ecPlxnB1-in-duced change of Cdc42 activity was calculated as a percentage of the difference between the FRET ratio at baseline (before treatments) and the FRET ratio after ML141 treatment. n = 12 for control shRNA, n = 8 for Sema4A shRNA. (f) ecPlxnB1 was applied to one side of a T3M4 cell through a micropipette (as outlined in white at the top of the images) as described in Materials and methods. Shown are representative images and the corresponding FRET ratios within two different areas of the cell over time. The regions of interest (ROIs) indicate regions proximal or distal to the site of ecPlxnB1 application, respectively. Bar, 10 µm. (g) MIA PaCa-2 cells were transfected with constructs encoding HA-Scrib, V5-Sema5A, and the GFP-tagged C-terminal portion of Scrib (GFP-Scrib amino acids 1224–1630) as indicated. Cells were stimulated with or without 150 nM ecPlxnB1. Proteins interacting with Sema4A were immunoprecipitated using V5 antibody and visualized using respective antibodies. IB, immunoblotting; IP, immunoprecipitation. Error bars represent means ± SD. *, P < 0.05.
protein from the cell membrane (Tamagnone et al., 1999;
Ar-tigiani et al., 2003; Ito et al., 2014). Recently, increased
lev-els of a soluble, circulating Plexin-B1 portion were found in
postmenopausal women with low bone mass (Anastasilakis et
al., 2015); a secreted extracellular part of Plexin-B1 was also
detected in proteomics studies (Farrah et al., 2011). Moreover,
we detected soluble forms of Plexin-B1 of
∼70 kD in size
re-leased from lymphatic endothelial cells (HMV ECs). This form
closely resembles an alternatively spliced, secreted form of
Plexin-B1 (Tamagnone et al., 1999), suggesting a physiological
relevance of secreted Plexin-B1.
Migration is the key feature of DCs during their life cycle
(Randolph et al., 2008; Heuzé et al., 2013; Russo et al., 2013;
Teijeira et al., 2014). To home to lymph nodes, peripheral DCs
must migrate toward, and enter, lymphatic vessels. The
inter-action between DCs and the lymphatic endothelium can be
Figure 6. Plexin-B1–Sema4A signaling induces internalization of Scrib. (a) T3M4 cells were incubated with or without 150 nM ecPlxnB1, and Scrib was visualized by immunostaining at the indicated time points after application of ecPlxnB1. Scrib localization was analyzed using ImageJ as described in Materials and methods. Time point 0 min: n = 41; 2.5 min: n = 61; 5 min: n = 54; 10 min: n = 53; 20 min: n = 26; 30 min: n = 45. (b) T3M4 cells stably transfected with control shRNA or with Sema4A shRNA alone or together with either shRNA-resistant wild-type Sema4A (S4A) or an shRNA-resistant Sema4A intracellular deletion mutant (S4AΔC) were incubated with 150 nM ecPlxnB1 for 30 min, and Scrib was visualized by immunostaining. Scrib localization was analyzed using ImageJ as described in Materials and methods. Bar graphs show mean values ± SD from at least 10 cells per condition. (c) Surface proteins of T3M4 cells transfected with control or Scrib were biotinylated. Cells were then incubated with or without 150 nM ecPlxnB1 for 30 min, surface proteins were precipitated using streptavidin agarose, and bound Sema4A was visualized by Western blotting using an anti-Sema4A antibody (pulldown; right). Band intensities were quantified from six independent Western blots (left). ns, not significant. CTRL, control; IB, immunoblotting. Error bars represent means ± SD. *, P < 0.05; ***, P < 0.001.
mediated by various molecules including ICAM1, JAM1, or
CCR7 (Randolph et al., 2005), and it seems very likely that
the complete set of molecules regulating the entry of DCs into
lymphatic vessels is still to be determined. Our data strongly
suggest that Plexin-B1 is a novel factor secreted by lymphatic
endothelial cells, which regulates the migration of DCs into
lymphatic vessels through Sema4A reverse signaling.
Using an unbiased approach to screen for Sema4A-
interacting proteins, we identified Scrib as a binding
part-ner for Sema4A, which is critical for the promigratory effect
of Plexin-B1. This is in line with the known function of Scrib
in directed cell migration and wound healing in vitro and in
vivo (Dow et al., 2007; Michaelis et al., 2013). Scrib interacts
with the Cdc42/Rac1 GEF,
βPIX, and this interaction positively
regulates the GEF activity of
βPIX (Audebert et al., 2004;
Os-mani et al., 2006; Goicoechea et al., 2014). We tested whether
Plexin-B1, through its receptor Sema4A, may influence the
Scrib–
βPIX interaction and, in this way, affect the ability of
βPIX to activate Cdc42 and Rac1. Indeed, we observed that in
cells stimulated with Plexin-B1, the Scrib–
βPIX interaction was
impaired, thus providing a mechanistic basis for the Plexin-B1–
induced, Sema4A-mediated deactivation of Cdc42 and Rac1.
Cdc42 and Rac1 are central regulators of cell migration, and
numerous reports have shown that global inhibition of Cdc42 or
Figure 7. Scrib and βPIX are required for Plexin-B1–Sema4A reverse signaling. (a) HEK293T cells transfected with V5-Sema4A, GFP-Scrib, and FLAG-βPIX
were stimulated with or without 150 nM ecPlxnB1. Protein complexes were precipitated using anti-GFP antibodies and visualized with immunoblotting (IB). IP, immunoprecipitation. (b) MIA PaCa-2 cells were transfected with siRNAs as indicated, and cell migration in response to 150 nM ecPlxnB1 or 10% FBS in a transwell system was analyzed as described in Materials and methods (total n = 6 per condition). (c and d) THP1 cells were fully differentiated to DCs as described in Materials and methods. Cells were then stimulated with 150 nM ecPlxnB1 or 25 ng/ml CCL19 (as indicated), and Cdc42 activity (c) and cell migration (d) was analyzed by using a transwell system as described in Materials and methods (total n = 6 per condition). ns, not significant. CTRL, control. (e) MIA PaCa-2 cells were transfected with cDNAs encoding GFP or GFP-Scrib (amino acids 1224–1630), and cell migration in response to ecPlxnB1 was measured as described in Materials and methods. Shown are mean values ± SD from three independent experiments (total n = 8 per condition). Error bars represent means ± SD. **, P < 0.01; ***, P < 0.001.
Rac1 activity in the cell—by expression of dominant-negative
mutants, RNAi-mediated knockdown, or gene
knockouts—in-hibits cell migration (Ridley, 2015). It is therefore an
intrigu-ing findintrigu-ing of our study that the lowerintrigu-ing of Cdc42 and Rac1
activity by Plexin-B1–Sema4A signaling correlates with a
promigratory effect toward higher Plexin-B1 concentrations.
Importantly, directed cell migration requires a tight
spatiotem-poral coordination of Rho-GTPase activities (Raftopoulou and
Hall, 2004). Although their activation is necessary to promote
cell movement through the formation of filopodia and
lamelli-podia, they need to be rapidly deactivated to ensure fluent cell
movement (Sadok and Marshall, 2014). Dynamic
measure-ments of small GTPase activity show that during cell migration,
small GTPases are constantly activated and deactivated, rather
than being active for the whole time (
Žárský and Potocký, 2010;
Gloerich and Bos, 2011; Kiyokawa et al., 2011; Tolias et al.,
2011; Lawson and Burridge, 2014; Zegers and Friedl, 2014).
Using FRET assays, we visualized Cdc42 activity in cells with
spatial and temporal resolution and observed that Cdc42
activ-ity decreased at the site of Plexin-B1 application, indicating that
in contrast to a global inhibition of Cdc42 activity, exposure
to a gradient of Plexin-B1 translates into polarized modulation
of Cdc42 activity. Another interesting observation of our FRET
studies was the timeline of the inhibition of Cdc42 and Rac1
activity by Plexin-B1. Although changes in Cdc42 or Rac1
ac-tivity measured by FRET typically occur within seconds after
the application of a stimulus (e.g., a chemokine or growth
fac-tor; Hanna et al., 2014; Martin et al., 2016), changes of Cdc42
and Rac1 activity in response to Plexin-B1 were not detectable
before 1.5–2 min. Our data therefore suggest that the
promi-gratory effect of Plexin-B1–Sema4A signaling results from a
complex spatiotemporal regulation of Cdc42 and Rac1 activity.
Importantly, the function of Scrib critically depends on its
localization at the plasma membrane. Mislocalization of Scrib
promotes the invasion of cells through the extracellular matrix
(Dow et al., 2007, 2008). We found that the interaction of Scrib
with Sema4A upon Plexin-B1 binding promotes the
internaliza-tion of Scrib. Given that Scrib has several funcinternaliza-tions in addiinternaliza-tion to
modulating Cdc42 and Rac1 activity through
βPIX (Elsum et al.,
2012), this Plexin-B1–induced internalization of Scrib is likely
to contribute to the effect on cell migration. Of note, our findings
are consistent with previously published data, which show that
the interaction between Scrib and CD74 results in the
phosphor-ylation of the C-terminal portion of Scrib and in the translocation
of Scrib from the sites of cell-to-cell contacts at the plasma
mem-brane to the cytoplasm, thereby effectively enhancing cancer cell
migration and invasiveness (Metodieva et al., 2013).
In summary, we demonstrate that Plexin-B1–Sema4A
sig-naling works bidirectionally. We have identified a novel sigsig-naling
mechanism in which Sema4A serves as a receptor and mediates
signals from its ligand Plexin-B1 to regulate migration and
inva-sion of cancer cells as well as chemotaxis of DCs. We propose a
model in which the binding of Plexin-B1 to Sema4A promotes
the interaction of Sema4A with Scrib, resulting in a
destabili-zation of the Scrib–
βPIX complex and internalization of Scrib,
thereby lowering the Cdc42/Rac1 GEF activity of
βPIX and
decreasing Cdc42 and Rac1 activity. The tight spatiotemporal
integration of these events then controls directed cell migration.
Reverse signaling might be a common feature of transmembrane
semaphorins, turning the semaphorin–plexin system into a
bidi-rectional, rather than unidibidi-rectional, communication system
be-tween cells to regulate various biological processes.
Materials and methods
Cell culture and transfection
MDA-MB-231 and Calu-3 were purchased from ATCC; CaD2, A431, and SK-OV-3 were purchased from Cell Line Service. MIA PaCa-2, CFP AC, AsPc, and T3M4 were gifts from N. Giese, and SHSY-5Y cells were provided by S. Rieken (University Hospital Heidelberg, Ber-gheim, Germany). HeLa were provided by M. Bähr (German Cancer Research Center, Heidelberg, Germany). HMV EC-dLyAd cells and human umbilical vein endothelial cells were purchased from Lonza and cultured using the manufacturer’s instructions. MIA PaCa-2, A431, MDA-MB-231, Calu-3, SHSY-5Y, CFP AC, HeLa, and HEK293T cell lines were maintained in DMEM supplemented with 10% FBS. T3M4 and AsPc cell lines were maintained in RPMI-1640 supplemented with 10% FBS. SK-OV-3 cells were maintained in McCoy’s 5a sup-plemented with 10% FBS. THP1 cells were provided by B. Strilic (Max Planck Institute for Heart and Lung Research, Bad Nauheim, Germany). Cells were maintained in RPMI-1640 supplemented with 10% FBS and l-glutamine. To differentiate maturate THP1 cells into dendritic lineage cells, recombinant human IL-4 (100 ng/ml = 1,500 IU/ml; AF-200-04; PeproTech) and granulocyte–macrophage colo-ny-stimulating factor (GM-CSF; 100 ng/ml = 2,000 IU/ml; 315-03; Pe-proTech) were added to the cell culture medium for 5 d. To maturate the DCs from THP1 cells, recombinant human TNF (20 ng/ml = 2,000 IU/ ml; 300-01A; PeproTech) and 200 ng/ml ionomycin (I24222; Thermo Fisher Scientific) were added to the cell culture medium. Cells were then incubated for 1–3 d in a humidified incubator and then used for experiments. siRNA transfections of THP1 were performed using the Amaxa Cell Line Nucleofector kit V (Lonza) before cell maturation. All cells were maintained at 37°C and 5% CO2. cDNA transfection
in HEK293T cells was performed by the calcium phosphate method (Swiercz et al., 2002). Cells were transfected with cDNA by using Li-pofectamine 2000 (Thermo Fisher Scientific) according to the manu-facturer’s instructions. RNAiMAX reagent (Thermo Fisher Scientific) was used for the siRNA transfection.
Stably transfected MIA PaCa-2 and T3M4 cells were generated using lentiviruses according to the manufacturer’s protocols (Sig-ma-Aldrich). Cells were selected in 1 µg/ml puromycin. For rescue experiments with Sema4A constructs, GFP-positive cells were sorted with a JSAN cell sorter (Bay Bioscience Co., Ltd.).
Antibodies and reagents
The following antibodies were purchased from commercial sources: anti-GFP (1: 2,000; ChromoTek), rabbit polyclonal anti-Sema4A (1:500; C1C3; GeneTex), anti-Scrib (1:1,000; 4475; Cell Signaling Technology), anti-RhoA (1:400; clone 67B9; Cell Signaling Tech-nology), anti-RhoB (1:500; 2098S; Cell Signaling TechTech-nology), anti-RhoC (1:500; 3430S; Cell Signaling Technology), anti-Scrib (1:1,000; sc-28737; Santa Cruz Biotechnology, Inc.), mouse monoclo-nal anti–α-tubulin (1:1,000; clone DM1A; Sigma-Aldrich), anti-HA (Roche), anti–HA-HRP (Sigma-Aldrich), anti–MYC-HRP (Sigma- Aldrich), anti–FLAG-HRP (Sigma-Aldrich), anti-Rac1 (1:500; 05– 389; clone 23A8; EMD Millipore), anti-V5 (1:1,000; AbD Serotec), anti-Cdc42 (1:1,000; BD), rat monoclonal anti–LYVE-1 (1:500; clone 223322; R&D Systems), rabbit polyclonal anti-βPIX (1:400; 4515; Cell Signaling Technology), hamster monoclonal anti–CD11c-phy-coerythrin (PE; 1:100; 12-0114-81; eBioscience), anti–B220-FITC (1:100; 553088; BD), anti–mouse T cell receptor (TCR)–PerCP/Cy5.5 (1:100; clone H57-597; BioLegend), Fc-blocking antibody (1:100; clone 2.4G2; Bio X Cell), rabbit anti–goat Cy3 (1:200; Jackson Immu-noResearch Laboratories, Inc.), goat polyclonal anti–Plexin-B1 (1:400; AF3749; R&D Systems), and anti-Sema4D (1:1,000; 610670; BD).
The rabbit polyclonal anti-Sema4A antibody 1–1-1-B1 was generated by ABmart against the peptide C-RTS ASD VDA DNN.GM-CSF and used at a 1:1,000 dilution. TNF (PeproTech) was used at concentrations of 20 ng/ml and 10 ng/ml. CCL19 (R&D Systems) was used at a final concentration of 25 ng/ml.
Plasmids and cloning
cDNA clones of human Sema4A were purchased from GE Health-care. N-terminally V5-tagged full-length Sema4A and its deletion mutant Sema4AΔC (amino acids 1–707) were generated by PCR and subcloned into pcDNA3.1. A secreted Myc-His–tagged form of Plexin-B1 (ecPlxnB1; amino acids 20–534) in the pSecTag2 vector was described previously (Worzfeld et al., 2012). For lentivirus pro-duction, V5-tagged Sema4A or Sema4AΔC was inserted into pLVX-IRES-ZsGreen1 vector or pLVX-IRES-mCherry vector. pSPAX and pMD2G vectors were from Sigma-Aldrich. The intracellular parts of human Sema4A (amino acids 705–761), Sema4B (amino acids 734–832), Sema4C (amino acids 685–833), Sema4D (amino acids 756–862), Sema4F (amino acids 681–770), and Sema4G (amino acids 697–838) were cloned into pGEX4T-1 vector. Identities of all clones were confirmed by sequencing. HA-tagged Scrib and GFP-tagged Scrib constructs were described previously (Audebert et al., 2004). FLAG-tagged βPIX was described previously (Osmani et al., 2006; Dacquin et al., 2011).
Mice
Sema4A knockout ES clones (ID: EPD0105_3_B05) were purchased from EUC OMM and microinjected into C57BL/6 blastocysts. To generate constitutive Sema4A knockout mice, mice carrying the Se-ma4A “knockout-first” allele were crossed with E2a-Cre mice. The successful knockout of Sema4A was confirmed by Southern blotting. B6.Cg-Tg(Itgax-Venus)1Mnz/J expressing YFP under the CD11c promoter were purchased from The Jackson Laboratory. To generate mice lacking Sema4A and expressing YFP in CD11c-positive cells, Se-ma4A knockout mice were crossed with mice expressing YFP under the control of the CD11c (Itgax) promotor. Plexin-B1 knockout mice were generated as described previously (Deng et al., 2007). Mice were maintained under specific pathogen-free conditions. All procedures involving animals were performed in accordance with German Ani-mal Welfare legislation.
Complete list of siRNA/shRNA and primers used
siRNAs targeting human SEMA4A (SI04368567), SEMA4B (SI04283209), SEMA4C (SI04354056, SI04362197), SEMA4D (SI03053701, SI04952332), SEMA4F (SI04163019, SI04170726), SEMA4G (SI04188198, SI04230303), SNX27 (SI04209772, SI04220755), DLG1 (SI03046099, SI03102799), SYNJ2BP (SI04243848, SI04315535), RAN (SI04950505, SI04950512), FLNC (SI03648820, SI03648813), TLN1 (SI00301931, SI00086982), SCR IB (SI04182290, SI04295655), SORT1 (SI00729316, SI03115168), MAGI3 (SI02660448, SI02644439), ZRA NB1 (SI00118860, SI00118867), EIF2AK2 (SI02223011, SI02223018), MAGI1 (SI04234328, SI03181080), JPH1 (SI04289887, SI04294829), PDL IM2 (SI00681625, SI04957029), KRT18 (SI02653658, SI03187996), PIGR (SI00040887, SI02629151), RAS SF5 (SI03056816, SI03058895), STMN1 (SI05389986, SI00301875), PRKD2 (SI02224768, SI02224775), FMNL3 (SI04149607, SI04188884), SRP72 (SI04334981, SI04361308), and KIAA1817 (SI00460887, SI00460894) were purchased from QIA GEN. siRNA targeting human βPIX (SASI_Hs02_00325961, SASI_Hs02_00325962) was purchased from Sigma-Aldrich. A second independent Scrib siRNA was pur-chased from QIA GEN (SI05053041).
shRNA targeting human Sema4A (TRCN0000058137) was from Sigma-Aldrich. The following RT-PCR primers were synthetized by Sigma-Aldrich: human SEMA4A (5′-GCT GCC CTT CAA CGT CAT-3′, 5′-AGG TGA AGA CTG CGT AGA TGTG-3′), human SEMA4B (5′-TGT GGC CTC AGC CTA CATT-3′, 5′-GAT CTT GTC ATC ATC GCC TTG-3′), human SEMA4C (5′-GAA GAA GGG CAC CAA CTT CA-3′, 5′-TGG CTC CAT CAA GTC CTG TA-3′), human SEMA4D (5′-CTT CCT GAA AGC CCG ACTC-3′, 5′-GCA GCA CAT TGA AGA CCA AG-3′), human SEMA4F (5′-TCC TGA AGA TGA GCG GTTG-3′, 5′-AGG AAG GGT GGT GAG AAT CC-3′), human SEMA4G (5′-AGT GCA GTG GGT GAT GAT GA-3′, 5′-TGA GTG AAG CTG CCA GAGC-3′), human GAP DH (5′-GCA TCC TGG GCT ACA CTGA-3′, 5′-CCA GCG TCA AAG GTG GAG-3′), human SCR IB (5′-CTC TGC CAC ATT CCT CACC-3′, 5′-GGG GTG GCA GTG GTT ATG-3′), and mouse SEMA4A (5′-ATG GAG TCT CCT GCG TGT TT-3′, 5′-GAA GCA GGT GGC AGT GATG-3′); (5′-CCC AGC CTG TTC TCA AGA CT-3′, 5′-ATA GAC GAC CTG GGT GGA TG-3′); (5′-GCA GCT GCC ATT CAA CATC-3′, 5′-CAC AGA CTG CTG AGC TCC TG-3′); (5′-AAC CCG GAG TGG GTA TGC-3′, 5′-TTG GGG ACT GTC AGG ACT TC-3′).
RT-PCR
RNA was extracted using the RNeasy Mini kit (QIA GEN). cDNA was synthesized by reverse transcription (First Strand cDNA Synthesis kit; Roche). 60 ng cDNA per reaction was used. Primers were designed with the online tool provided by Roche. Quantitative PCR was per-formed using the Light-Cycler 480 Probes Master system from Roche. Protein purification
ecPlxnB1 (amino acids 20–534 of human Plexin-B1) was purified from conditioned medium of transiently transfected HEK293 cells (Worzfeld et al., 2012), whereas His-tagged Sema4D was produced from super-natants of stably transfected CHO cells (Love et al., 2003) using met-al-ion affinity chromatography (HisPUR Cobalt Resin; Thermo Fisher Scientific) followed by gel filtration chromatography (Superdex S200 HR10/30; GE Healthcare). GST fusion proteins were expressed in Escherichia coli (DE3 Rosetta; EMD Millipore) and purified using Protino Agarose 4B (Macherey and Nagel; Swiercz et al., 2002). Binding of ecPlxnB1 to Sema4A-expressing cells
MIA PaCa-2 cells were exposed to 150 nM ecPlxnB1 for 20 min, washed three times with PBS, and incubated with an anti–Myc-HRP antibody. After washing three times with PBS, HRP activity was mea-sured using the General Elisa Protocol (Dako).
Proliferation assay
For proliferation assays, cells were seeded onto 6-well plates and counted using a Neubauer chamber on four consecutive days.
GST pulldown assay
3 × 10⁷ cells (MIA PaCa-2, HEK293T, CaD2, or SK-OV-3 cell lines)
were lysed in radioimmunoprecipitation assay (RIPA) lysis buffer (150 mM NaCl, 50 mM Tris, pH 7.4, 1% Triton X-100, 0.1% sodium dodecyl sulfate, 0.25% sodium deoxycholate, 1 µg/ml each of leupeptin, aprotinin, and pepstatin, and 1 mM 4-(2-aminoethyl)-benzosulfonylflu-oridhydrochloride). GST fusion proteins (consisting of GST and the intracellular portions of different class 4 semaphorins) bound to Protino Agarose 4B were incubated with these lysates at 4°C for 2 h. Purified GST fusion proteins incubated with lysis buffer (without cells) and pu-rified GST alone (lacking semaphorin intracellular portions) incubated with cell lysates or lysis buffer served as controls. Protino Agarose 4B beads were then washed three times in RIPA lysis buffer, and bound proteins were eluted by boiling with Laemmli buffer.
Mass spectrometry analysis
Identification of proteins bound to the intracellular portions of class 4 semaphorins (see previous paragraph) was performed in the Biomolec-ular Mass Spectrometry Facility of the Max Planck Institute for Heart and Lung Research. Peptides were measured on an LTQ-Oribtrap XL instrument (Thermo Fisher Scientific). An Agilent 1200 (Agilent Tech-nologies) was coupled via a nanoelectrospray ionization source to the mass spectrometer. A binary buffer system was used: (A) 0.5% ace-tic acid in H2O and (B) 0.5% acetic acid in 80% acetonitrile. 15-cm
in-house–packed columns were used for peptide separation along an increasing buffer B content concentration from 5 to 39% within 50 min followed by a washing step with 95% buffer B and a reequilibration to 5% buffer B. The mass spectrometer operated in a Top5 method, and collision-induced dissociation fragmentation (normal collision energy: 35) was used for peptide identification.
MaxQuant (version 1.2.0.18; Max Planck Institute of Biochem-istry) and the implemented Andromeda search engine was used to cor-relate measured mass spectrometry (MS)/MS spectra with the Homo sapiens or Mus musculus International Protein Index database. The false discovery rate on peptide and protein level was set to 1%, and the minimal peptide length was seven amino acids. MS and MS/MS mass tolerance were kept as default settings. N-terminal protein acetylation and oxidation at methionine residues were defined as variable modi-fications, whereas carbamidomethylation at cysteine residues was set as a fixed modification. Ratios to identify possible binding partners of semaphorins were calculated based on the label-free quantification in-tensity of protein groups.
Using a scoring system based on several parameters (label-free quantification intensity, number of identified peptides, number of iden-tified unique peptides, and number of cell lines in which a potential interaction partner was identified), we identified a total of 65 potential interaction partners for class 4 semaphorins. Of those, we excluded 10 proteins with known nuclear localization and function (e.g., histones), leaving 55 candidates. The 22 candidates with the highest score in the scoring system were further tested in migration assays using siRNAs directed against these candidates (see next section).
Migration and invasion assays
For transwell migration assays, 5 × 10⁴ cells were serum starved
overnight and seeded into 96-transwell migration plates (order MAM IC8S10; EMD Millipore). Control buffer or buffer containing 150 nM ecPlxnB1 was added to the lower chamber of the respective wells. 18 h later, nonmigrated cells on the upper surface of the filter were removed, and migrated cells on the lower surface of the filter were fixed in meth-anol and stained with toluidine blue. Cell migration was analyzed by measuring the staining intensity using ImageJ (National Institutes of Health; labeling of y axis in the respective experiments with “cell mi-gration”) or by counting the number of migrated cells manually (label-ing of y axis in the respective experiments with “number of migrated cells”). For transwell migration assays of THP1 cells, cells were al-lowed to migrate for 3 h, and cells in the lower chamber were counted. For 3D migration assays of DCs, 107 cells/ml mature BMDCs,
107 cells/ml CD11c+ splenic DCs (purity > 80%), or 107 cells/ml THP1
cells were mixed with a collagen I gel and put into µ-Slide Chemotax-is3D migration chambers (ibidi). 150 nM ecPlxnB1 was added to one of
the reservoirs, and cell migration was imaged by live-cell imaging over a period of 2–4 h by capturing images every 1–2 min (see Microscope image acquisition). Cells were tracked using the Manual Tracking Plug-in (Fiji) of ImageJ. For every 3D migration experiment, the tracks of 10–37 cells were monitored. The y-forward migration index (FMIy)
and center of mass were calculated using the Chemotaxis and Migra-tion tool plugin (ibidi) for ImageJ. The FMIy represents the efficiency
of the forward migration of cells in relation to the y axis, and the center of mass represents the averaged point of all cell endpoints (ibidi).
Invasion assays were performed as described previously (Worzfeld et al., 2012).
DC isolation, culture, and transfection
For the isolation of splenic DCs, spleens from C57BL/6 mice were di-gested by collagenase D and passed through a 40-µm nylon mesh to remove debris. Erythrocytes were lysed and cells were washed three times with RPMI-1640 medium. CD11c+ DCs were FACS sorted with
CD11c-PE antibody. For the generation of BMDCs, bone marrow was flushed from C57BL/6 mice femurs and tibias with ice-cold RPMI-1640 medium. Erythrocytes were lysed and cells were passed through a 40-µm nylon mesh to remove debris. Cells were washed three times with RPMI-1640 medium and put into 100-mm Petri dishes in complete growth me-dium plus 20 ng/ml GM-CSF (Inaba et al., 1992). Meme-dium was changed every 2 or 3 d, and DCs were collected from days 6 to 8. 10 ng/ml TNF was added overnight to DCs for maturation. BMDCs were trans-fected using lentiviruses carrying V5-tagged Sema4A-IRES-mCherry or V5-tagged Sema4AΔC-IRES-ZsGreen1. In brief, HEK293 cells were transiently transfected with vectors for generating lentiviruses. 3 d after transfection, the virus-containing medium was collected and filtered. 10 µg/ml hexadimethrine bromide (Polybrene) and 20 mM Hepes were added to viruses. BMDCs were prepared as described in this paragraph and seeded onto 24-well plates. The next day (day 2), virus-containing medium was added, and the plates were centrifuged at 2,500 rpm at 30°C for 90 min. The plates were incubated at 37°C and 5% CO2 for
3 h followed by centrifugation at 1,500 rpm for 5 min. Supernatant was removed and fresh culture medium was added to the cells. The procedure was repeated two more times (on days 3 and 4; Dudziak et al., 2007). FACS sorting
MIA PaCa-2 and T3M4 cells infected with pLVX-IRES-ZsGreen1- Sema4A or pLVX-IRES-ZsGreen1-Sema4AΔC lentiviruses were tryp-sinized, and cells were resuspended in PBS containing 0.5% BSA and 1 mM EDTA. GFP-positive cells were sorted using a JSAN cell sorter. Splenic DCs were labeled and sorted with CD11c-PE. Purity was deter-mined using FACS Canto II (BD) by labeling the cells with CD11c-PE, B220-FITC, and TCR-Cy5.5.
Ex vivo crawl-in assay
The ex vivo crawl-in assay was adapted from Weber and Sixt (2013). C57BL/6 mice were sacrificed, their ears removed, and ears were sepa-rated into dorsal and ventral sheets. Ventral ear sheets without cartilage were immunostained and mounted on self-made migration chambers with the dermal surface exposed on top. DCs were labeled with 1.25 µm seminaphtharhodafluor (Thermo Fisher Scientific) or 1.25 µm carboxyfluorescein succinimidyl ester (Thermo Fisher Scientific) in culture medium and added on top of the dermis. After 5–10 min of incubation at 37°C and 5% CO2, noninfiltrated DCs were removed, and
new medium was added on top of the dermis. Ear sheets were incubated in a climatized (37°C, 5% CO2) chamber for different time periods,
washed with PBS, fixed in 1% PFA, and mounted for confocal mi-croscopy using Fluoromount W (Serva Electrophoresis). Alternatively, migration of DCs was recorded by live-cell imaging.
Immunoprecipitations and Cdc42/Rac1 pulldown assays
For protein immunoprecipitation, cells were lysed in ice-cold RIPA buffer (150 mM NaCl, 50 mM Tris, pH 7.4, 1% Triton X-100, 0.1% sodium dodecyl sulfate, 0.25% sodium deoxycholate, 1 µg/ml each of leupeptin, aprotinin, and pepstatin, 1 mM 4-(2-aminoethyl)-ben-zosulfonylfluoridhydrochloride, and 1 mM Na3VO4). Lysates were
centrifuged, and supernatants were incubated with different antibodies in the presence of Protein A/G PLUS Agarose (Santa Cruz Biotechnol-ogy, Inc.). Agarose beads were then centrifuged and washed several times using ice-cold RIPA buffer. Finally, antibody-bound proteins were eluted by boiling the beads in Laemmli buffer. Samples were then subjected to Western blotting.
Activities of Rac1 and Cdc42 were measured using GST-tagged PAK1 (Swiercz et al., 2002). The activities of RhoA, RhoB, and RhoC were tested using GST-tagged Rhotekin (Ren and Schwartz, 2000). Western blot
Western blotting was performed according to standard laboratory protocols. In brief, cell lysates or precipitates were separated using SDS-PAGE, followed by transfer onto nitrocellulose membranes and blocking of nonspecific binding sites with 5% nonfat milk in Tris-buffered saline with Tween 20 (TBST) for 1 h at room tempera-ture. The blots were probed with primary antibodies at 4°C overnight, washed three times with TBST, incubated with secondary antibodies for 1.5 h at room temperature, and washed again three times with TBST, and proteins were visualized using an ECL system (Thermo Fisher Scientific). Western blot band intensities were quantified using the Gel Analysis tool of ImageJ.
Cell surface biotinylation and precipitation of biotinylated proteins Cell surface biotinylation was performed using the EZ-Link Sulfo-NHS-Biotinylation kit (Thermo Fisher Scientific) according to the manufacturer’s instructions. Biotinylated cells were lysed in ice-cold RIPA buffer (Fig. S1 f) or a buffer containing 25 mM Tris-HCl, pH 7.4, 150 mM NaCl, 5 mM EDTA, and 1% Triton X-100 (Fig. 6 c), and biotinylated surface proteins were precipitated from the clarified lysates using streptavidin agarose (Thermo Fisher Scientific).
Immunostaining and imaging
Cells were starved overnight and stimulated with 150 nM Plexin-B1. Cells were then fixed with 4% PFA and stained using an anti-Scrib (1:300; sc-28737) and an Alexa Fluor 594–conjugated secondary anti-body. Images were acquired using an SP5 confocal microscope (Leica Biosystems). Membrane staining versus total staining was analyzed using the Profile Plot function of ImageJ.
Microarray analysis
Expression data from lymphatic endothelial cells were analyzed based on Affymetrix Mouse Genome 430 2.0 arrays, downloaded from GEO (dataset GSE22034; four replicates). The array signals were aggregated and normalized via robust multiarray average, including quantile nor-malization, and were used to calculate the frequency distribution of gene expressions. In total, 45,101 single gene expression values were used. To generate one single representative value for each gene, the mean of all replicates was calculated. The resulting values were used for frequency calculation. Bin size was set to 0.5.
FRET measurements
Plasmids encoding Cdc42 Cdc42-2G) and Rac1 (pTriEx4-Rac1-2G) FRET biosensors were a gift from O. Pertz (University of Bern, Bern, Switzerland; plasmids 66110 and 68814, respectively; Addgene; Fritz et al., 2015). MIA PaCa-2 or T3M4 cells were trans-fected with plasmids encoding a FRET biosensor and MeGAP (=SRG AP3) and seeded on glass coverslips. For FRET measurements, cells were incubated in FRET buffer (137 mM NaCl, 5.4 mM KCl, 2 mM CaCl2, 1 mM MgCl2, and 10 mM Hepes, pH 7.3). FRET imaging was
performed on an inverted fluorescence microscope (Eclipse Ti; Nikon) as described previously (Wolters et al., 2015) using a light-emitting
diode excitation system (pE-2; CoolLED) containing light-emitting di-odes emitting light at 425 nm and 500 nm, respectively. Dual emission (cyan and yellow) images with an exposure time of 2 ms were acquired with a rate of 12/min. Ratio images (F535/F480) were calculated with-out correction for bleedthrough and false excitation. Cells that were not responsive to the Cdc42 inhibitor, ML141, or to the Rac inhibitor, EHT1864, were excluded from the analysis.
Experiments designed to measure the effects of a local Plexin-B1 stimulus were performed by placing a micropipette on one side of the cell while the cell was exposed to a continuous laminar flow of FRET buffer from the opposite direction that was applied using a perfusion system (ALA-VC3-8SP; ALA Scientific Instruments). Images were acquired every 5 s with illumination times of 40–60 ms. Because FRET was measured with a monomolecular sensor, no background subtrac-tion and bleedthrough correcsubtrac-tions were performed. The images were generated using NIS Elements (Nikon) and show averages of four con-secutive data points to reduce noise.
Microscope image acquisition
Live-cell imaging of DC migration in vitro was performed with an inverse microscope (37°C, 5% CO2, 10× objective; IX-1; Olympus).
Confocal laser-scanning microscopes used in this study were Leica Biosystems SP5 (40× and 63× objectives) and Leica Biosystems SP8 (for live-cell imaging; 37°C, 5% CO2, 20× objective). Analysis of
live-cell imaging of DC migration ex vivo was done by Imaris software. Statistical analysis
Statistical significance was evaluated by Student’s t test. Data shown in Figs. 1 (b–f), 2 (a–d), 3 (a and b), 4 (b), 5 (d), 6 (a–c), 7 (b, d, and e), S1 (a, g, h, j, and k), S2 (b, d, and e), S3 (a), S4 (b, d, and f), and S5 (a and g) are means ± SD. Data shown in Fig. 3 (d–f) are means ± SEM. *, P < 0.05; **, P < 0.01; ***, P < 0.001.
Online supplemental material
Fig. S1 provides additional evidence that the extracellular portion of Plexin-B1 increases cancer cell migration through Sema4A. Fig. S2 shows the purity of FACS-sorted splenic DCs, the generation and vali-dation of Sema4A-deficient mice, and the migration parameters of DCs in response to different stimuli. Fig. S3 depicts additional analyses of BMDC migration toward ear lymphatic vessels and provides an expres-sion analysis of lymphatic endothelial cells and BMDCs. Fig. S4 shows that the promigratory effect of the extracellular portion of Plexin-B1 depends on Scrib. Fig. S5 demonstrates the modulation of Rho-GTPase activities by the extracellular portion of Plexin-B1 through Sema4A– Scrib. Video 1 shows the migration of wild-type and Sema4A-deficient BMDCs toward ear lymphatic vessels ex vivo.
Acknowledgments
The authors would like to acknowledge Svea Hümmer and Justin Mirus for secretarial help with the preparation of the manuscript and Dag-mar Magalei for technical help.
T. Worzfeld is supported by grants from the German Research Foun-dation (grants WO 1901/2-1 and GRK 2213) and from the Univer-sity Medical Center Giessen and Marburg. J.M. Swiercz and T. Sun were supported by the German Research Foundation (grant SW 148/1-1). J.-P. Borg’s laboratory is supported by La Ligue Nationale Contre le Cancer (Label Ligue JPB) and Site de Recherche Intégrée sur le Cancer (INCa-DGOS-Inserm 6038). J.-P. Borg is a scholar of Institut Universitaire de France. T. Worzfeld, J.M. Swiercz, and S. Offer-manns hold a patent on B-type plexin antagonists and uses thereof.