HAL Id: hal-01117627
https://hal-univ-rennes1.archives-ouvertes.fr/hal-01117627
Submitted on 19 May 2015HAL is a multi-disciplinary open access archive for the deposit and dissemination of sci-entific research documents, whether they are pub-lished or not. The documents may come from teaching and research institutions in France or abroad, or from public or private research centers.
L’archive ouverte pluridisciplinaire HAL, est destinée au dépôt et à la diffusion de documents scientifiques de niveau recherche, publiés ou non, émanant des établissements d’enseignement et de recherche français ou étrangers, des laboratoires publics ou privés.
Autophagy and senescence, stress responses induced by
the DNA-damaging mycotoxin alternariol.
Anita Solhaug, M L Torgersen, J A Holme, Dominique Lagadic-Gossmann, G
S Eriksen
To cite this version:
Anita Solhaug, M L Torgersen, J A Holme, Dominique Lagadic-Gossmann, G S Eriksen. Autophagy and senescence, stress responses induced by the DNA-damaging mycotoxin alternariol.. Toxicology, Elsevier, 2014, 326, pp.119-29. �10.1016/j.tox.2014.10.009�. �hal-01117627�
1
Autophagy and senescence, stress responses induced by the
DNA-damaging mycotoxin alternariol
A Solhaug1*, ML Torgersen2,3, JA Holme4, D Lagadic-Gossmann5,6, GS Eriksen1
1Norwegian Veterinary Institute, 0454 Oslo, Norway,2Department of Biochemistry, Institute for
Cancer Research, The Norwegian Radium Hospital, Oslo University Hospital, 0379 Oslo, Norway,
3Centre for Cancer Biomedicine, Faculty of Medicine, University of Oslo, 0316, Norway, 4Division
of Environmental Medicine, Norwegian Institute of Public Health, 0403 Oslo, Norway, 5Inserm U1085, IRSET, Rennes, France, 6Université Rennes 1, SFR BIOSIT, Rennes, France.
*Corresponding author:
Anita Solhaug, PhD
Norwegian Veterinary Institute
P.O.BOX 750 Centrum, 0106 Oslo, Norway
Tel: +47 23216214; Fax: +47 23216201
2 Abstract
The mycotoxin alternariol (AOH), a frequent contaminant in fruit and grain, is known to induce
cellular stress responses such as reactive oxygen production, DNA damage and cell cycle arrest.
Cellular stress is often connected to autophagy, and we employed the RAW264.7 macrophage
model to test the hypothesis that AOH induces autophagy. Indeed, AOH treatment led to a massive
increase in acidic vacuoles often observed upon autophagy induction. Moreover, expression of the
autophagy marker LC3 was markedly increased and there was a strong accumulation of
LC3-positive puncta. Increased autophagic activity was verified biochemically by measuring the
degradation rate of long-lived proteins. Furthermore, AOH induced expression of Sestrin2 and
phosphorylation of AMPK as well as reduced phosphorylation of mTOR and S6 kinase, common
mediators of signaling pathways involved in autophagy. Transmission electron microscopy
analyzes of AOH treated cells not only clearly displayed structures associated with autophagy such
as autophagosomes and autolysosomes, but also the appearance of lamellar bodies. Prolonged AOH
treatment resulted in changed cell morphology from round into more star-shaped as well as
increased β-galactosidase activity. This suggests that the cells eventually entered senescence. In
conclusion, our data identify here AOH as an inducer of both autophagy and senescence. These
effects are suggested to be to be linked to AOH-induced DSB (via a reported effect on
topoisomerase activity), resulting in an activation of p53 and the Sestrin2-AMPK-mTOR-S6K
signalling pathway.
3
Abbreviations: AOH (alternariol), AO (acridine orange), AMPK (AMP-activated protein kinase),
ATM (ataxia telangiectasia mutated), Senescence-associate-β-galactosidase (SA-β-Gal), BSA
(bovine serum albumin), ConA (Concanamycin A), Chloroquine (CQ), DMEM (Dulbecco’s
Modified Eagle Medium), DSBs (DNA double strand breaks), EBSS (Earl´s balanced saline
solution), ECACC (European Collection of Cell Cultures), FBS (fetal bovine serum), H2AX (phosphorylated histone H2AX), HDAC (histone deacetylase), LC3 (microtubule-associated
protein 1 light chain 3), mTOR (mammalian target of rapamycin), NAC (N-acetyl-L-cysteine),
PBS (phosphate buffered saline), PFA (paraformaldehyde), ROS (reactive oxygen species), TEM
4 1. Introduction
Mycotoxins are biologically active secondary fungal metabolites. They are often found as contaminants in food and pose a major risk for human and animal health. The immune system is a known target for several mycotoxins (Pestka 2010). The mycotoxin alternariol (AOH) is produced by the Alternaria genus, often found in fruit, vegetables and grain (Ostry 2008; Uhlig et al. 2013), as well as in processed fruit products such as juices and wines (Ackermann et al. 2011). AOH was present in 31% of samples of feed and agricultural commodities in Europe, with concentrations ranging from 0.02 – 7.1 µM (EFSA 2011). The highest levels of AOH are found in legume, nut and oilseed food (EFSA 2011). Currently there are no regulations on Alternaria toxins, including AOH, in food or feed (EFSA 2011). However, the estimated chronic dietary exposure of AOH at 1.9–39 ng/kg body weight per day exceeds the threshold of toxicological concern value of 2.5 ng/kg body weight per day used by the European Food Safety Authority in the risk assessment of AOH (EFSA 2011). This underlines the need for additional toxicity data.
AOH is found to be both genotoxic and mutagenic in several in vitro studies (Brugger et al. 2006; Fehr et al. 2009; Pfeiffer et al. 2007). AOH has been shown to induce both single as well as double stranded DNA breaks (Brugger et al. 2006; Solhaug et al. 2013). AOH also reduces cell proliferation by causing a long lasting cell cycle arrest. This arrest has been suggested to be caused by the DNA damage. In comparison, cell death, mainly necrosis, is only observed at substantially higher concentrations and at later time points (Bensassi et al. 2012; Solhaug et al. 2012). Furthermore, AOH is reported to induce reactive oxygen species (ROS) (Solhaug et al. 2012; Tiessen et al. 2013) resulting in oxidative DNA damage measured by the comet assay (Solhaug et al. 2012). However, addition of the antioxidant ascorbic acid did not reduce the effect of AOH on
5
cell cycle, suggesting that DNA damage caused by the increased ROS levels was not directly linked to the cell cycle arrest (Solhaug et al. 2012). Interestingly, a study done by Fehr and coworkers (Fehr et al. 2009), identified AOH as a topoisomerase II poison, stabilizing the cleavable complex of DNA, thereby forming double stranded breaks (DSBs). The topoisomerase-effect of AOH may thus explain the increased levels of phosphorylated histone H2AX (γ-H2AX), a marker of DSBs (Solhaug et al. 2013), which might specifically contribute to the G2 cell cycle arrest (Solhaug et al.
2013). Furthermore, AOH is also suggested to interfere with the separation of chromosomes through an inhibition of the decatenatory activity of topoisomerase II (Solhaug et al. 2013), possibly leading to the abnormal nuclear morphology that is observer after AOH exposure in RAW264.7 cells (Solhaug et al. 2013).
Mycotoxins have generally not been associated with autophagy. Recently however, both the genotoxic mycotoxin patulin (Guo et al. 2013) and the estrogenic mycotoxin zearalenone (Wang et al. 2014) have been linked with autophagy. Autophagy can be stimulated by multiple forms of cellular stress, including ROS, DNA damage, protein aggregates and damaged organelles (Kroemer et al. 2010). Several forms of autophagy have been described: macroautophagy, chaperone-mediated autophagy and microautophagy. Recent reports suggest that macroautophagy in particular plays an important role in determining the cell fate following an initial insult (Kroemer et al. 2010; Rodriguez-Rocha et al. 2011). Macroautophagy, hereafter referred to as autophagy, is a re-cycling mechanism by which cells through lysosomal degradation re-use amino- and fatty acids. It involves sequestration of cytosolic proteins and organelles within double-membrane structures termed autophagosomes and their subsequent fusion with lysosomes, thereby generating the autolysosome. In the autolysosome, degradation occurs via various lysosomal hydrolases. Importantly, autophagy can be integrated with other cellular stress responses through parallel
6
stimulation, thus being central in the integrated stress response (Kroemer et al. 2010). Several signaling pathways have been implicated in the control of autophagy, including the mammalian target of rapamycin (mTOR) pathway. mTOR activity is controlled by AMP-responsive protein kinase (AMPK), which functions as a sensor for cellular nutrient and energy levels. Whereas mTOR activation stimulate protein synthesis, it’s down regulation is associated with autophagy (Jung et al. 2010). Recently, increased genotoxic stress has been suggested to increase autophagy, possibly through a p53-dependent induced expression of sestrins (Budanov and Karin. 2008). Sestrins have cytoprotective function based on their ability to act as an antioxidant to scavenge excessive ROS (Budanov. 2011). However, independent of its redox-potensial, Sestrin2 induced activation of AMPK is found to reduce mTOR activation and thereby induce autophagy (Hay 2008).
In general, autophagy is considered as a pro-survival mechanism. The relationship between autophagy and the various forms of cell death is still unclear (Marino et al. 2014; Ryter et al. 2014). Autophagy and apoptosis have been reported to be both co-incident and antagonistic depending on experimental context, and to cross-talk between signal transduction elements. Autophagy may also be a part of or modulate the outcome of other regulated forms of cell death such as necroptosis (Asare et al. 2009; Ryter et al. 2014). Senescence is another stress related response that has been suggested as an alternative outcome of autophagic activity (Gewirtz 2013). This is a biological state where cells have lost the ability to divide, but still remain metabolically active (Evan and
d'Adda di Fagagna 2009).
AOH induces ROS production and interferes with topoisomerase activity, which both may result
7
senescence; we hypothesized that this mycotoxin could initiate similar events. Here we have used
the RAW264.7 macrophage cell line, which is a well-known in vitro model to study various effects
of mycotoxins on the immune system (Pan et al. 2014; Pestka 2010; Solhaug et al. 2012). We find
that AOH induces autophagy possibly through the Sestrin2-AMPK-mTOR-S6K pathway.
Interestingly, AOH also induces generation of lamellar bodies, and after prolonged exposure the
cells enter senescence.
2. Materials and Methods
2.1. Reagents and chemicals
Bovine serum albumin (BSA), gels and buffers for Western blotting (NuPAGE system) were all
purchased from Invitrogen (Life Technology, Carlsbad, CA, USA). Lysis buffer and senescence
β-Galactosidase staining kit were from Cell Signaling (Beverly, MA, USA). Dulbecco’s Modified
Eagle Medium (DMEM), Penicillin/Streptomycin, Fetal bovine serum (FBS), and Earl´s balanced
saline solution (EBSS) were from Lonza (Verviers, Belgium). Bio-RAD DC protein assay was
from Bio-Rad Laboratories Inc (Hercules, CA, USA). Super signal west dura chemo luminescence
system was from Pierce, Thermo Scientific (IL, USA). AOH, Concanamycin A (ConA),
Chloroquine (CQ), Hoechst 33342, valine, N-acetyl-L-cysteine (NAC), and Acridine Orange (AO)
were from Sigma-Aldrich (St.Louis, MO, USA). [14C]-valine was from Perkin Elmer, Waltham,
MA, USA.
8
Mouse macrophage cell line RAW264.7 was obtained from the European Collection of Cell
Cultures (ECACC). The cells were cultured and treated as described previously (Solhaug et al.
2013). AOH was dissolved in DMSO and the final concentration of solvent in cell culture was
0.1%. Appropriate controls containing the same amount of solvent were included in each
experiment. The concentrations of AOH used in this study are in the same range that causing DNA
damage as previously published by us (Solhaug et al. 2012) and others (Brugger et al. 2006; Fehr
et al. 2009; Pfeiffer et al. 2007). NAC was dissolved in complete medium complemented with
HEPES (25 mM) and pH adjusted to 7.4. The cells were pre-treated with NAC for 1 h before
exposure to AOH.
2.3. Morphological characterization
The number of normal round shaped cells and star-shaped cells in randomly selected fields was
analysed by light microscopy (Leica DMIL, Solms, Germany) and expressed as percentage of all
cells counted. A minimum of 300 cells were manually counted per incubation. Pictures were taken
by Moticam 1000 (Motic, Hong Kong, China).
2.3. Lysosomal labeling with acridine orange
Lysosomes were analyzed by using the lysosomotropic weak base Acridine Orange (AO,
Sigma-Aldrich), a metachromatic fluorophore that accumulates in lysosomes. The cells were plated on
poly-L-lysine coated coverslips (BD Biosciences), stained with AO, 1 M for 20 min at 37C, and washed twice with PBS. Pictures were taken with a fluorescence microscope (Nikon Eclipse 80i
9
(Melville, NY, USA), equipped with a DS-Ri1 camera). For analysis with flow cytometry (Accuri
C6, BD bioscience, San Jose, CA, USA), the cells were harvested, stained as above and analyzed
by using 488ex:670LPem.
2.4. Measurement of LC3II by flow cytometry
Following treatments, cells were harvested, washed once in PBS, fixed in 1% paraformaldehyde
(PFA) in PBS for 15 min on ice, and post-fixed/permeabilized in 90% ice-cold methanol for at least
48 h at -20oC. For staining with antibody, 5 x 10⁵ cells were washed twice with 0.5% BSA in PBS
and then incubated with LC3B antibody (Cell Signaling; 1:100) in 0.5% BSA/PBS overnight at
4oC. The cells were then rinsed twice in 0.5% BSA/PBS and incubated with secondary antibody
conjugated to Alexa Fluor 647 (Molecular Probe; 1:2000) for 2 h at room temperature in the dark.
The cells were then rinsed twice and analyzed by flow cytometry (Accuri C6) using 633ex:675/25em.
2.5. Western blot
RAW264.7 cells were washed twice in ice cold PBS and placed at -70C until the next day. The cells were then scraped in lysis buffer (Cell Signaling) and centrifuged (6000 x g, 10 min). Protein
concentrations of the supernatants were quantified by using Bio-Rad DC protein assay kit. Western
blotting were then performed as previously described (Solhaug et al. 2012), using the NuPage
Novex system from Invitrogen and the following antibodies: LC3B, p-mTOR (S2448), p-p70S6K
(Thr389), p-AMPK (Thr172), β-Actin Rabbit mAb HRP conjugate and Anti-Rabbit IgG
10
2.6. Long-lived protein degradation assay
Cells were incubated for 30 h with 0.25 μCi/ml L-[14C] valine-supplemented medium, before AOH
(30 µM) or vehicle (DMSO) was added and the incubation continued for 19 h. The cells were
washed and chased for 5 h in fresh medium containing AOH or vehicle and 10 mM non-radioactive
L-valine to allow degradation of short-lived proteins.. Cells were thus incubated with AOH for a
total of 24 h. Next, the cells were washed and chased for 2 h in complete medium without AOH in
the absence or presence of the autolysosome inhibitor Concanamycin A (ConA). Incubation in
Earl’s balanced salt solution (EBSS) for 2 h served as a positive control. Cellular protein was
precipitated with TCA, and percent degradation was assessed as the acid-soluble radioactivity
divided by the total radioactivity. Valine was used in the LLPD-studies as its presence does not
affect autophagy in itself.
2.7. Immunofluorescence
For staining of endogenous LC3, cells were grown on glass coverslips, treated with AOH (30 M) or vehicle for 24 h, fixed in 4% PFA, and incubated with an antibody against LC3 (#PM036, MBL),
followed by Alexa488-labeled donkey anti-rabbit IgG (Jackson ImmunoResearch). The cells were
stained with Hoechst 33342 (2 µg/ml in PBS) for visualization of nuclei. For high-throughput
analysis pictures were taken using the automated Olympus ScanR system (Tokyo, Japan) with an
UPLSAPO 40×/0.95 objective. 64 images were automatically taken from each coverslip with
identical settings and below pixel saturation. Quantification of LC3 spots was performed by the
11
used for identification of individual cells, and discrete LC3 spots were identified in the GFP
channel upon manual setting of threshold values for gating of proper spot size, shape and intensity.
The software then determined the number of spots and the total intensity of the spot pixels per cell
using the same threshold values for all samples. LC3 spots were quantified from 400-2,000 cells
per condition in each experiment.
2.8. Transmission electron microscopy (TEM)
Following drug exposure the cells were rinsed with 0.15 M Na cacodylate buffer and fixed by drop
wise addition of glutaraldehyde (2.5%) for 1 h. After fixation, the specimens were rinsed several
times with 0.15 M Na cacodylate buffer and post fixed with 1.5% osmium tetroxide for 1 h. After
further rinsing with cacodylate buffer, the samples were dehydrated through a series of graded
ethanol from 70 to 100%. The specimens were infiltrated in a mixture of acetone-Eponate (50/50)
for 3 h, then in pure Eponate for 16 h. Finally, the specimens were embedded in DMP30-Eponate
for 24 h at 60°C. Sections (0.5 µm) were cut on a LEICA UC7 microtome and stained with toluidine
blue. Ultra-thin sections (90 nm) were obtained, collected onto copper grids and counterstained
with 4% uranyl acetate then with lead citrate. Examination was performed with JEOL 1400 electron
microscope (Tokyo, Japan) operated at 120 kV.
2.9. Viability
For measurement of necrotic/late apoptotic cells, the cells were plated on UpCell plates (Nunc,
temperature-12
responsive and allows cells to detach without the use of cell scrapers at temperatures below 32°C.
For harvesting, the dishes were put on ice for 10 min to allow detachment. Since necrotic and late
apoptotic cells lose membrane integrity they cannot exclude PI and PI-staining is thereby detectable
using flow cytometry. Briefly, cells were plated on UpCell dishes, after 24 h the cells were
pretreated with the autophagy inhibitor for 1 h before AOH exposure for 24 h. After exposure the
cells were harvested as described above. Cells were stained with PI (5 g/ml) by adding the dye directly to the medium, incubated for 10 min in the dark at ambient temperature and analyzed
immediately by flow cytometry (Accuri C6). Debris and doublets were excluded by gating and
10 000 cells were analyzed.
2.10. Senescence β-galactosidase staining
β-galactosidase activity is present only in senescent cells. RAW264.7 cells were fixed and stained according to the protocol provided by the manufacturer (Cell Signaling). The number of
β-galactosidase positive cells in randomly selected fields was analysed by light microscopy (Leica
DMIL, Solms, Germany) and expressed as percentage of all cells counted. A minimum of 300 cells
were counted per incubation.Pictures were taken by Moticam 1000 (Motic, Hong Kong, China).
2.11. Statistical analysis
The data analyzes were performed using Sigma Plot version 12.0. Statistical significance (p < 0.05)
was assessed using 1-way-ANOVA, followed by Dunnett’s post-test between control and treated samples or Tukey’s post-test between two treated groups.
13 3. Results
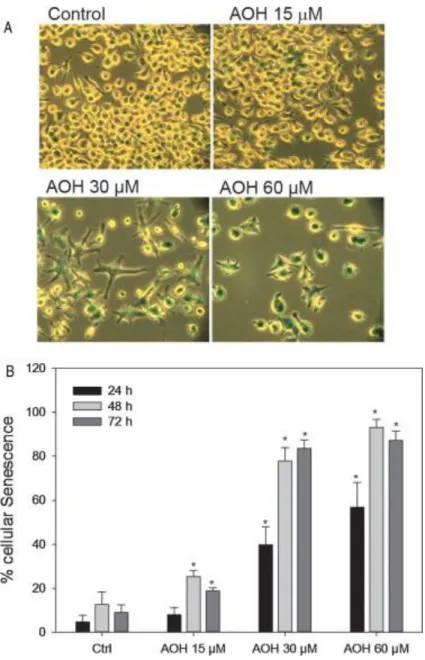
3.1. AOH induces morphological changes
To assess the effect of AOH on the morphology of RAW264.7 cells, the cells were treated with
AOH (30 µM) for 18, 24 or 48 h before investigation under light microscopy. Fig. 1A shows that
AOH induces changes in the cell morphology already after 18 h exposure. The cells changed from
small and round-shaped cells into big star-shaped cells with an extensive vacuolization. After 24 h
with AOH (30 µM) exposure, the changes were very distinct and about 40% of the cells had a
star-shaped morphology (Fig. 1B). In accordance with our previous findings (Solhaug et al. 2012;
Solhaug et al. 2013), little or no cell death was observed (Fig. 5).
3.2. AOH induces autophagy
To test if the increased vacuolization could be due to autophagy, we stained the AOH treated cells
with Acridine Orange (AO). AO accumulates in acidic vacuoles like lysosomes and autolysosomes.
Analysis done by fluorescence microscopy revealed that AOH treatment increased the numbers as
well as the size of acidic vacuoles (Fig. 2A). The increased level of AO upon AOH treatment was
further analyzed and quantified by flow cytometry. Significant accumulation of AO was found
after 24 and 48 h, starting at 30 µM AOH (Fig. 2B) suggesting increased autophagy. Next we
wanted to test if AOH-induced ROS production was responsible for the accumulation of acidic
vacuoles. Addition of the ROS scavenger N-acetyl-L-cysteine (NAC, 5-20 mM) did not change the
14
accumulation of acidic vacuoles is not directly mediated by ROS, or indirectly through oxidative
DNA damage.
LC3II is generated by conjugation of LC3 to phosphatidylethanolamine in the autophagosome
membrane upon autophagy activation, and is considered as an indicator of autophagosome number
(Klionsky et al. 2012; Mizushima et al. 2010). To investigate if the increased level of acidic
vacuoles was due to enhanced initiation of autophagy, we determined the expression level of LC3II.
Indeed, treatment with AOH enhanced the protein levels of LC3II, as determined by both flow
cytometry (Fig. 3A) and western blotting (Fig. 3B). In further agreement with AOH-induced
autophagy, AOH significantly increased the number and intensity of autophagosomes, as indicated
by the typical punctuate pattern observed upon immunofluorescence staining of endogenous LC3
(Fig. 3C-E).
Enhanced levels of autophagosomes often reflect increased autophagic activity, but could also be
due to reduced autolysosomal turnover. To distinguish between these two possibilities we next
assessed the autophagic flux by measuring the degradation of long-lived proteins, which are
considered to be bona fide autophagy substrates (Klionsky et al. 2012). In support of an increased
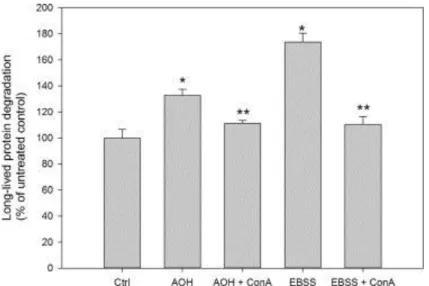
autophagic activity, AOH significantly enhanced the degradation of long-lived proteins (Fig. 4).
The rate of degradation was increased to ~50% of the level induced by amino acid starvation, which
is a potent inducer of autophagy often used as a positive control. AOH-induced protein degradation
15
(ConA) (Huss et al. 2002), further confirming enhanced protein degradation via AOH-induced
autophagy (Fig. 4).
Next we wanted to examine if the induced autophagy protected against AOH-induced cellular
stress, as cell death was barely detectable after AOH exposure (Solhaug et al. 2012). AOH was
incubated together with the well-known autophagy inhibitor, chloroquine (CQ) (Klionsky et al.
2012; Poole and Ohkuma. 1981) and cytotoxicity was detected by the uptake of PI and quantified
by flow cytometry. In accordance with previous findings 30 µM AOH induced little or no
cytotoxicity (Control: 1.8% ± 0.54 vs AOH: 8.0% ± 5.6), whereas slight cytotoxic effects could be
observed after exposure to CQ alone (Fig. 5). Most interestingly, CQ markedly potentiated the
cytotoxic effects of AOH compared to the effects of these two compounds given separately. This
finding suggests that AOH-induced autophagy acts as a pro-survival response.
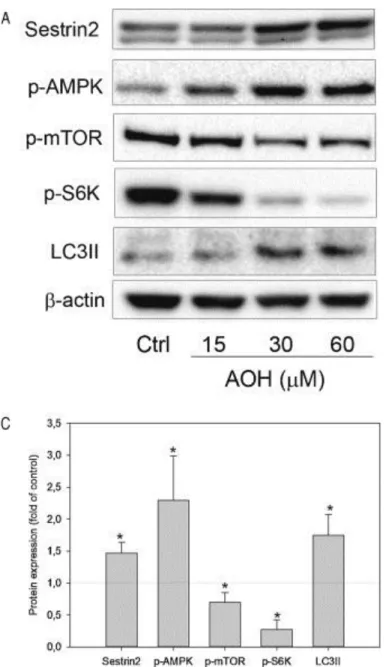
To elucidate the possible mechanisms underlying AOH-induced autophagy, we examined the effect
of AOH on the mTOR signaling pathway, a well-known negative regulator of autophagy (Jung et
al. 2010; Rodriguez-Rocha et al. 2011). Indeed, the phosphorylation of mTOR as well as its
substrate S6K was decreased in parallel with the AOH-induced increase in LC3II (Fig. 6).
Furthermore, AOH increased the expression of Sestrin2 simultaneously with increased
phosphorylation of AMPK, an established negative regulator of mTOR (Jung et al. 2010). Taken
together these data suggest that AOH induces autophagic activity that may be induced by the
16
3.3 AOH induces changes in the cellular ultrastructure associated with autophagy and changed lipid metabolism.
As revealed by phase contrast microscopy, AOH induced severe cellular retraction and appearance
of vacuoles in the cytoplasm together with changed morphology (Fig. 1). A deeper insight into the
subcellular alterations observed in AOH-treated cells was acquired by TEM. Control cells showed
a normal ultrastructure with uncondensed chromatin and well preserved organelles (Fig. 7A). When
treated with AOH (30 µM, 24 h), the most striking ultrastructure modification was an extensive
vacuolization of the cytoplasm (Fig. 7 B). When treated cultures were observed in detail,
autophagosomes and autolysosomes, common structures associated with autophagy were observed
(Fig. 7 C-F). Interestingly, lamellar bodies, associated with changes in the lipid metabolism and
phospholipidosis, were also observed in AOH-treated cells (Fig. 7 C-E).
3.4. AOH induces senescence
Since AOH-treated cells are arrested in G2 (Solhaug et al. 2013) with a flattened and enlarged
morphology (Fig. 1), enhanced autophagy (Fig. 3), but apparently without increased cell death
(Solhaug et al. 2012), we lastly wanted to explore if AOH induced senescence. Senescence associated β-galactosidase (SA-β-Gal) is commonly used as a senescence biomarker (Dimri et al. 1995; Rodier and Campisi 2011). As can be seen in Fig. 8, AOH increased the level of SA-β-Gal
in a time- and concentration-dependent manner, suggesting that AOH induced senescence.
Interestingly, approximately 80% of the cells were positive for the senescence marker after
17 4. Discussion
Our previous studies (Solhaug et al. 2013; Solhaug et al. 2012) revealed that exposure of
RAW264.7 macrophages to the mycotoxin AOH increased the production of ROS and the level of
DNA damage. Somewhat surprisingly, this DNA damage did not result in any increased cell death,
neither necrosis nor apoptosis. However, the AOH-exposure resulted in an almost complete G2 cell
cycle arrest with high sustained levels of cyclin B1, or possibly in a kind of G1 arrest as most of
the arrested cells had diploid or abnormal partly divided nuclei. The AOH-induced cell cycle arrest
was found to be independent of ROS production. This indicates that the ability of AOH to interfere
with topoisomerase activity thereby causing DSBs (Fehr et al. 2009) is of more importance for the
cell cycle arrest. In the present study, we show that this AOH-induced cell cycle arrest is
accompanied by increased autophagy and senescence. Such effects could have implications for
immune cells thereby modulating the immune responses.
A number of chemicals have been reported to induce autophagy. However, several of the earlier
studies suffer from inadequate methodology. Indeed, recent reviews on autophagy focus on the
need for a more mechanistic approach when reporting effects on this process (Klionsky et al. 2012).
Here we have employed a wide spectrum of well-known autophagy methods to show that AOH
induces autophagic activity in RAW264.7 cells. Initially, AOH was found to increase the number
and expand the size of acidic vacuoles. Our more detailed examination of the induced process
suggested that the increased vacuolization was due to increased initiation of autophagy as judged
18
support of a real increase in the autophagic activity, AOH was shown to enhance the
lysosome-dependent degradation of long-lived proteins.
The first cellular interaction explaining how autophagy is initiated is for most chemicals not known.
The reason for this is that specific chemicals most often interact with many different cellular
molecules and will then trigger various types of damage. Such interactions induces several stress
responses including oxidative stress, DNA damage response (DSBs) and ER stress, which are
known to induce of autophagy (Deegan et al. 2013; Niforou et al. 2014; Rodriguez-Rocha et al.
2011). However, similar cellular signaling pathway is also often involved in other cellular
responses such as inflammation and apoptosis (Kroemer et al. 2010). The molecular mechanisms
connecting these initial events and the final cellular responses are just beginning to be understood.
It is well known that p53 regulates several signaling pathways in response to certain type of cellular
stress, and involves cell cycle arrest, apoptosis as well as metabolic changes (Vousden and Prives
2009). It has been suggested that both genotoxic and oxidative stress can stimulate autophagy
through p53-dependent transcription of Sestrin 1/2 (Budanov and Karin 2008; Maiuri et al. 2009;
Rodriguez-Rocha et al. 2011). Downstream of Sestrin2 the AMPK is activated and mTOR is
suppressed (Budanov and Karin 2008), thereby releasing the negative regulation on autophagy
(Jung et al. 2010). Recently, we found that AOH induced ROS and DNA damage followed by p53
activation and a p53-dependent expression of Sestrin2 (Solhaug et al. 2012). Interestingly, the ROS
scavenger NAC was found to only partially reduce the AOH-induced expression of Sestrin2
19
type of DNA damage, more specifically the interference with topoisomerase activity. Here, we find
that NAC do not reduce the AOH-induced accumulation of acidic vacuoles. It seems therefore that
the ability of AOH to interfere with topoisomerase activity, rather than its effect on ROS
production, is a more likely explanation of the increased autophagy. Further linking this DNA
damage and p53 response to autophagy, we find that AOH in addition to increase the expression
of Sestrin2 also enhanced p-AMPK and decreased the activation of mTOR and its substrate S6K.
As autophagy is found to be induced via the p53-Sestrin2-AMPK signaling pathway in several
recent studies (Hay 2008; Wang et al. 2011), a similar link between these pathways and the
observed AOH-induced autophagy seems reasonable. However, there are other DNA-damage
initiated signaling pathways than p53-Sestrin2-AMPK-mTOR-S6K that also are linked to
autophagy (Cam et al. 2014), which cannot be ruled out at this stage.
Autophagy can be induced as a response to various types of DNA damage (Rodriguez-Rocha et al.
2011). Most interestingly, also other DNA damaging agents that interfere with topoisomerase
activity (e.g. camptothecin and etoposide) are found to initiate cell cycle arrest, autophagy (Abedin
et al. 2007; Katayama et al. 2007) and senescence (Brel et al. 2011; Gewirtz et al. 2008; Zhao et
al. 2010). Besides a role of p53, is has been suggested that the sequestration or degradation of
mitotic proteins after DNA damage (in particular DSB) by autophagy might be one way by which
cells can maintain a robust checkpoint arrest in the M-phase (Dotiwala et al. 2012). However, this
is likely not the case with regard to AOH as the AOH-induced cell cycle arrest is rather in G2/M
transition or possibly secondary in G1 phase than in the M-phase (Solhaug et al, 2013).
Interestingly, another novel link between DSB and autophagy has been suggested (Robert et al.
20
then together with the damaged DNA transported out of nuclei and degraded by autophagy. This
probably allows the DNA repair machinery to be sequestered away from actively replicating DNA,
which contains naturally nicks and breaks. Mistakenly “repairing” replication associated breaks
and nicks could result in potentially harmful DNA damage. Both histone deacetylase (HDAC)
inhibitors and rapamycin are found trigger autophagy, which then conteracts DNA repair (Robert
et al. 2011). Interestingly, HDAC is also found to interact directely with DNA topoisomerase II
(Tsai et al. 2000). This prosess might therefore be relevant for AOH induced DNA damage and
autophagy as well.
ER stress is another cellular process often associated with autophagy (Deegan et al. 2013).
Disturbances in the ER`s homeostatic environment disrupts the protein folding machinery and
results in an accumulating of unfolded proteins in the ER lumen, thus activating the unfolding
protein response (Deegan et al. 2013). Autophagy is therefore often induced and may help to digest
misfolded proteins (Appenzeller-Herzog and Hall 2012). The mechanistic links between ER stress
and autophagy are currently not well understood, but are suggested to involve inhibition of mTOR
via Sestrin2 activation (Bruning et al. 2013). It has been suggested that the double evolvement of
autophagosomes with membranes from the ER might explain the presence of lamellar bodies if
multiple cycles of autophagy occur (Morissette et al. 2008). Thus, the AOH increased autophagic
activity may be linked to the enhanced level of lamellar bodies and induced cellular senescence.
An accumulation of phospholipids in lysosomes and the appearance of lamellar bodies are also
found to be commonly induced by drugs that alter the lipid metabolism (Anderson and Borlak
21
2010; Morissette et al. 2009; Peropadre et al. 2011; Schmitz and Grandl 2009). However, judged
by the TEM analyzes; AOH did not cause a marked increase in lipid vacuoles in RAW264.7 cells.
Senescence is known to be induced by several topoisomerase poisons (Gewirtz et al. 2008). Here
we report that also prolonged exposure of AOH results in cellular senescence. Together with increased β-galactosidase activity, cellular senescence is generally accompanied by morphological changes, which may be quite striking (Kuilman et al. 2010). The cells are described as large, flat
and more irregularly shaped. This is very similar to the appearance of the RAW264.7 cells observed
after exposure to AOH. Furthermore, we found that the autophagy inhibitor CQ potentiated AOH
induced cell death. This suggests that AOH induced autophagy as well as senescence can be
considered as pro-survival mechanisms. In fact autophagy and senescence share a number of
characteristics that collaterally protects the cells from toxicity of external stress. Interestingly,
autophagy has also been suggested as an effector mechanism of senescence. This may be important
for the rapid protein remodelling required for making an efficient transition from proliferative to a
senescent state (Young et al. 2009). However, it is also found that an inhibition of autophagy is
permissive for senescence (Gewirtz 2013). This type of relationship is logical if both autophagy
and senescence act in a cytoprotective manner, as senescence then might serve as a backup response
in the event that autophagy fails to provide effective protection to the injured cells. Interestingly,
Psedolaric Acid B (an anti-tubulin drug), induce mitotic catastrophe, G2/M cell cycle arrest
followed by mitotic slippage into G1 followed by autophagy-dependent senescence (Yu et al.
2013). In our previous study (Solhaug et al. 2013) we also considered that AOH induced mitotic
slippage.After prolonged AOH exposure, the cells were arrested in G2 (4N) with high levels of
22
cells had gone through karyokinesis via mitotic slippage ending up as G1 like cells. These findings
propose that the same triggering mechanisms causing sustained cell cycle arrest and autophagy
following AOH treatment also might be linked to senescence. p21 is considered to be a critical
component in stress-induced senescence (Darzynkiewicz et al. 2014; Gewirtz et al. 2008), and is
found to be necessary for Adriamycin/topoisomerase II inhibitor-induced autophagy and
senescence in MCF-7 cells (Goehe et al. 2012). Consistent with an activation of this pathway, we
also found a robust accumulation of p21 after AOH exposure (Solhaug et al. 2012), in the same
timeframe as the occurrence of abnormal nuclear morphology and senescence. Also, AOH-induced
autophagy and cell cycle arrest seems to appear earlier than the induction of senescence, further
support the notion that senescence is a consequence of DNA damage, cell cycle arrest and
autophagy.
5. Conclusion
We found that the mycotoxin AOH induces autophagy in RAW264.7 macrophages, possibly
through the Sestrin2-AMPK-mTOR-S6K pathway. The induction of autophagy is most probably
associated to AOH-induced DNA damage, due to association with topoisomerase activity rather
than the production of ROS. After prolonged AOH exposure the cells entered senescence. These
in vitro experiments suggest possible modulator effects of AOH on immune cells, and they should
23
Funding: The work was supported by Research Council of Norway through the project: Effects of
realistic mixtures of mould and mycotoxins on the immune system and assessment of human
exposure [Grant no: 213087].
Conflict of interest statement: The authors declare that there are no conflicts of interest.
Acknowledgements: We wish to thank the Microscopy Rennes Imaging Center of SFR BIOSIT,
Université Rennes 1, and Agnès Burel and Marie-Thérèse Lavault for their technical assistance in
24 References:
Abedin, M.J., Wang, D., McDonnell, M.A., Lehmann, U. and Kelekar, A. 2007. Autophagy
delays apoptotic death in breast cancer cells following DNA damage. Cell Death Differ. 14,
500-510.
Ackermann, Y., Curtui, V., Dietrich, R., Gross, M., Latif, H., Martlbauer, E. and Usleber, E.
2011. Widespread occurrence of low levels of alternariol in apple and tomato products, as
determined by comparative immunochemical assessment using monoclonal and polyclonal
antibodies. J Agric Food Chem. 59, 6360-6368.
Anderson, N. and Borlak, J. 2006. Drug-induced phospholipidosis. FEBS Lett. 580, 5533-5540.
Appenzeller-Herzog, C. and Hall, M.N. 2012. Bidirectional crosstalk between endoplasmic
reticulum stress and mTOR signaling. Trends Cell Biol. 22, 274-282.
Asare, N., Lagadic-Gossmann, D. and Holme, J.A. 2009. 3-nitrofluoranthene (3-NF)-induced
apoptosis and programmed necrosis. Autophagy. 5, 751-752.
Bensassi, F., Gallerne, C., Sharaf El Dein, O., Hajlaoui, M.R., Bacha, H. and Lemaire, C. 2012.
Cell death induced by the Alternaria mycotoxin Alternariol. Toxicol In Vitro. 26, 915-923.
Brel, V., Annereau, J.P., Vispe, S., Kruczynski, A., Bailly, C. and Guilbaud, N. 2011.
Cytotoxicity and cell death mechanisms induced by the polyamine-vectorized anti-cancer
drug F14512 targeting topoisomerase II. Biochem Pharmacol. 82, 1843-1852.
Brugger, E.M., Wagner, J.r., Schumacher, D.M., Koch, K., Podlech, J., Metzler, M. and
Lehmann, L. 2006. Mutagenicity of the mycotoxin alternariol in cultured mammalian cells.
Toxicol Lett. 164, 221-230.
Bruning, A., Rahmeh, M. and Friese, K. 2013. Nelfinavir and bortezomib inhibit mTOR activity
25
Budanov, A.V. 2011. Stress-responsive sestrins link p53 with redox regulation and mammalian
target of rapamycin signaling. Antioxid Redox Signal. 15, 1679-90.
Budanov, A.V. and Karin, M. 2008. p53 target genes sestrin1 and sestrin2 connect genotoxic
stress and mTOR signaling. Cell 134, 451-460.
Cam, M., Bid, H.K., Xiao, L., Zambetti, G.P., Houghton, P.J. and Cam, H. 2014. p53/TAp63 and
AKT regulate mammalian target of rapamycin complex 1 (mTORC1) signaling through
two independent parallel pathways in the presence of DNA damage. J Biol Chem. 289,
4083-4094.
Chen, Y., Azad, M.B. and Gibson, S.B. 2009. Superoxide is the major reactive oxygen species
regulating autophagy. Cell Death Differ. 16, 1040-1052.
Darzynkiewicz, Z., Zhao, H., Halicka, H.D., Li, J., Lee, Y.S., Hsieh, T.C. and Wu, J.M. 2014. In
search of antiaging modalities: Evaluation of mTOR- and ROS/DNA damage-signaling by
cytometry. Cytometry A 85, 386-399.
Deegan, S., Saveljeva, S., Gorman, A.M. and Samali, A. 2013. Stress-induced self-cannibalism:
on the regulation of autophagy by endoplasmic reticulum stress. Cell Mol Life Sci. 70,
2425-2441.
Dimri, G.P., Lee, X., Basile, G., Acosta, M., Scott, G., Roskelley, C., Medrano, E.E., Linskens,
M., Rubelj, I., Pereira-Smith, O. and et al. 1995. A biomarker that identifies senescent
human cells in culture and in aging skin in vivo. Proc Natl Acad Sci USA. 92, 9363-9367.
Dotiwala, F., Eapen, V.V., Harrison, J.C., Arbel-Eden, A., Ranade, V., Yoshida, S. and Haber,
J.E. 2013. DNA damage checkpoint triggers autophagy to regulate the initiation of
26
EFSA, European Food Safety Authority. 2011. Scientific Opinion on the risks for animal and
public health related to the presence of Alternaria toxins in feed anf food. EFSA Journal 9,
2407.
Evan, G.I. and d'Adda di Fagagna, F. 2009. Cellular senescence: hot or what? Curr Opin Genet
Dev. 19, 25-31.
Fehr, M., Pahlke, G., Fritz, J., Christensen, M.O., Boege, F., Altemoller, M., Podlech, J. and
Marko, D. 2009. Alternariol acts as a topoisomerase poison, preferentially affecting the
IIalpha isoform. Mol Nutr Food Res 53, 441-451.
Gewirtz, D.A. 2013. Autophagy and senescence: a partnership in search of definition. Autophagy
9, 808-812.
Gewirtz, D.A., Holt, S.E. and Elmore, L.W. 2008. Accelerated senescence: an emerging role in
tumor cell response to chemotherapy and radiation. Biochem Pharmacol. 76, 947-957.
Goehe, R.W., Di, X., Sharma, K., Bristol, M.L., Henderson, S.C., Valerie, K., Rodier, F.,
Davalos, A.R. and Gewirtz, D.A. 2012. The autophagy-senescence connection in
chemotherapy: must tumor cells (self) eat before they sleep? J Pharmacol Exp Ther. 343,
763-778.
Guo, X., Dong, Y., Yin, S., Zhao, C., Huo, Y., Fan, L. and Hu, H. 2013. Patulin induces
pro-survival functions via autophagy inhibition and p62 accumulation. Cell Death Dis. 4, e822.
Hay, N. 2008. p53 strikes mTORC1 by employing sestrins. Cell Metab. 8, 184-185.
Huss, M., Ingenhorst, G., Konig, S., Gassel, M., Drose, S., Zeeck, A., Altendorf, K. and
Wieczorek, H. 2002. Concanamycin A, the specific inhibitor of V-ATPases, binds to the
V(o) subunit c. J Biol Chem. 277, 40544-40548.
Jung, C.H., Ro, S.H., Cao, J., Otto, N.M. and Kim, D.H. 2010. mTOR regulation of autophagy.
27
Katayama, M., Kawaguchi, T., Berger, M.S. and Pieper, R.O. 2007. DNA damaging
agent-induced autophagy produces a cytoprotective adenosine triphosphate surge in malignant
glioma cells. Cell Death Differ. 14, 548-558.
Klionsky, D.J., Abdalla, F.C., Abeliovich, H., Abraham, R.T., Acevedo-Arozena, A., Adeli, K.,
Agholme, L., Agnello, M., Agostinis, P., Aguirre-Ghiso, J.A. and et al. 2012. Guidelines
for the use and interpretation of assays for monitoring autophagy. Autophagy. 8, 445-544.
Kovsan, J., Bashan, N., Greenberg, A.S. and Rudich, A. 2010. Potential role of autophagy in
modulation of lipid metabolism. Am J Physiol Endocrinol Metab. 298, E1-7.
Kroemer, G., Marino, G. and Levine, B. 2010. Autophagy and the integrated stress response. Mol
Cell. 40, 280-293.
Kuilman, T., Michaloglou, C., Mooi, W.J. and Peeper, D.S. 2010. The essence of senescence.
Genes and Dev. 24, 2463-79.
Maiuri, M.C., Malik, S.A., Morselli, E., Kepp, O., Criollo, A., Mouchel, P.L., Carnuccio, R. and
Kroemer, G. 2009. Stimulation of autophagy by the p53 target gene Sestrin2. Cell Cycle 8,
1571-1576.
Marino, G., Niso-Santano, M., Baehrecke, E.H. and Kroemer, G. 2014. Self-consumption: the
interplay of autophagy and apoptosis. Nat Rev Mol Cell Biol 15, 81-94.
Mizushima, N., Yoshimori, T. and Levine, B. 2010. Methods in mammalian autophagy research.
Cell 140, 313-326.
Morissette, G., Ammoury, A., Rusu, D., Marguery, M.C., Lodge, R., Poubelle, P.E. and Marceau,
F. 2009. Intracellular sequestration of amiodarone: role of vacuolar ATPase and
macroautophagic transition of the resulting vacuolar cytopathology. Brit J Pharmacol. 157,
28
Morissette, G., Lodge, R. and Marceau, F. 2008. Intense pseudotransport of a cationic drug
mediated by vacuolar ATPase: procainamide-induced autophagic cell vacuolization.
Toxicol Appl Pharmacol. 228, 364-377.
Niforou, K., Cheimonidou, C. and Trougakos., I.P.2014. Molecular chaperones and proteostasis
regulation during redox imbalance. Redox Biol. 30, 323-32.
Ostry, V. 2008. Alternaria mycotoxins: an overview of chemical characterization, producers,
toxicity, analysis and occurrence in foodstuffs. World Mycotoxin Journal. 1, 175-188.
Pan, X., Whitten, D.A., Wilkerson, C.G. and Pestka, J.J. 2014. Dynamic changes in
ribosome-associated proteome and phosphoproteome during deoxynivalenol-induced translation
inhibition and ribotoxic stress. Toxicol Sci. 138, 217-233.
Peropadre, A., Fernandez Freire, P., Herrero, O., Perez Martin, J.M. and Hazen, M.J. 2011.
Cellular responses associated with dibucaine-induced phospholipidosis. Chem Res Toxicol.
24, 185-192.
Pestka, J.J. 2010. Deoxynivalenol: mechanisms of action, human exposure, and toxicological
relevance. Arch Toxicol. 84, 663-679.
Pfeiffer, E., Eschbach, S. and Metzler, M. 2007. Alternaria toxins: DNA strand-breaking activity
in mammalian cells in vitro. Mycotoxin Res. 23, 152-157.
Poole, E. and Ohkuma, S. 1981. Effect of weak bases on the intralysosomal pH in mouse
peritoneal macrophages. J Cell Biol. 90, 665-9.
Robert, T., Vanoli, F., Chiolo, I., Shubassi, G., Bernstein, K.A., Rothstein, R., Botrugno, O.A.,
Parazzoli, D., Oldani, A., Minucci, S. and Foiani, M. 2011. HDACs link the DNA damage
response, processing of double-strand breaks and autophagy. Nature 471, 74-79.
29
Rodriguez-Rocha, H., Garcia-Garcia, A., Panayiotidis, M.I. and Franco, R. 2011. DNA damage
and autophagy. Mutat Res. 711, 158-166.
Ryter, S.W., Mizumura, K. and Choi, A.M. 2014. The Impact of Autophagy on Cell Death
Modalities. Int J Cell Biol. 502676.
Schmitz, G. and Grandl, M. 2009. Endolysosomal phospholipidosis and cytosolic lipid droplet
storage and release in macrophages. Biochim Biophys Acta. 1791, 524-539.
Shubassi, G., Robert, T., Vanoli, F., Minucci, S. and Foiani, M. 2012. Acetylation: a novel link
between double-strand break repair and autophagy. Cancer Res. 72, 1332-1335.
Solhaug, A., Holme, J.A., Haglund, K., Dendele, B., Sergent, O., Pestka, J., Lagadic-Gossmann,
D. and Eriksen, G.S. 2013. Alternariol induces abnormal nuclear morphology and cell cycle
arrest in murine RAW 264.7 macrophages. Toxicol Lett. 219, 8-17.
Solhaug, A., Vines, L.L., Ivanova, L., Spilsberg, B., Holme, J.A., Pestka, J., Collins, A. and
Eriksen, G.S. 2012. Mechanisms involved in alternariol-induced cell cycle arrest. Mutation
Res. 738-739, 1-11.
Tiessen, C., Fehr, M., Schwarz, C., Baechler, S., Domnanich, K., Bottler, U., Pahlke, G. and
Marko, D. 2013. Modulation of the cellular redox status by the Alternaria toxins alternariol
and alternariol monomethyl ether. Toxicol Lett. 216, 23-30.
Tsai, Shih-Chang., Valkov, Nikola., Yang Wen-Ming., Gump, Jana., Sullivan, Daniel. and Seto,
Edward. 2000. Histone deacetylase interact directely with DNA topoisomerase II. Nat.
Genet. 26, 349-353.
Uhlig, S., Eriksen, G.S., Hofgaard, I.S., Krska, R., Beltran, E. and Sulyok, M. 2013. Faces of a
changing climate: semi-quantitative multi-mycotoxin analysis of grain grown in
30
Vousden, K.H. and Prives, C. 2009. Blinded by the Light: The Growing Complexity of p53. Cell.
137, 413-431.
Wang, N., Pan, W., Zhu, M., Zhang, M., Hao, X., Liang, G. and Feng, Y. 2011. Fangchinoline
induces autophagic cell death via p53/sestrin2/AMPK signalling in human hepatocellular
carcinoma cells. Br J Pharmacol. 164, 731-742.
Wang, Y., Zheng, W., Bian, X., Yuan, Y., Gu, J., Liu, X., Liu, Z. and Bian, J. 2014. Zearalenone
induces apoptosis and cytoprotective autophagy in primary Leydig cells. Toxicol Lett. 226,
182-91.
Young, A.R., Narita, M., Ferreira, M., Kirschner, K., Sadaie, M., Darot, J.F., Tavare, S.,
Arakawa, S., Shimizu, S., Watt, F.M. and Narita, M. 2009. Autophagy mediates the mitotic
senescence transition. Genes Dev. 23, 798-803.
Yu, J., Liu, C., Zheng, G., Zhang, L.Y., Yan, M., Zhang, W., Meng, X. and Yu, X. 2013.
Pseudolaric acid B induced cell cycle arrest, autophagy and senescence in murine
fibrosarcoma l929 cell. Int J Med Sci. 10, 707-718.
Zhao, H., Halicka, H.D., Traganos, F., Jorgensen, E. and Darzynkiewicz, Z. 2010. New
biomarkers probing depth of cell senescence assessed by laser scanning cytometry.
31 Figure legends:
Fig. 1: AOH induces morphological changes in RAW264.7 macrophages. Cells were treated
with AOH (30 µM) for 18 – 48 h and analyzed by light microscopy (A). Cells were treated with
32
counted per condition. The results are representative of 3 independent experiments. Results
represent mean ± SD of 3 replicates. * indicates significantly different from control
34
Fig 2: AOH increases the level of acidic vacuoles. Cells were treated with AOH (30 µM) for 48
h, stained with AO and analyzed with fluorescence microscopy (A). Cells were treated with AOH
at concentrations and time points as indicated, stained with AO and analyzed by flow cytometry.
Results represent mean ± SD of 3 independent experiments. * indicates significantly different from
control (1-way-ANOVA with Dunnett’s post-test) (B). Cells were treated with AOH (30 µM) with
or without NAC (5-20 mM) for 24 h, stained with AO and analyzed by flow cytometry. Results
represent mean ± SD of 5 independent experiments. * indicates significantly different from control
(1-way-ANOVA with Dunnett’s post-test). AOH treated cells were not significant different from
35
Fig. 3: AOH increases the expression of LC3II and generation of LC3 spots. Cells were treated
with AOH (30 µM) at time points as indicated and analyzed for LC3II expression by flow
cytometry (A) or western blotting (B). The results are representative of 2 independent experiments.
The numbers quoted above the blot were obtained following densitometric analysis of the bands.
Cells were treated with AOH (30 µM) for 24 h, and then fixed and prepared for
immunofluorescence staining of endogenous LC3 (green) and Hoechst staining of nuclei (blue).
Representative images are shown. Scale bar 10 µm. (C). The mean number of LC3 spots per cell
(D) and the mean intensity of LC3 spot pixels per cell (E) were quantified from 400-2000 cells per
condition per experiment. The results represent mean ± SD of 3 independent experiments. *
36
Fig. 4: AOH increases the degradation of long-lived proteins. Cells were treated with AOH (30
µM) for 24 h in the presence or absence of ConA (50 nM) for the final 2 h and analyzed for
long-lived protein degradation. Incubation in EBSS for 2 h in the presence or absence of ConA (50 nM)
served as a positive control. The data represent mean ± SD of 3 independent experiments. *
indicates significantly different from control (1-way-ANOVA with Dunnett’s post-test). **
indicates significantly different from AOH or EBSS, respectively (1-way-ANOVA with Tukey’s
37
Fig. 5: Cytotoxicity induced by combined treatment with AOH and the autophagy inhibitor chloroquine. Cells were treated with AOH (30 µM) for 24 h in the presence or absence of CQ
(12.5 µM). Light microscopy pictures of the treated cells (A) and cell viability measured by flow
cytometric analysis of PI stained cells (B). The data represent mean ± SD of 6 independent
38
different from control (1-way-ANOVA with Dunnett’s post-test). ** indicates significantly
39
Fig. 6: AOH induces protein expression associated with autophagy. Cells were treated with
AOH (15-60 µM) for 24 h and analyzed for Sestrin2, p-AMPK (Thr172), p-mTOR (S2448), p-S6K
(Thr389), LC3II and β-actin by Western blot (A). The results for AOH 30 µM are quantified and
the data represent mean ± SD of 3-4 independent experiments (B). * indicates significantly different
40
Fig 7: AOH induces morphological changes associated with autophagy and lipid metabolism.
Cells were treated with AOH (30 M) for 24 h and analyzed by TEM. Cytoplasm of an untreated control cell showing normal ultrastructure (A). Intense cytoplasmic vacuolization after a 24 h
exposure to 30 µM AOH (B). Closer examination of autolysosomes (aly), lamellar body (la),
41
Fig 8: AOH induces senescence. Cells were treated with AOH (15-60 µM) for 24-72 h and
analyzed for β-galactosidase activity. Results represent mean ± SD of 3 independent incubations and are representative of 3 independent experiments. * indicates significantly different from control
42
Fig. 9: A schematic model of the proposed mechanism of AOH-induced autophagy and senescence.