HAL Id: hal-01625051
https://hal.archives-ouvertes.fr/hal-01625051
Submitted on 28 Jun 2018
HAL is a multi-disciplinary open access archive for the deposit and dissemination of sci-entific research documents, whether they are pub-lished or not. The documents may come from teaching and research institutions in France or abroad, or from public or private research centers.
L’archive ouverte pluridisciplinaire HAL, est destinée au dépôt et à la diffusion de documents scientifiques de niveau recherche, publiés ou non, émanant des établissements d’enseignement et de recherche français ou étrangers, des laboratoires publics ou privés.
non-invasive method to assess prognosis in patients with
ascites and cirrhosis
Maëna Le Corvec, Caroline Jezequel, Valérie Monbet, Nadia Fatih, Frédéric
Charpentier, Hugues Tariel, Catherine Boussard-Plédel, Bruno Bureau,
Olivier Loréal, Olivier Sire, et al.
To cite this version:
Maëna Le Corvec, Caroline Jezequel, Valérie Monbet, Nadia Fatih, Frédéric Charpentier, et al.. Mid-infrared spectroscopy of serum, a promising non-invasive method to assess prognosis in patients with ascites and cirrhosis. PLoS ONE, Public Library of Science, 2017, 12 (10), pp.e0185997. �10.1371/jour-nal.pone.0185997�. �hal-01625051�
Mid-infrared spectroscopy of serum, a
promising non-invasive method to assess
prognosis in patients with ascites and
cirrhosis
Mae¨na Le Corvec1,2, Caroline Jezequel3,4, Vale´rie Monbet5,6, Nadia Fatih2,
Fre´de´ric Charpentier2, Hugues Tariel2, Catherine Boussard-Ple´del4, Bruno Bureau4, Olivier Lore´al7,8, Olivier Sire1, Edouard Bardou-Jacquet3,7,8*
1 University Bretagne Sud, IRDL, FRE CNRS 3744, Vannes, France, 2 DIAFIR, Rennes, France, 3 CHU Rennes, Liver disease unit, Rennes, France, 4 Equipe Verres et Ce´ramiques, UMR CNRS 6226 Institut des Sciences Chimiques de Rennes, University of Rennes 1, Rennes, France, 5 IRMAR Mathematics Research Institute of Rennes, UMR-CNRS 6625, Rennes, France, 6 INRIA/ASPI, Rennes, France, 7 University of Rennes 1, Rennes, France, 8 INSERM U 1241, INRA1341, Institut NuMeCan, University of Rennes1, Rennes, France
*edouard.bardou-jacquet@chu-rennes.fr
Abstract
Background & aims
Prognostic tests are critical in the management of patients with cirrhosis and ascites. Biolog-ical tests or scores perform poorly in that situation. Mid-infrared fibre evanescent wave spec-troscopy (MIR-FEWS) which allows for global serum metabolic profiling may provide more relevant information by measuring a wider range of metabolic parameters in serum. Here we present the accuracy of a MIR-FEWS based predictive model for the prognosis of 6 months survival in patients with ascites and cirrhosis.
Methods
Patients with ascites were prospectively included and followed up for 6 months. MIR-FEWS spectra were measured in serum samples. The most informative spectral variables obtained by MIR-FEWS were selected by FADA algorithm and then used to build the MIR model. Accuracy of this model was assessed by ROC curves and 90%/10% Monte Carlo cross-vali-dation. MIR model accuracy for 6 months survival was compared to that of the Child-Pugh and MELD scores.
Results
119 patients were included. The mean age was 57.36±13.70, the MELD score was 16.32
±6.26, and the Child-Pugh score was 9.5±1.83. During follow-up, 23 patients died (20%). The MIR model had an AUROC for 6 months mortality of 0.90 (CI95: 0.88–0.91), the MELD 0.77 (CI95: 0.66–0.89) and Child-Pugh 0.76 (CI95: 0.66–0.88). MELD and Child-Pugh AUR-OCs were significantly lower than that of the MIR model (p = 0.02 and p = 0.02 respectively).
a1111111111 a1111111111 a1111111111 a1111111111 a1111111111 OPEN ACCESS
Citation: Le Corvec M, Jezequel C, Monbet V, Fatih
N, Charpentier F, Tariel H, et al. (2017) Mid-infrared spectroscopy of serum, a promising non-invasive method to assess prognosis in patients with ascites and cirrhosis. PLoS ONE 12(10): e0185997.https://doi.org/10.1371/journal. pone.0185997
Editor: Pavel Strnad, Medizinische Fakultat der
RWTH Aachen, GERMANY
Received: March 16, 2017 Accepted: September 22, 2017 Published: October 11, 2017
Copyright:© 2017 Le Corvec et al. This is an open access article distributed under the terms of the
Creative Commons Attribution License, which permits unrestricted use, distribution, and reproduction in any medium, provided the original author and source are credited.
Data Availability Statement: All relevant data are
available from the figshare repository at the following DOI:10.6084/m9.figshare.4753468.
Funding: This study was funded the French
National Association Research Technology (ANRT). This funder had no role in the study design, data collection and analysis, decision to publish, or preparation of the manuscript. The Diafir company provided financial support in the form of salary of authors NF, CC and HT, and provided research
Multivariate logistic regression analysis showed that MELD (p<0.05, OR:0.86;CI95:0.76– 0.97), Beta blockers (p = 0.036;OR:0.20;CI95:0.04–0.90), and the MIR model (p<0.001; OR:0.50; CI95:0.37–0.66), were significantly associated with 6 months mortality.
Conclusions
In this pilot study MIR-FEWS more accurately assess the 6-month prognosis of patients with ascites and cirrhosis than the MELD or Child-Pugh scores. These promising results, if confirmed by a larger study, suggest that mid infrared spectroscopy could be helpful in the management of these patients.
Introduction
Cirrhosis is associated with liver-related complications and mortality. Development of any of these complications marks the transition from a compensated to an uncompensated state which significantly decreases survival [1]. Prognosis of cirrhosis assessment is thus critical to the management of patients, especially regarding prioritization for liver transplantation. How-ever, it remains challenging due to the wide spectrum of the consequences of liver failure and portal hypertension.
The Child-Pugh score was the first score developed to assess cirrhosis severity according to biological and clinical criteria [2,3]. Although readily available and easy to determine, it uses subjective variables that lower its reproducibility, and it does not account for renal function which has a major impact on prognosis [4]. As a result, the MELD score was developed using a robust statistical analysis [5,6]. It is based on continuous biological parameters (bilirubin, cre-atinine, INR), and to date, is accepted as a more reproducible scoring method, although it does not significantly outperform the accuracy of the Child-Pugh score [7]. However, unlike the Child-Pugh score, the MELD score does not account for hepatic encephalopathy or ascites, both having a critical prognostic impact [8,9].
The liver transplant waiting list recapitulates the challenges of prognosis assessment in patients with cirrhosis. The ultimate goal for each patient is to optimize the trade-off between organ availability and the risk of short-term mortality. The MELD score has been adopted to increase priority for patients with a higher risk of death [10], however MELD exception points have to be assigned to patients whose disease prognosis is not reflected by their MELD score [11]. More specifically, the onset of ascites and refractory ascites are considered as major pejo-rative steps not reflected by the MELD score [8]. Therefore there is still a need for a better method to assess liver disease severity, which can encompass the wide spectrum of metabolic alterations that may accompany cirrhosis, liver failure and portal hypertension.
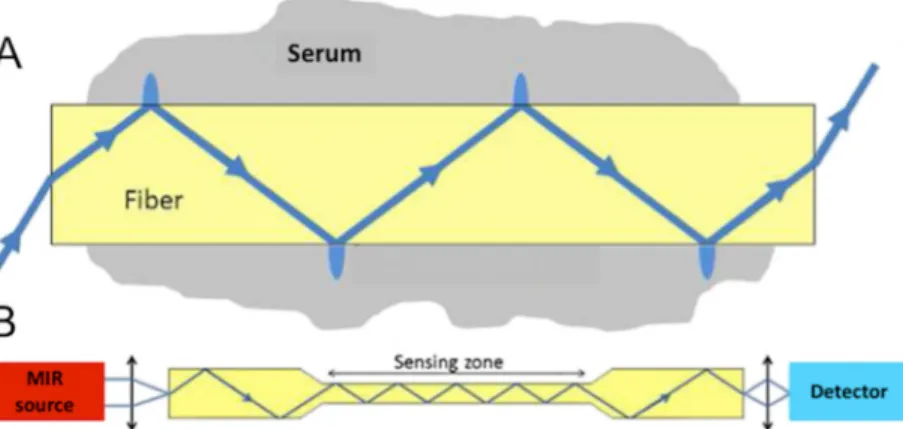
Fibre Evanescent Wave Spectroscopy (FEWS) performed in the Mid Infrared (MIR) spec-tral domain, allows for recording of a wide metabolic profile by simply placing a drop of serum on a chalcogenide Glass fibre optic sensor and collecting an MIR absorption spectrum [12,13]. MIR spectroscopy is based on the ability of organic molecular chemical bonds to undergo vibrational transitions in the MIR region and generate absorption bands in specific and thus assignable frequency ranges [14]. Evanescent wave is the part of the electromagnetic field which propagates at the surface of a fibre when the IR beam is internally reflected at the fibre/air interface. Evanescent waves can be absorbed by the chemical groups that are in close contact with the fibre (Fig 1). Thus, putting a biological sample in contact with the fibre allows for collecting at the fibre output, the biological sample’s absorption spectrum. The spectrum material (The Diafir SPIDTM FTIR portable
spectrometer used in this study to acquire data). This funder did not have any additional role in the study design, data analysis, decision to publish, or preparation of the manuscript. The specific roles of these authors are articulated in the “author contributions” section.
Competing interests: Diafir hold the patent for the
Diafir SPIDTM FTIR portable spectrometer used in this study. M. Le Corvec is a PhD Student supported by the French National Association Research Technology (ANRT) and the Diafir Company. O. Loreı`al, B Bureau, and C. Boussard-Ple´del are Diafir cofounders. C. Charpentier and N Fatih are Diafir employee. H. Tariel is DIAFIR Chief Executive Officer This does not alter our adherence to PLOS ONE policies on sharing data and materials.
Abbreviations: ALP, alkaline phosphatase; ALT,
alanine aminotransferase; AST, aspartate aminotransferase; AUROC, area under the receiver operating characteristic curve; CRP, C-reactive protein; FEWS, fibre evanescent wave spectroscopy; FTIR, Fourier transform infrared; GGT,γ-glutamyltransferase; INR, International Normalized Ratio; LDA, linear discriminant analysis; MELD, model for end-stage liver disease; MIR, mid-infrared; PCA, principal component analysis; PLS, partial least squares; ROC, receiver-operating characteristic.
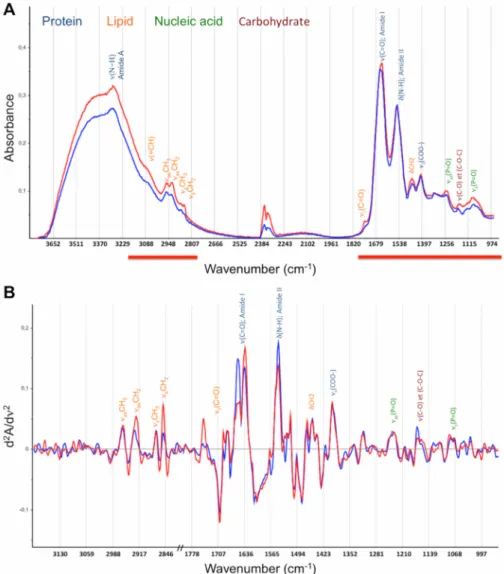
reflects the whole sample’s molecular organic composition, providing a metabolic fingerprint [15] (Fig 2).
Many spectroscopy studies demonstrate the potential of MIR spectroscopy for medical diagnosis, generally from tissue [17,18] and more recently from fluids like serum [19–21], plasma [22,23], or tears [24]. In liver disease, pilot studies have unveiled the relevance of MIR spectroscopy for the diagnosis of liver or bile duct cancer [25–27]. Feasibility studies per-formed by our team have previously demonstrated that FEWS allows for fast and simple fluid sampling, from which relevant metabolic fingerprints can be extracted [28][29]. Despite its potential, MIR spectroscopy is not currently used in clinical practice, because most of these studies were proof of concept studies [30].
The development of medical diagnosis based on vibrational spectroscopy is a two-phase proj-ect:i) diagnosis or classification of biomarkers, and ii) identification of the collected biomarkers
[31]. The metabolic fingerprint acquired from MIR spectra allows for identification of the broad biochemical alterations induced by the underlying disease. Spectral analysis and biomarker identification are required to reduce the number of spectral variables (i.e. optical
densities/wave-numbers) from a few hundred to approximately a dozen, in order to minimize the influence of noisy and/or redundant variables. This can be done through projection methods (PCA or PLS), variable selection or a combination of both [32]. In biospectroscopy, most studies use projection methods, however, these methods are detrimental to the spectral assignment of discriminative variables and thus for interpretation of the model in its biochemical dimension. Furthermore, projection methods may increase both noise and over-learning risk [32], consequently,other methods were specifically designed for high-dimensional data, like the FADA algorithm [33].
The aim of this study is to evaluate the ability of MIR-FEWS to obtain a global metabolic profile useful for the assessment of short-term prognosis of patients with ascites and cirrhosis. For this purpose, the first part of this study presents the MIR spectroscopy accuracy for dis-criminating 6 months survival, while biochemical assignment of the selected spectral markers is proposed in the second part.
Patients and methods
Study population
Patients with cirrhosis and ascites, without hepatocellular carcinoma, admitted to the liver dis-ease department between February 2012 and August 2013 for paracentesis, were consecutively
Fig 1. Mechanism of fibre evanescent wave spectroscopy (FEWS). A) Schematic propagation of the light wave in the fibre. B) General set up for FEWS with the light direction from Mid Infra Red (MIR) light source towards the detector. (With the agreement of Cui et al [16]).
included in this study. Hepatocellular carcinoma was ruled out at the first episode of ascites then screened every six months according to EASL-ECORT guidelines [34].
The study was approved by the local ethic committee (Rennes University Hospital Ethical Committee, n˚ 2011-A00580-41) and all patients gave their written informed consent.
History of liver disease including complications of cirrhosis, paracentesis volume and fre-quency, and ongoing treatment (including beta blockers, diuretics and antibiotics prophylaxis) were recorded at inclusion. A follow-up visit was performed six months after inclusion. Patients transplanted before the follow-up visit were excluded from analysis.
Clinical data, including events related to liver failure or portal hypertension were recorded at follow-up. Fasting blood samples were collected and the following biochemical assays were performed at inclusion and the follow-up visit: serum creatinine, albumin, bilirubin, pro-thrombin ratio, INR, sodium, AST, ALT, GGT, CRP and ALP. Child-Pugh and MELD scores
Fig 2. Representative spectra of a patient that was alive (blue) and a patient that was deceased (red) at 6 months. The frequency band assignments and absorption domains are displayed: blue, protein; orange, lipids; green, nucleic acids; and dark brown, carbohydrates.νandδsymbols describe the type of vibration:ν
depicts stretching andδfor bending, as for asymmetric and s for symmetric vibrational modes. A) Mid-infrared absorbance spectrum. Analysis domain (3200–2800; 1800-950cm-1) is displayed as red lines. B) Second
derivatives spectra within the analysis domain.
were determined at inclusion and follow-up. Serum sample was frozen (-80˚C) until recording for mid infrared spectra analyses.
All relevant data are available from the figshare repository at the following10.6084/m9. figshare.4753468.
Statistical analysis
Continuous variables were summarized as mean and standard deviation. All variables were tested for normal distribution with the Shapiro-Wilk test. Comparisons were made using the Student’st-test for normally distributed data or with the Mann–Whitney U-test. Nominal data
were tested using the Fisher’s exact test.
Clinically significant variables and variables associated with 6-month survival in univariate analysis withp<0.2, were included in logistic regression multivariate analysis with stepwise
forward selection according to Wald. For multivariate analysisp< 0.05 was considered
significant.
Diagnostic performance was determined using receiver operating characteristic (ROC) curves and comparison of ROC curves according to Delong et al [35]. Cut-offs were deter-mined using Youden index. Data were analyzed using SPSS version 22 (SPSS Inc., Chicago, IL, USA).p< 0.05 was considered significant with a two-tailed test.
Fibre evanescent wave spectroscopy
Spectra acquisition. The MIR spectra were recorded using a Diafir SPID™ FTIR portable
spectrometer (Rennes, France). The FTIR spectra were acquired in absorption mode in the 4000–400 cm-1frequency range. Nominal spectral resolution was set to 4 cm-1and a zero filing factor of 2 was employed, yielding a discrete spectral point spacing of 2 cm-1. The Blackman Harris three-term apodization function was used for Fourier transform. The measurement was performed by placing a single use infrared sensor (LS-23) in the spectrometer, recording its background signal, and then depositing 7μl of serum on the sensor. The single use design eliminates possible cross-contamination between two samples. The spectrum was acquired 5 min after serum deposition to obtain an accurate signal/water ratio and remove excess water that may conceal some infrared bands of interest. Water desorption was monitored over time by observing the 3400 cm-1waterνO-H absorption band decrease.
Pre-treatments. MIR spectra were pre-processed and analyzed in the 3800–950 cm-1
wavenumber domain, where most of the biomolecules absorption are located. A straight line was generated from 2800 to 1800 cm-1to eliminate interference from ambient air CO2. Second
derivatives were calculated, smoothed using a 13-point Savitzky-Golay algorithm, and normal-ized by vector normalization over the whole spectral range (Fig 2B). A quality test was applied and data homogeneity (outlier identification) was visually checked by principal component analysis (PCA).
Statistical analysis of spectra. The statistical analyses of spectra were aimed at identifying
patients at risk of death within 6 months. The wavenumber reduction process was performed only in the first 90 patients to limit the risk of overlearning. Selection of significant wavenum-ber within the initial set of 615 absorbance measures (3200–950 cm-1with a 2800–1800 cm-1 gap, spectral step of 2 cm-1) was achieved using FADA algorithm [33]. Linear discriminant analysis (LDA) classification error rate was used as a fitness function. The variable selection process was run 200 times with a Monte Carlo cross validation of 10% [36]. The most fre-quently selected wavenumber (around 30) during the 200 runs were retained. Once that data-set was chosen, the LDA was run with a 90%/10% Monte Carlo cross-validation, repeated 100 times, and supervised attempts to further reduce and optimize this variable set. Once the
optimized wavenumber set (a dozen) was defined, the LDA model was built using this set on the entire population and performances were checked by 90%/10% Monte Carlo cross-valida-tion (Fig 3).
Spearman’s tests were used to study the relationship between biological parameters and spectral variables, and also between spectral variables.
All statistical analyses of spectra were performed in the R core environment [37] through packages caret [38], FADA [39] and ROCR [40].
Results
Patients population
One hundred and nineteen patients with cirrhosis and ascites were prospectively included. Three patients were transplanted before the follow-up visit and were excluded from analysis. Clinical and biological characteristics of patients are summarized inTable 1.
Ninety-four (81%) patients were male with a mean age of 57.3±13.7 years. The mean MELD score was 16.32± 6.26 and Child-Pugh score was 9.5 ± 1.8. One hundred and nine patients had alcoholic liver disease (96%). Three patients had spontaneous bacterial peritonitis and seven presented with encephalopathy. Fifty one patients had treatment with beta blockers, 26 with furosemide, 43 with spironolactone, and 48 with spontaneous bacterial peritonitis prophylaxis.
The 6-month mortality rate was 20% (n = 23), and the main causes of death were liver
fail-ure (39%), sepsis (9%) and hemorrhage (13%). For 39% of patients, cause of death was either unknown or not related to liver disease. Low sodium levels and prothrombin ratio (p<0.01),
increased INR (p<0.01), C-reactive protein levels (p<0.01), total bilirubin levels (p<0.01),
ALT and ALP levels (p<0.05), and elevated MELD (p<0.001) and Child Pugh scores
(p<0.001), were significantly associated with 6-month mortality (Table 1).
Six months mortality risk assessment
All spectra passed the quality test (adjusted from [41]) and two outliers were identified by PCA analysis. These outliers were patients alive at 6 months. PCA analysis did not reveal any clear
Fig 3. Illustrative histogram of spectral variables selection by FADA algorithm and the process of variable selection optimization for Mid-infrared predictive model construction. The red line shows the minimum for variable selection.
discrimination (i.e. no clustering) between deceased and not deceased patients. This prompted
the use of a supervised method (LDA) with variable selection.
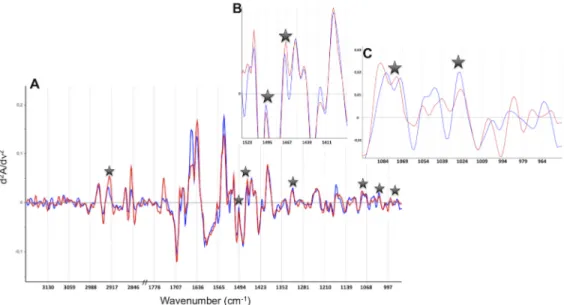
Representative spectra of one patient deceased and one alive at 6 months are displayed in Fig 4. Second derivative spectra showed differences between the two patients groups, but only
Table 1. Clinical and biological characteristics of patients included. Alive at 6 months (n = 93) Deceased at 6 months (n = 23) p Age (years) 56.7±14.4 59.9±9.8 NS Gender F/M 17/76 5/18 NS Creatinine (mmol/l) 81.9±51.2 127.2±145.1 NS Albumin (g/l) 30.0±4.6 28.2±5.1 NS Bilirubin (μmol/l) 49.0±54.1 144.6±183.7 ** Prothrombin ratio 56.7±13.6 46.6±14.1 ** INR 1.58±0.39 1.89±0.45 ** Sodium (mmol/l) 135.8±4.1 132.9±3.9 ** AST (UI/l) 84.8±112.6 89.4±52.6 NS ALT (UI/l) 41.3±56.5 44.3±28.8 * GGT (UI/l) 198.4±184.9 255.8±316.3 NS CRP (mg/l) 19.7±39.7 27.3±24.5 ** ALP (UI/l) 151.2±83.0 201.2±121.1 * MELD 14.9±4.8 21.4±8.2 *** Child-Pugh 9.1±1.7 10.9±1.6 ***
Values are mean±SD.
*p<0.05.
**p<0.01.
***p<0,001 NS: non-significant.
https://doi.org/10.1371/journal.pone.0185997.t001
Fig 4. Representative spectra of one patient deceased (red) and one alive (blue) at 6 months. The seven spectral variables selected to build the predictive model are represented by stars. A) Second derivative spectra in the 3200–2800; 1800-950cm-1domain. B) An expanded view in the 1530-1380cm-1domain. C) An
expanded view in the 1090-950cm-1domain.
a few of these differences were systematic. The MIR FEWS model eventually included 7 spec-tral variables (Table 2).
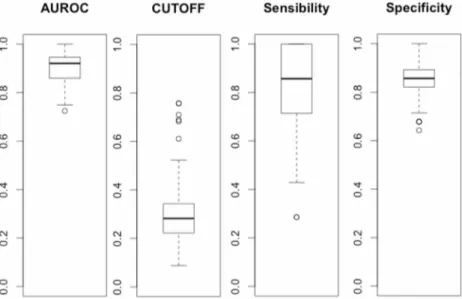
The mean AUROC of MIR-FEWS model over 100 cross-validation runs was 0.90 (CI95: 0.88–0.91). A mean off of 0.30 was chosen to maximize sensibility and specificity. This cut-off yield a mean sensitivity of 0.79 (CI95:0.75–0.83) and specificity of 0.85 (CI95:0.84–0.87). Detailed results of the cross-validation are presentedFig 5. One deceased and six surviving patients were systematically misclassified over 100 runs of cross-validation. There was no clini-cal or biologiclini-cal evidence to explain the misclassification of these patients.
To compare the accuracy between the MIR model, MELD and Child-Pugh scores, the MIR model was determined for the entire population without Monte Carlo cross-validation. The AUROCs for the MIR model was 0.94 (CI95: 0.87–0.99), MELD 0.77 (CI95: 0.66–0.89) and Child-Pugh 0.76 (CI95: 0.66–0.88) (Fig 6). The AUROC of MIR-FEWS was significantly higher than that of the MELD (p = 0.02) and the Child-Pugh score (p = 0.02). There was no
sig-nificant difference between the MELD and Child-Pugh AUROCs.
Table 2. Selected variable by FADA algorithm to discriminate patients alive or dead at 6 months.
Selected variables, wavenumbers (cm-1) Assignments
2925 νasCH2acyl chains (stretching mode)
1496 Aromatic ring
1468 δCH2(bending mode)
1316 Amide III, protein
1078 PO2-nucleic acid / C-C and C-O endo-ring in sugars
1030 ν(C = O); RNA and exo-ring in polysaccharides
972 δ;all trans lipid
νandδsymbols feature the type of vibration:νfor stretching andδfor bending; as for asymmetric and s for symmetric vibrational modes.
https://doi.org/10.1371/journal.pone.0185997.t002
Fig 5. Boxplots of AUROC, cut-off, sensibility and specificity values across the 100 runs of 90%/10% Monte Carlo cross-validation for the MIR FEWS model. Boxplots of sensibility and specificity were obtained with a 0.30 cut-off value.
Logistic regression multivariate analysis identified the MELD (p<0.05, OR:0.86; CI95:0.76–
0.97), the MIR model (p<0.001; OR:0.50;CI95:0.37–0.66), and beta blockers (p = 0.036;
OR:0.20;CI95:0.04–0.90) as significant variables to explain 6-month mortality.
Biochemical assignment of the spectral signature
Seven spectral variables (wavenumbers) were selected to build the MIR model. Chemical bonds that can be related to these wavenumbers are summarized inTable 2. These results show that 6 months mortality is associated with modifications of lipids, proteins, nucleic acids and sugar fingerprints. Concerning the lipid cluster, the 2925 cm-1and 1468 cm-1bands fea-ture the CH2stretching and bending modes respectively. The 972 cm-1band can be assigned
to the all trans lipids modes. The 1316 cm-1band arises from the protein amide III vibration whereas the 1496 cm-1band is associated to aromatic rings vibrations. The 1030 cm-1band is specific to sugars endo-ring vibrations whereas the 1078 cm-1band can arise either from PO2
-nucleic acids vibrations or from sugars exo-ring vibrations (only present in polysaccharides). Some of these spectral markers have been already identified in sera of patients exhibiting vari-ous diseases. For instance, the 1316 cm-1marker was identified in sera of women exhibiting breast cancer [42], its contribution to an early diagnosis being related to significant conforma-tion alteraconforma-tions in circulating proteins. The 1496 cm-1band, which features aromatic rings vibrations, could be associated to nitrotyrosine–protein adducts as shown in mouse models of acetaminophen–induced hepatitis [43]. This assumption is based on the vibrational effect of the nitro group on the phenol ring vibration of Tyr amino acid residues. The 1078 cm-1band
Fig 6. Comparison of receiver-operating characteristic (ROC) curves for the prediction of 6 months mortality. MIR model (red) (AUROC:0.94, CI95: 0.87–0.99), MELD score (blue) (AUROC:0.77, CI95: 0.66– 0.89) and Child-Pugh score (AUROC: 0.76, CI95: 0.66–0.88) (black).
is more challenging to assign. Gautam et al. [44] assigned this marker to a DNA leak in serum induced by cell necrosis.
It is noteworthy that spectral variables are correlated one with another (Fig 7A): 2925cm-1 is significantly correlated with 1468cm-1(r = 0.53, p<0.001) and 972cm-1(r = 0.21, p<0.05);
1496cm-1is significantly correlated with 1316cm-1(r = -0.43, p<0.001) and 1030cm-1(r =
-0.22,p<0.05); 1468cm-1is significantly correlated with 1316cm-1(r = -0.26,p<0.01);
1078cm-1is significantly correlated with 1030cm-1(r = 0.19;p<0.05) and 972cm-1(r = -0.19;
p<0.05). It must be pointed out that these markers have been identified from second derivative
spectra, therefore positive or negative correlation cannot be interpreted as similar or opposite absorbency variations. The most important point is to emphasize that the network of markers makes the recorded spectral signature and thus it is their relative variations as a whole which bear disease information.
Linking spectral markers with clinical and biological markers
Five of the seven spectral markers were significantly correlated with biological parameters evaluated in this study (Fig 7B): 2925cm-1was significantly correlated with creatinine (r = 0.30, p<0.001), bilirubin (r = 0.40, p<0.001), GGT (r = 0.37, p<0.001), ALP (r = 0.21, p<0.05), and
with the MELD score (r = 0.31, p<0.01); 1468cm-1with creatinine (r = 0.27, p<0.01), sodium
(r = -0.19, p<0.05), bilirubin (r = 0.33, p<0.001), and with the MELD score (r = 0.24, p<0.05);
1316cm-1with albumin (r = 0.21, p<0.05) bilirubin (r = -0.23, p<0.05), and with the
Child-Pugh score (r = -0.20, p<0.05); 1078cm-1with GGT (r = -0.24, p<0.05); and 1030cm-1with sodium (r = -0.27, p<0.01).
Discussion
Our pilot study shows that MIR-FEWS for metabolic profiling of patients with cirrhosis and ascites has a very good prognosis value. AUROC for six months mortality was 0.90(CI95:
Fig 7. Schematic illustrations of spectral and biomolecular networks. A) Shows the network of spectral biomarkers. Rather than individual values at these 7 wavenumbers, the diagnostic prediction relies on the whole network as it is shown from the correlations between markers. Positive correlations are featured with blue edges, negative with red ones. Edge’s thickness reflects the degree of correlation (r value). Every correlation is significant (p<0.05 at least). B) Complete network of disease markers including spectral (blue), clinical and biological (red) markers and scores (green). Correlations are coded as in (A).
0.88–0.91). A cut-off of 0.30 yielded a mean sensitivity of 0.79 (CI95:0.75–0.83) and specificity of 0.85 (CI95:0.84–0.87). AUROC of MELD and Child-Pugh scores were significantly lower than that of MIR model. In multivariate analyses MIR model, beta blockers treatment, and MELD scores were significantly associated with death within 6-months.
Although numerous studies have been performed to assess prognosis scores in patients with cirrhosis, few specifically assessed the prognosis of patients with ascites. In patients with cirrhosis, several studies showed similar prognosis value of the MELD and Child-Pugh scores, while others inconsistently favoured one over the other [45].
In a prospective work in patients with refractory ascites, Serste´et al. showed that the
Child-Pugh score had a higher AUROC to predict mortality than the MELDNa score. Furthermore, severe hyponatremia was a better predictor of death than MELDNa [46]. In that study, Child-Pugh score had a higher AUROC than in our study (0.89 versus 0.76 respectively), conversely, MELD score had a lower AUROC than in our population (0.58 versus 0.77, respectively). This may be explained by differences in study populations as our population was not restricted to refractory ascites. Moreover our results were based on a 6 months restricted follow-up.
Most studies have been carried out with a 3-month follow-up and show AUROC for MELD scores and Child-Pugh of about 0.85 [47–49]. More dedicated studies performed in patients with uncompensated cirrhosis presented lower AUROC values of between 0.61 and 0.79 for the Child-Pugh and 0.76 and 0.80 for the MELD [50,51] which are consistent with our results. In order to prioritize patients for liver transplantation, MELD exception points had to be set up to offset its lack of efficiency [52]. This emphasizes the unmet need for prognosis classifica-tion in this setting.
Recent technological developments have highlighted the relevance of metabolic profiling in patients liver disease to assess their outcome [53–55]. Discrete description of metabolic alter-ations in serum of patients recently showed excellent performance in predicting survival of patients with uncompensated cirrhosis [56]. Although direct comparisons with available prog-nosis scores were not performed in this study, it supports the potential benefit of metabolic profiling. Limitations of the method used in that study include its complexity, expensive equip-ment and analyses required to impleequip-ment these metabolomics tests. Our study uses a simple benchtop method which, although not giving a definite picture of the various metabolic alter-ations, provides a global fingerprint that shows satisfactory prognosis assessment. The pattern approach used in our study emphasizes the relevance of relative variations in identified spec-tral markers, which is facilitated by the fact that MIR spectra feature a wide range of relevant metabolites.
In conclusion, compared with the MELD and Child-Pugh scores, the MIR-FEWS method appears to be more efficient at identifying patients at risk for short-term mortality. This could be related to the ability of MIR-FEWS to obtain global information on the metabolic status of patients, in contrast to conventional scores which are based upon a limited number of parame-ters. The relevance of MIR-FEWS should be confirmed in an independent and large cohort of patients with cirrhosis and ascites. In addition, our study suggests the relevance of using the MIR-FEWS method in patients with cirrhosis with or without ascites.
Author Contributions
Conceptualization: Olivier Lore´al, Olivier Sire, Edouard Bardou-Jacquet. Data curation: Caroline Jezequel, Edouard Bardou-Jacquet.
Formal analysis: Mae¨na Le Corvec, Vale´rie Monbet, Olivier Sire, Edouard Bardou-Jacquet. Funding acquisition: Hugues Tariel, Catherine Boussard-Ple´del.
Investigation: Mae¨na Le Corvec, Caroline Jezequel, Nadia Fatih, Fre´de´ric Charpentier, Olivier
Lore´al.
Methodology: Mae¨na Le Corvec, Hugues Tariel, Catherine Boussard-Ple´del, Bruno Bureau,
Olivier Sire, Edouard Bardou-Jacquet.
Project administration: Hugues Tariel, Catherine Boussard-Ple´del, Edouard Bardou-Jacquet. Resources: Caroline Jezequel.
Software: Vale´rie Monbet, Hugues Tariel, Olivier Sire.
Supervision: Bruno Bureau, Olivier Sire, Edouard Bardou-Jacquet. Writing – original draft: Mae¨na Le Corvec, Edouard Bardou-Jacquet.
Writing – review & editing: Mae¨na Le Corvec, Bruno Bureau, Olivier Sire, Edouard
Bardou-Jacquet.
References
1. D’Amico G, Garcia-Tsao G, Pagliaro L. Natural history and prognostic indicators of survival in cirrhosis: A systematic review of 118 studies. J Hepatol. 2006; 44: 217–231.https://doi.org/10.1016/j.jhep.2005. 10.013PMID:16298014
2. Child CG. The liver and portal hypertension, by Child Charles G. 3rd, in collaboration with Coon William W. [and others] [Internet]. Philadelphia, Saunders, 1964.; 1964.http://search.ebscohost.com/login. aspx?direct=true&db=edshlc&AN=edshlc.002514910-5&lang=fr&site=eds-live
3. Pugh RNH, Murray-Lyon IM, Dawson JL, Pietroni MC, Williams R. Transection of the oesophagus for bleeding oesophageal varices. Br J Surg. 1973; 60: 646–649.https://doi.org/10.1002/bjs.1800600817
PMID:4541913
4. Ginès P, Schrier RW. Renal Failure in Cirrhosis. N Engl J Med. 2009; 361: 1279–1290.https://doi.org/ 10.1056/NEJMra0809139PMID:19776409
5. Malinchoc M, Kamath PS, Gordon FD, Peine CJ, Rank J, ter Borg PCJ. A model to predict poor survival in patients undergoing transjugular intrahepatic portosystemic shunts. Hepatology. 2000; 31: 864–871.
https://doi.org/10.1053/he.2000.5852PMID:10733541
6. Kamath P. A model to predict survival in patients with end-stage liver disease. Hepatology. 2001; 33: 464–470.https://doi.org/10.1053/jhep.2001.22172PMID:11172350
7. Said A, Williams J, Holden J, Remington P, Gangnon R, Musat A, et al. Model for end stage liver dis-ease score predicts mortality across a broad spectrum of liver disdis-ease. J Hepatol. 2004; 40: 897–903.
https://doi.org/10.1016/j.jhep.2004.02.010PMID:15158328
8. European Association for the Study of the Liver. EASL clinical practice guidelines on the management of ascites, spontaneous bacterial peritonitis, and hepatorenal syndrome in cirrhosis. J Hepatol. 2010; 53: 397–417.https://doi.org/10.1016/j.jhep.2010.05.004PMID:20633946
9. Vilstrup H, Amodio P, Bajaj J, Cordoba J, Ferenci P, Mullen KD, et al. Hepatic encephalopathy in chronic liver disease: 2014 Practice Guideline by the American Association for the Study of Liver Dis-eases and the European Association for the Study of the Liver. Hepatology. 2014; 60: 715–735.https:// doi.org/10.1002/hep.27210PMID:25042402
10. Merion RM, Sharma P, Mathur AK, Schaubel DE. Evidence-based development of liver allocation: a review: Evidence-based development of liver allocation. Transpl Int. 2011; 24: 965–972.https://doi.org/ 10.1111/j.1432-2277.2011.01274.xPMID:21615548
11. Francoz C, Belghiti J, Castaing D, Chazouillères O, Duclos-Valle´e J-C, Duvoux C, et al. Model for end-stage liver disease exceptions in the context of the french model for end-end-stage liver disease score-based liver allocation system. Liver Transpl. 2011; 17: 1137–1151.https://doi.org/10.1002/lt.22363
PMID:21695771
12. Keirsse J, Bureau B, Boussard-Pledel C, Leroyer P, Ropert M, Dupont V, et al. Chalcogenide glass fibers used for in situ infrared spectroscopy in biology and medicine. In: Culshaw B, Mignani AG, Rie-senberg R, editors. 2004. pp. 61–68.https://doi.org/10.1117/12.545430
13. Keirsse J, Lahaye E, Bouter A, Dupont V, Boussard-Ple´del C, Bureau B, et al. Mapping Bacterial Sur-face Population Physiology in Real-Time: Infrared Spectroscopy of Proteus mirabilis Swarm Colonies. Appl Spectrosc. 2006; 60: 584–591.https://doi.org/10.1366/000370206777670558PMID:16808858
14. Mantsch HH, Chapman D, editors. Infrared spectroscopy of biomolecules. New York: Wiley-Liss; 1996.
15. Anne M-L, Le Lan C, Monbet V, Boussard-Ple´del C, Ropert M, Sire O, et al. Fiber evanescent wave spectroscopy using the mid-infrared provides useful fingerprints for metabolic profiling in humans. J Biomed Opt. 2009; 14: 054033.https://doi.org/10.1117/1.3253319PMID:19895135
16. Cui S, Chahal R, Boussard-Ple´del C, Nazabal V, Doualan J-L, Troles J, et al. From Selenium- to Tellu-rium-Based Glass Optical Fibers for Infrared Spectroscopies. Molecules. 2013; 18: 5373–5388.https:// doi.org/10.3390/molecules18055373PMID:23666005
17. Rehman S, Movasaghi Z, Darr JA, Rehman IU. Fourier Transform Infrared Spectroscopic Analysis of Breast Cancer Tissues; Identifying Differences between Normal Breast, Invasive Ductal Carcinoma, and Ductal Carcinoma In Situ of the Breast. Appl Spectrosc Rev. 2010; 45: 355–368.https://doi.org/10. 1080/05704928.2010.483674
18. Kallenbach-Thieltges A, Großeru¨schkamp F, Mosig A, Diem M, Tannapfel A, Gerwert K. Immunohis-tochemistry, histopathology and infrared spectral histopathology of colon cancer tissue sections. J Bio-photonics. 2013; 6: 88–100.https://doi.org/10.1002/jbio.201200132PMID:23225612
19. Backhaus J, Mueller R, Formanski N, Szlama N, Meerpohl H-G, Eidt M, et al. Diagnosis of breast can-cer with infrared spectroscopy from serum samples. Vib Spectrosc. 2010; 52: 173–177.https://doi.org/ 10.1016/j.vibspec.2010.01.013
20. Ollesch J, Heinze M, Heise HM, Behrens T, Bru¨ning T, Gerwert K. It’s in your blood: spectral biomarker candidates for urinary bladder cancer from automated FTIR spectroscopy: Spectral cancer biomarkers from high-throughput FTIR spectroscopy. J Biophotonics. 2014; 7: 210–221.https://doi.org/10.1002/ jbio.201300163PMID:24395618
21. Hands JR, Dorling KM, Abel P, Ashton KM, Brodbelt A, Davis C, et al. Attenuated Total Reflection Fou-rier Transform Infrared (ATR-FTIR) spectral discrimination of brain tumour severity from serum sam-ples: Serum spectroscopy gliomas. J Biophotonics. 2014; 7: 189–199.https://doi.org/10.1002/jbio. 201300149PMID:24395599
22. Barlev E, Zelig U, Bar O, Segev C, Mordechai S, Kapelushnik J, et al. A novel method for screening colorectal cancer by infrared spectroscopy of peripheral blood mononuclear cells and plasma. J Gastro-enterol. 2016; 51: 214–221.https://doi.org/10.1007/s00535-015-1095-7PMID:26112122
23. Peuchant E, Richard-Harston S, Bourdel-Marchasson I, Dartigues J-F, Letenneur L, Barberger-Gateau P, et al. Infrared spectroscopy: a reagent-free method to distinguish Alzheimer’s disease patients from normal-aging subjects. Transl Res. 2008; 152: 103–112.https://doi.org/10.1016/j.trsl.2008.05.009
PMID:18774539
24. Travo A, Paya C, De´le´ris G, Colin J, Mortemousque B, Forfar I. Potential of FTIR spectroscopy for anal-ysis of tears for diagnosis purposes. Anal Bioanal Chem. 2014; 406: 2367–2376.https://doi.org/10. 1007/s00216-013-7607-5PMID:24481622
25. Thumanu K, Sangrajrang S, Khuhaprema T, Kalalak A, Tanthanuch W, Pongpiachan S, et al. Diagnosis of liver cancer from blood sera using FTIR microspectroscopy: a preliminary study: FTIR microspectro-scopy used to diagnose liver cancer from blood sera. J Biophotonics. 2014; 7: 222–231.https://doi.org/ 10.1002/jbio.201300183PMID:24639420
26. Zhang X, Thie´fin G, Gobinet C, Untereiner V, Taleb I, Bernard-Chabert B, et al. Profiling serologic bio-markers in cirrhotic patients via high-throughput Fourier transform infrared spectroscopy: toward a new diagnostic tool of hepatocellular carcinoma. Transl Res. 2013; 162: 279–286.https://doi.org/10.1016/j. trsl.2013.07.007PMID:23920432
27. Untereiner V, Dhruvananda Sockalingum G, Garnotel R, Gobinet C, Ramaholimihaso F, Ehrhard F, et al. Bile analysis using high-throughput FTIR spectroscopy for the diagnosis of malignant biliary stric-tures: a pilot study in 57 patients: Spectral diagnosis of malignant biliary strictures. J Biophotonics. 2014; 7: 241–253.https://doi.org/10.1002/jbio.201300166PMID:24677747
28. Le Corvec M, Allain C, Lardjane S, Cavey T, Turlin B, Fautrel A, et al. Mid-infrared fibre evanescent wave spectroscopy of serum allows fingerprinting of the hepatic metabolic status in mice. The Analyst. 2016; 141: 6259–6269.https://doi.org/10.1039/c6an00136jPMID:27704067
29. Albert J-D, Monbet V, Jolivet-Gougeon A, Fatih N, Le Corvec M, Seck M, et al. A novel method for a fast diagnosis of septic arthritis using mid infrared and deported spectroscopy. Joint Bone Spine. 2016; 83: 318–323.https://doi.org/10.1016/j.jbspin.2015.05.009PMID:26677999
30. Baker MJ, Hussain SR, Lovergne L, Untereiner V, Hughes C, Lukaszewski RA, et al. Developing and understanding biofluid vibrational spectroscopy: a critical review. Chem Soc Rev. 2016; 45: 1803–1818.
https://doi.org/10.1039/c5cs00585jPMID:26612430
31. Trevisan J, Park J, Angelov PP, Ahmadzai AA, Gajjar K, Scott AD, et al. Measuring similarity and improving stability in biomarker identification methods applied to Fourier-transform infrared (FTIR)
spectroscopy: Stability and similarity in biomarker identification in FTIR spectroscopy. J Biophotonics. 2014; 7: 254–265.https://doi.org/10.1002/jbio.201300190PMID:24604880
32. Mehmood T, Liland KH, Snipen L, SæbøS. A review of variable selection methods in Partial Least Squares Regression. Chemom Intell Lab Syst. 2012; 118: 62–69.https://doi.org/10.1016/j.chemolab. 2012.07.010
33. Perthame E´ , Friguet C, Causeur D. Stability of feature selection in classification issues for high-dimen-sional correlated data. Stat Comput. 2015;https://doi.org/10.1007/s11222-015-9569-2
34. European Association for the Study of the Liver, European Organisation for Research and Treatment of Cancer. EASL–EORTC Clinical Practice Guidelines: Management of hepatocellular carcinoma. J Hepatol. 2012; 56: 908–943.https://doi.org/10.1016/j.jhep.2011.12.001PMID:22424438
35. DeLong ER, DeLong DM, Clarke-Pearson DL. Comparing the Areas under Two or More Correlated Receiver Operating Characteristic Curves: A Nonparametric Approach. Biometrics. 1988; 44: 837.
https://doi.org/10.2307/2531595PMID:3203132
36. Dubitzky W, Granzow M, Berrar DP, editors. Fundamentals of data mining in genomics and proteomics. New York, NY: Springer; 2007.
37. R Core Team RF for SC. R: A Language and Environment for Statistical Computing. Vienna, Austria; 2015.http://www.R-project.org/
38. Kuhn M, Wing J, Weston S, Williams A, Keefer C, Engelhardt A, et al. caret: Classification and Regres-sion Training. 2016;http://CRAN.R-project.org/package=caret
39. Perthame E, Friguet C, Causeur D. FADA: Variable selection for supervised classification in high dimension. 2014;http://CRAN.R-project.org/package=FADA
40. Sing T, Sander O, Beerenwinkel N, Lengauer T. ROCR: visualizing classifier performance in R. Bioin-formatics. 2005; 21: 7881.
41. Helm D, Labischinski H, Naumann D. Elaboration of a procedure for identification of bacteria using Fou-rier-Transform IR spectral libraries: a stepwise correlation approach. J Microbiol Methods. 1991; 14: 127–142.https://doi.org/10.1016/0167-7012(91)90042-O
42. Zelig U, Barlev E, Bar O, Gross I, Flomen F, Mordechai S, et al. Early detection of breast cancer using total biochemical analysis of peripheral blood components: a preliminary study. BMC Cancer. 2015; 15.
https://doi.org/10.1186/s12885-015-1414-7PMID:25975566
43. Hinson JA, Pike SL, Pumford NR, Mayeux PR. Nitrotyrosine?Protein Adducts in Hepatic Centrilobular Areas following Toxic Doses of Acetaminophen in Mice. Chem Res Toxicol. 1998; 11: 604–607.https:// doi.org/10.1021/tx9800349PMID:9625727
44. Gautam R, Chandrasekar B, Deobagkar-Lele M, Rakshit S, B. N. V Kumar, Umapathy S, et al. Identifi-cation of Early Biomarkers during Acetaminophen-Induced Hepatotoxicity by Fourier Transform Infra-red Microspectroscopy. Mukhopadhyay P, editor. PLoS ONE. 2012; 7: e45521.https://doi.org/10.1371/ journal.pone.0045521PMID:23029070
45. Peng Y, Qi X, Guo X. Child–Pugh Versus MELD Score for the Assessment of Prognosis in Liver Cirrho-sis: A Systematic Review and Meta-Analysis of Observational Studies. Medicine (Baltimore). 2016; 95: e2877. PMID:26937922
46. Serste´ T, Gustot T, Rautou P-E, Francoz C, Njimi H, Durand F, et al. Severe hyponatremia is a better predictor of mortality than MELDNa in patients with cirrhosis and refractory ascites. J Hepatol. 2012; 57: 274–280.https://doi.org/10.1016/j.jhep.2012.03.018PMID:22521353
47. Boursier J, Cesbron E, Tropet A-L, Pilette C. Comparison and Improvement of MELD and Child-Pugh Score Accuracies for the Prediction of 6-month Mortality in Cirrhotic Patients: J Clin Gastroenterol. 2009; 43: 580–585.https://doi.org/10.1097/MCG.0b013e3181889468PMID:19197195
48. Kim SY, Yim HJ, Lee J, Lee BJ, Kim DI, Jung SW, et al. [Comparison of CTP, MELD, and MELD-Na scores for predicting short term mortality in patients with liver cirrhosis]. Korean J Gastroenterol Taehan Sohwagi Hakhoe Chi. 2007; 50: 92–100. PMID:17928752
49. Koo JK, Kim JH, Choi YJ, Lee CI, Yang JH, Yoon HY, et al. Predictive value of Refit Model for End-Stage Liver Disease, Refit Model for End-End-Stage Liver Disease-Na, and pre-existing scoring system for 3-month mortality in Korean patients with cirrhosis: Value of Refit Model for End-stage Liver Disease. J Gastroenterol Hepatol. 2013; 28: 1209–1216.https://doi.org/10.1111/jgh.12156PMID:23425057
50. Serra MA, Puchades MJ, Rodrı´guez F, Escudero A, Olmo del JA, Wassel AH, et al. Clinical value of increased serum creatinine concentration as predictor of short-term outcome in decompensated cirrho-sis. Scand J Gastroenterol. 2004; 39: 1149–1153.https://doi.org/10.1080/00365520410008024PMID:
15545175
51. Stewart CA, Malinchoc M, Kim WR, Kamath PS. Hepatic encephalopathy as a predictor of survival in patients with end-stage liver disease. Liver Transpl. 2007; 13: 1366–1371.https://doi.org/10.1002/lt. 21129PMID:17520742
52. Biggins SW, Colquhoun S, Gish RG, Runyon BA. Model for end-stage liver disease (MELD) exception for ascites. Liver Transpl. 2006; 12: S88–S90.https://doi.org/10.1002/lt.20963PMID:17123288
53. Ladep NG, Dona AC, Lewis MR, Crossey MM, Lemoine M, Okeke E, et al. Discovery and validation of urinary metabotypes for the diagnosis of hepatocellular carcinoma in West Africans. Hepatology. 2014; 60: 1291–1301.https://doi.org/10.1002/hep.27264PMID:24923488
54. Saxena V, Gupta A, Nagana Gowda GA, Saxena R, Yachha SK, Khetrapal CL. 1H NMR spectroscopy for the prediction of therapeutic outcome in patients with fulminant hepatic failure. NMR Biomed. 2006; 19: 521–526.https://doi.org/10.1002/nbm.1034PMID:16598697
55. Qi S-W, Tu Z-G, Peng W-J, Wang L-X, Ou-Yang X, Cai A-J, et al. H NMR-based serum metabolic profil-ing in compensated and decompensated cirrhosis. World J Gastroenterol. 2012; 18: 285–290.https:// doi.org/10.3748/wjg.v18.i3.285PMID:22294833
56. McPhail MJ, Shawcross DL, Lewis MR, Coltart I, Want EJ, Antoniades CG, et al. Multivariate metabo-typing of plasma predicts survival in patients with decompensated cirrhosis. J Hepatol. 2016; 64: 1058– 1067.https://doi.org/10.1016/j.jhep.2016.01.003PMID:26795831