HAL Id: hal-02294235
https://hal.archives-ouvertes.fr/hal-02294235
Submitted on 3 Sep 2020HAL is a multi-disciplinary open access archive for the deposit and dissemination of sci-entific research documents, whether they are pub-lished or not. The documents may come from teaching and research institutions in France or abroad, or from public or private research centers.
L’archive ouverte pluridisciplinaire HAL, est destinée au dépôt et à la diffusion de documents scientifiques de niveau recherche, publiés ou non, émanant des établissements d’enseignement et de recherche français ou étrangers, des laboratoires publics ou privés.
unprecedented structural and functional properties:
Ferredoxin with low Em discriminating against FNR
Taiki Motomura, Lidia Zuccarello, Pierre Sétif, Alain Boussac, Yasufumi
Umena, David Lemaire, Jatindra N. Tripathy, Miwa Sugiura, Rainer
Hienerwadel, Jian-Ren Shen, et al.
To cite this version:
Taiki Motomura, Lidia Zuccarello, Pierre Sétif, Alain Boussac, Yasufumi Umena, et al.. An alternative plant-like cyanobacterial ferredoxin with unprecedented structural and functional properties: Ferre-doxin with low Em discriminating against FNR. Biochimica biophysica acta (BBA) - Bioenergetics, Elsevier, 2019, pp.148084. �10.1016/j.bbabio.2019.148084�. �hal-02294235�
An alternative plant-like cyanobacterial ferredoxin with
unprecedented structural and functional properties
Taiki Motomura§ǁ, Lidia Zuccarello§+±, Pierre Sétif#, Alain Boussac#,Yasufumi Umenaǁ, David Lemaire+, Jatindra N.Tripathy†, Miwa Sugiuraǂ,Rainer Hienerwadel*, Jian-Ren Shenǁ*, Catherine Berthomieu+*.
Addresses
ǁResearch Institute for Interdisciplinary Science, Graduate School of Natural Science and
Technology, Okayama University, Okayama 700‑8530, Japan
+
CEA, CNRS, Aix Marseille Univ, BIAM, Interactions Protéine Métal UMR 7265, 13108 Saint Paul-Lez-Durance, France
±
Aix Marseille Univ, CEA, CNRS, BIAM, Luminy Genetics and Biophysic of Plants, UMR 7265, 13288 Marseille Cedex, France
#
I2BC, UMR CNRS 9198, CEA Saclay, 91191 Gif-sur -Yvette, France.
ǁ†Center for Biotechnology and Genomics, Texas Tech University,
ǂProteo-Science Research Center, Ehime University, Bunkyo-cho, Matsuyama, Ehime 790-8577,
Japan.
§
Equally contributed *Corresponding authors
Rainer Hienerwadel: rainer.hienerwadel@univ-amu.fr Jian-Ren Shen: shen@cc.okayama-u.ac.jp
Catherine Berthomieu: catherine.berthomieu@cea.fr
Abstract
Photosynthetic [2Fe-2S] plant-type ferredoxins have a central role in electron transfer between the photosynthetic chain and various metabolic pathways. Several genes are coding for [2Fe-2S] ferredoxins in cyanobacteria, with four in the thermophilic cyanobacterium
Thermosynechococcus elongatus. The structure and functional properties of the major ferredoxin
Fd1 are well known but data on the other ferredoxins are scarce. We report the structural and functional properties of a novel minor type ferredoxin, Fd2 of T. elongatus, homologous to Fed4 from Synechocystis sp. PCC 6803. Remarkably, the midpoint potential of Fd2, Em = -440 mV, is lower than that of Fd1, Em = -372 mV. However, while Fd2 can efficiently react with photosystem I or nitrite reductase, time-resolved spectroscopy shows that Fd2 has a very low capacity to reduce ferredoxin-NADP+ oxidoreductase (FNR). These unique Fd2 properties are discussed in relation with its structure, solved at 1.38 Å resolution. The Fd2 structure significantly differs from other known ferredoxins structures in loop 2, N-terminal region, hydrogen bonding networks and surface charge distributions. UV-Vis, EPR, and Mid- and Far-IR data also show that the electronic properties of the [2Fe-2S] cluster of Fd2 and its interaction with the protein differ from those of Fd1 both in the oxidized and reduced states. The structural analysis allows to propose that valine in the motif Cys53ValAsnCys56 of Fd2 and the specific
orientation of Phe72, explain the electron transfer properties of Fd2. Strikingly, the nature of these residues correlates with different phylogenetic groups of cyanobacterial Fds. With its low redox potential and its discrimination against FNR, Fd2 exhibits a unique capacity to direct efficiently photosynthetic electrons to metabolic pathways not dependent on FNR.
Key words : Alternative ferredoxin, X-ray structure, UV-Vis kinetics, Far-infrared of iron-sulfur center, spectro-electrochemistry, photosynthetic electron transfer.
INTRODUCTION
Ferredoxins (Fd) are ubiquitous proteins with major roles in bioenergetics. In organisms performing oxygenic photosynthesis, the soluble electron acceptors that function as a relay in the electron transfer between Photosystem I (PSI) in the photosynthetic chain and a number of soluble enzymes are Fds containing a redox active [2Fe-2S] cluster coordinated by four cysteine residues [1]. They are notably involved in the photosynthetic production of NADPH via the ferredoxin-NADP+ oxidoreductase (FNR) [2], and in cyclic electron transfer around PSI for the generation of a proton gradient used for ATP synthesis [3]. They are also involved in redox reactions associated with a large number of metabolic pathways such as CO2 fixation, nitrogen or
sulfur assimilation by reduction of nitrite reductase (NiR) or sulfite reductase [4-6] or in fatty acid or amino acid synthesis and redox regulation via the Fd-thioredoxin oxidoreductase. These plant-type Fds have a remarkably low midpoint potential in the -300 to -460 mV range vs NHE1 [7-9].
Multiple gene copies for [2Fe-2S] Fds are present in the known genomes of plants, cyanobacteria and algae. For example, there are five genes coding for five Fds, noted Fed1 to Fed5 in the Synechocystis sp. PCC6803 genome [5] and four genes coding for four Fds, noted here Fd1 to Fd4, in the genome of Thermosynechococcus elongatus [10], according to their degree of homology with petF. The sequence of Fd1 (T. elongatus gene tsl1009) presents a high homology with Fed1 in Syn. 6803 [5] as well as with the main Fd of Nostoc PCC7120, denoted thereafter FdN (Table 1). These Fds are the major proteins involved in photosynthetic electron transfer. From the gene sequence, Fd2 (T. elongatus gene tlr1236) has a higher molecular mass and presents a higher sequence homology with Fed4 of Syn. 6803 (Table1), although it is not mentioned in [5]. Fd3 (T. elongatus gene tlr1656) presents a high sequence homology with Fed2 of Syn. 6803 with a C-terminal extension, while Fd4 (T. elongatus gene tll0487) is more closely related to the Fed3 of Syn. 6803. All these Fds have the typical CysX4CysX2CysX29Cys motif of
plant-type ferredoxins involved in the binding of the [2Fe-2S] cluster, except Fed4 with X31. In
Fd1 and Fd2 from T. elongatus, there is a fifth cysteine (Cys87 in Fd1) not involved in the coordination of the [2Fe-2S] cluster. This Cys is also present in Fed1 and Fed4 from Syn. 6803, but is absent in the other Fds listed in Table 1, in particular in FdN.
While the electron transfer properties of the Fd1-type ferredoxins is well known, pieces of information on the other Fds remain scarce. Open questions includes whether some of these Fds are in part redundant or if they are involved in preferential interactions with different partners, or even if they are involved in non-photosynthetic processes. In Arabidopsis thaliana, two photosynthetic Fds with contrasted abundance, AtFd1 7% and AtFd2 90%, have very similar redox potentials (at -430 mV) and electron transfer kinetics with redox partners, and their different functions were proposed to be related to different expression patterns [11]. In C.
reinhardtii and Syn. 6803, different functions of the Fds have been associated to different
environmental conditions, different interaction efficiencies and electron transfer kinetics with the various Fd-dependent enzymes [5, 12]. Very recently, Fed2 from Syn. 6803 corresponding to Fd3 from T. elongatus has been shown to have a high redox potential (at -243 mV) and not involved in photosynthetic electron transport, but in the response to changing environmental iron concentrations [13]. Data on the structure-function relationships of other minor Fds are lacking for a better understanding of their physiological roles and of the molecular mechanisms that eventually govern the transfer of photosynthetic electrons to different metabolic pathways.
The structure-properties relationship in Fds has been extensively studied for FdN. Its structure was solved in the oxidized (PDB ID: 1FXA, 1QT9) and reduced states (PDB ID: 1CZP) [14, 15] as well as in complex with the redox partners FNR (PDB ID: 1EWY) [16] and PSI (PDB ID: 2PVO) [17]. In addition, studies of site directed mutants pointed key residues of FdN, Glu94 and Phe65, for efficient electron transfer to FNR, [18]. The structure of T. elongatus Fd1, first studied by NMR [19, 20], was recently solved by X-ray crystallography at 1.5 Å resolution (PDB ID: 5AUI) [21] and at 4.3 Å resolution in complex with PSI [17]. In contrast, no structures of minor Fds have been reported so far.
In this study, we studied the structural and functional properties of the minor-type Fd2 from T. elongatus. We purified Fd2, crystallized and solved its crystal structure at a 1.38 Å resolution. For comparison, we also determined the crystal structure of Fd1 from the same cyanobacterium at 1.55 Å resolution. We further examined the redox, electronic, and vibrational properties of Fd2 as well as its electron transfer (ET) properties with main potential partners PSI, FNR, and NiR, and compared them with those of Fd1, FdN, and of a minor Fd fraction likely resulting from Fd1 post-translational modification and noted thereafter Fd1’.
Our data show significant structural differences between Fd2 and Fd1, and indicate that Fd2 is the first example of a Fd with low redox midpoint potential that can efficiently react with PSI or NiR, but discriminates against FNR. The Val residue in the Cys53ValThrCys56 motif of
Fd2 and a completely different orientation of Phe72 in Fd2 as compared to that of the corresponding Phe65 in Fd1, are proposed to account for these unique properties of Fd2, and possibly of a group of phylogenetically related ferredoxins identified in cyanobacteria only.
METHODS
Purification of the ferredoxins from Thermosynechococcus elongatus and Nostoc PCC7120
After harvesting, the cells were washed in a medium containing 10 mM Tricine and 15 mM CaCl2, pH 7.5 and resuspended in ~100 mL of the same medium. Then the cells were broken
by using a French press in the presence of DNaseA and anti-proteases (benzamidine and 6-aminocaproic acid). The broken cells were diluted into ~ 2 L of 18 M water and ammonium sulfate was added to reach a final concentration of 45%. The mixture was gently stirred for 30 min at room temperature and then centrifuged for 30 min at room temperature (rotor Beckman Coulter JA10, 9500 RPM). The pellet containing the membranes and a large part of the phycobiliproteins was discarded. The supernatant was gently collected and passed through a Phenyl-Sepharose fast flow resin, equilibrated with 45% ammonium sulphate in water, at a flow rate of 6 ml/min. The proteins were then eluted with 1.6% ammonium sulphate in water at a flow rate of 0.5 ml/min. The remaining phycobiliproteins bound to the resin were then eluted with pure water and discarded. The proteins eluted from the Phenyl-Sepharose fast flow resin were concentrated by using an Amicon Ultra-15 Centrifugal Filter Unit (cut-off 3 kDa). The concentrated proteins were then loaded on a HiPrep Phenyl HP 16/10 column after the addition of 30 % ammonium sulphate. A gradient from 30% to 0% ammonium sulphate in the presence of 10 mM tricine at pH 7.5, was applied in 45 minutes at a flow rate of 2 ml/min and several fractions were collected. A fraction containing some Fds (dark-brown fraction) eluted first, before a fraction containing mainly Cytc550 (red fraction) and a fraction containing Cytc6 (pink fraction).
The first dark-brown fraction was then loaded onto a HiTrap (Q-sepharose) ion-exchange column and the proteins were eluted with a NaCl gradient from 0 mM to 600 mM NaCl in the presence of 10 mM tricine pH 7.5 at a flow rate of 2 ml/min in 45 minutes. Two dark-brown
fractions were found. One eluted between 200 mM and 300 mM NaCl and the other between 500 mM and 600 mM NaCl. Both contain Fd1 but the first fraction contains Fd1 and many other proteins (likely reflecting non-specific interactions).
The red fraction obtained from the Hi-trap column was concentrated to a volume of 2 ml. Then, it was loaded onto a gel filtration column (Sephadex 75, HiLoad 26/60Pharmacia). The proteins were eluted at a flow rate of 1 ml/min. The elution medium contained 10 mM tricine pH 7.5, 50 mM NaCl. The gel filtration gave several peaks (yellow, red, pink, dark-brown) which were collected separately. Each of these fractions was then separately loaded onto a HiTrap (Q-sepharose) column and the proteins were eluted with a NaCl gradient (in the presence of 10 mM tricine pH 7.5) from 0 mM to 600 mM at 2 ml/min in 45 minutes. Fd2 was eluted from several of the pools at approximately 250 mM NaCl. Other proteins were found in the following order: Cytc6ox at 40 mM, Cytc6red at 80 mM, PsbV2 at 200 mM, Cytc550 at approximately 300 mM
[22], Fd1 at 500-600 mM NaCl. Finally, all the fractions found above were separately concentrated and washed in 10 mM tricine pH 7.5. Each of the concentrated proteins was then separately loaded onto a MonoQ column for a final purification step. Elution of the proteins was done with a NaCl gradient from 0 to 600 mM in the presence of 10 mM tricine pH 7.5 at a flow rate of 0.5 ml/min during 45 minutes. The purity of the fractions was estimated from the absorption spectra (see Figure 1A).
Preparation of other proteins
Photosystem I from T. elongatus was purified as previously described [23]. An N-truncated form of FNR from T. elongatus, lacking the first 85 residues, was overexpressed in E.
coli and purified similarly to the short FNR isoform from Syn. 6803 [24]. Partial alignment with
this short isoform is shown below (genes slr1643 and tlr1211 for Syn. 6803 and T. elongatus, respectively). The truncated FNR isoform thus begins with alanine 86, as confirmed by mass spectrometry (not shown).
slr1643 MTTTPKEKKADDIPVNIYRP... tlr1211 ..AAPVKEKKVDIPVNIYRP...
This FNR protein is similar in size and sequence to the short FNR isoform FNRS from
Syn. 6803. Contrary to the case of Syn. 6803 where two FNR isoforms of different sizes are
only the large isoform FNRL bound to phycobilisomes is expressed [26]. FNRS and a
phycobilisome subcomplex FNRL-phycocyanin (FNRL-PC), both from Syn. 6803, were
previously compared regarding their functional properties [27]. Two differences that are relevant to the present study were observed: the midpoint potential Em corresponding to the first FNR
reduction is 6 mV higher in FNRL-PC than in FNRS; the rate constant kon of Fdred association to
FNR is 40% smaller with FNRL-PC than with FNRS. Whereas the change in Em is negligible, the
change in kon, although significant, indicates that in the presence of PC, the interaction between
Fd and FNR is not dramatically disturbed. In turn, this shows that comparing the reactivity of the pseudo-short FNR from T. elongatus with Fd1 and Fd2 is relevant.
Recombinant NiR from Chlamydomonas reinhardtii was overexpressed in E. coli and purified as previously described [28].
Crystallization and X-ray data collection
The protein concentration of Fd1 and Fd2 was measured by the BCA method with a BCA Protein Assay Kit (TaKaRa, Japan). The absorption peak at 562 nm was measured by a UV-visible spectrophotometer UV-2450 (Shimazu). The Fd1 sample at a concentration of 8 mg/ml was mixed at a ratio of 1 to 1 with a reservoir solution containing 100 mM sodium citrate (pH 6.5), 2.6 M ammonium sulfate, 0.2% benzamidine hydrochloride and 1,6-hexanediol according to the previous report [21], and crystallized by the vapor-diffusion method for several weeks at 20oC. The Fd1 crystals obtained were cryo-protected using the same solution as that of the reservoir plus 10 % (w/v) glycerol, and flash frozen with a cooled nitrogen gas. X-ray diffraction data for Fd1 were collected at Beamline BL41XU of SPring-8 at a wavelength of 1.000 Å at 100 K.
For crystallization of Fd2, the Fd2 sample at a concentration of 8 mg/ml was mixed at a ratio of 3 to 1 with a reservoir solution containing 100 mM HEPES (pH 7.5) and 2.4 M ammonium sulfate, and crystallized also by the vapor-diffusion method for several weeks at 20
o
C. Aggregated needle-like crystals mixed with a thin plate crystal were obtained. The crystal has a brown color due to the iron from the ferredoxin. They were cryo-protected using the same solution as that of the reservoir plus 15 % (w/v) glycerol, and flash frozen with a cooled nitrogen gas. X-ray diffraction data for Fd2 were collected at Beamline BL38XU of SPring-8 at a wavelength of 1.000 Å at 100 K. The X-ray doses of each collection were calculated by RADDOSE-3D [29] using a solvent content calculated by Cell Content Analysis of CCP4 [30].
Structure determination
Diffraction data were indexed, integrated, and scaled by XDS [31]. The structure factors were generated using the program truncate in CCP4 [32]. The initial phases were obtained by the molecular replacement method using Molrep [33] with the structure of the major Fd1 from T.
elongatus (PDBID: 5AUI [21]) as the search model, which results in a model having 97 residues.
The rest of the model was manually built with the program COOT [34], and the structure refinement was performed with the program Refmac [35]. Ramachandran plot was calculated with MolProbity [36]. The secondary structure of Fd2 was assigned by DSSP [37, 38] on Pymol plugin [39]. The statistics of X-ray diffraction data and structural refinement were summarized in Supp. Table 1. The structure of Fd1 was determined to a resolution of 1.55 Å with the same method as that described for Fd2 (structure parameters are given in Supp. Table 1).
Sequence alignment and structure comparison
The amino acid sequences of the ferredoxin proteins from T. elongatus were searched using cyanobase of the Kazusa research institute [10] and aligned with ClustalW [40, 41]. Superposition of the ferredoxin structures was performed with COOT [34, 42] with the SSM Superpose function [43] for comparison between the whole structures of Fds. The surface charges of the ferredoxin structures were generated by APBS Electrostatic [44] of the Pymol plugin [39]. The secondary structure assignments of Fds were performed by DSSP [37, 38] on the DALI Server [45]. For docking simulation, GRAMM-X was used [46, 47]. RMSDs (Root-Mean Square Deviations) between C atoms of different Fds were calculated using lsqkab [48].
Mass spectrometry experiments
Fd2 was initially identified by MALDI-TOF/MS measurements in the linear mode as previously described [49]. Then, mass analysis of the Fds was done in more gentle conditions using a MicroTOF-Q (Bruker, Wissembourg, France) Mass Spectrometer equipped with an electrospray ionization source. In denaturing conditions, samples concentrations were 1 µM in CH3CN/H2O (1/1-v/v), 0.2% formic acid (Sigma-Aldrich). Samples were continuously infused at
a flow rate of 3 μl min-1
. Mass spectra were recorded in the 50–7000 mass-to-charge (m/z) range. MS experiments were carried out with a capillary voltage set at 4.5 kV and an end plate off set
voltage at 500 V. The gas nebulizer (N2) pressure was set at 0.4 bar and the dry gas flow (N2) at 4
L min-1 at a temperature of 190°C.
Non-covalent mass spectrometry measurements were performed to identify and determine stoichiometry of complexes. The samples at a concentration of 5 or 10 µM in 20 mM ammonium acetate (Sigma-Aldrich) were continuously infused at a flow rate of 7 µL min-1. The mass spectra were recorded in the 50-4000 mass-to-charge (m/z) range. The gas nebulizer (N2) pressure was
set at 3 bars and the dry gas flow (N2) at 3 L min-1 at a temperature of 200°C.
Data were acquired in the positive mode and calibration was performed using a calibrating solution of ESI Tune Mix (Agilent) in CH3CN/H2O (95/5-v/v). The system was controlled with
the software package MicrOTOF Control 2.2 and data were processed with DataAnalysis 3.4.
Sample preparation for electrochemistry and FTIR spectroscopy
All protein samples (Fd1, Fd2 and Fd1’ from T. elongatus and FdN from Nostoc
PCC7120) were concentrated to 0.2 to 3 mM in tricine 50 mM, NaCl 100 mM, pH 7.5 or CAPS
50 mM, NaCl 100 mM, pH 10. To prepare the 2H2O samples, the H2O buffers were lyophilized
and returned to the original volume using 2H2O, twice in a row. Two concentration / dilution
steps using the 2H2O buffers on Amicon 3 kDa membranes were employed to prepare the
samples.
Spectro-Electrochemistry
Spectro-electrochemistry was performed using the three-electrode thin path-length cell described in [50] equipped with CaF2 or CVD diamond windows. This cell is air-tight and allows
recording spectra in the whole UV-to far-IR spectral region. The working electrode is a 4 µM-thick gold grid washed with a (H2SO4:H2O2 3:1) solution, then surface-modified by dipping it for
20 min into a 5 mM pyridine-3-carboxaldehyde thiosemicarbazone solution heated to 80−90°C. The path-length of the cell was adjusted below 10 µm using the sample absorption at 1640 cm-1. The following list of mediators was used to accelerate the redox reactions: methyl viologen (MV,
E0: - 444 mV/NHE), benzyl viologen (E0: - 358 mV), anthraquinone 2-sulfonate (E0: - 223 mV), 2-hydroxy 1,4-naphtoquinone (E0: - 123 mV), 2,5-dihydroxy p-benzoquinone (E0: - 60 mV), duroquinone (E0: + 10 mV), N-ethyldibenzopyrazine(ethyl)sulfonate (E0: + 55 mV), methylphenazinium methyl salt (E0: + 80 mV), 1,2-naphtoquinone 4-sulfonic acid (E0: + 217
mV), diaminodurol (E0: + 240 mV), tetramethylphenylene-diamine (E0: + 270 mV), 2,5-dichloro 1,4-benzoquinone (E0: + 300 mV) and ferricyanide (E0: + 426 mV). The final concentration of each mediator was 40 μM. Equilibrium redox titrations were performed by applying potentials ranging from -190 mV to -490 mV vs NHE for Fd1 and the ferredoxin from Nostoc PCC7120, from -270 mV to -570 mV for Fd2, and from -170 mV to -530 mV for Fd1’, with 20 mV intervals. Externally triggered potentiostats EG&G 262 or Tacussel Polarostat Type PGRE were used for the redox titrations. Each potential was applied for 10 minutes before recording the UV-Vis spectra.
UV-Vis and EPR spectroscopy
Absorption spectra during the purification of the Fds were measured with an Uvikon XL Secomam (Bioserv) spectrometer. For the redox titrations, the UV-Vis spectra were recorded in the 390 to 660 nm range, using a Cary 14 spectrophotometer. The electrochemical cell was thermostated at 15°C with a water circulation system and the sample compartment was purged with dry air to avoid water vapour condensation. The data were analysed using the integrated spectral area from 390 to 640 nm.
X-band cw-EPR spectra were recorded with a Bruker Elexsys 500 X-band spectrometer equipped with a standard ER 4102 (Bruker) X-band resonator, a Bruker teslameter, an Oxford Instruments cryostat (ESR 900) and an Oxford ITC504 temperature controller.
FT-IR difference spectroscopy
Mid-IR FTIR difference spectra were recorded using a Bruker Tensor 27 spectrophotometer equipped with a MCT detector and purged with dry air. Spectra from 680 to 100 cm-1 were recorded using a vacuum-purged Bruker Vertex 70v spectrophotometer equipped with a helium-cooled Si-Bolometer. Electrochemistry was performed at 10°C and spectra were recorded after 10 or 15 min equilibration at the oxidizing (-190 mV) or reducing (-650 mV) potentials. For each electrochemical cycle, reduced-minus-oxidized or oxidized-minus-reduced spectra corresponded to the average of 300 scans. The final reduced-minus-oxidized difference spectra correspond to the average of spectra obtained with 10 to 20 electrochemical cycles in the Mid-IR and 20 to 30 electrochemical cycles in the Far-IR.
Flash-absorption spectroscopy
Measurements were made at 22°C in 1-cm square cuvettes with a DC-0.3 MHz bandwidth. Actinic laser excitation (7 ns duration at 700 nm, 15 mJ energy), which is saturating for PSI photochemistry, was provided by a dye laser (Sirah-Lasertechnik) pumped by a frequency-doubled:YAG laser (Spectra-Physics). Experiments were performed at a few wavelengths, which were selected by 10-nm bandwidth interference filters placed before and after the cuvette. Measurements at 800 nm (data not shown) were made to quantify the PSI concentration, using an absorption coefficient of 7700 mM-1cm-1 for P700+ [24]. Fd reduction by PSI was measured at 580 nm. Indeed, at this wavelength often used in previous studies [51, 52], PSI absorbs very weakly and 580 nm is close to the isosbestic point of -carotene triplet states (3car), which decay in the same time range as the fast phases of Fd reduction. The same wavelength was used for studying reduction of FNR by reduced Fd (Fdred) as FADH●, the
protonated radical of singly-reduced FNR, absorbs strongly at this wavelength [53]. NiR reduction by Fdred was studied at 520 nm, where this process gives a large absorption change
[54], contrary to 580 nm. In the visible region (520 and 580 nm), actinic effects of the measuring light were avoided by a shutter, which was placed just before the cuvette and opened 1 ms before the actinic laser flash. All measurements were performed in 20 mM Tricine, 0.03 % -dodecyl-maltoside, 2 mM sodium ascorbate and 25-30 µM 2,6- dichlorophenolindophenol (DCPIP). DCPIPH2 (DCPIP reduced by ascorbate) completely reduces P700+ in a few seconds, which allowed signal averaging at a frequency of 0.1 to 0.14 Hz. Fd and FNR measurements were performed in the presence of 5 mM MgCl2 and 30 mM NaCl. NiR measurements were performed
in the presence of 0.5 M mannitol, 2 mM MgCl2 and 15 mM NaCl.
In experiments at 520 and 580 nm, a reference and a sample cuvette were placed alternatively in the cuvette holder. For studying Fd reduction by PSI, the reference cuvette contains only PSI so that the recording of the signal from the reference cuvette signal allows the large absorption changes due to P700+ formation to be subtracted, as well as the absorption changes due to reduction of the terminal PSI acceptor (FA and FB). Moreover, the absorption
changes due to the triplet carotenoid decay are also eliminated. For studying FNR or NiR reduction by Fd, the reference cuvette contains PSI and Fd. By subtracting the reference cuvette
signal, one can additionally eliminate the kinetics of Fd reduction by PSI. The signals shown in the main text and in Supporting Information are the averages of 24 to 32 measurements.
Phylogenetic Analysis
The sequences of [2Fe-2S] Fds from most cyanobacteria were obtained with the BLAST tool from JGI-IMG [55] by searching in 83 cyanobacterial “finished” genomes using the Fd1 sequence. Sequences from [2Fe-2S] Fds from maize, Arabidopsis thaliana and Chlamydomonas
reinhardtii were retrieved from Uniprot [56]. Sequence alignments were made with MUSCLE
and phylogenetic tree constructions with the neighbor-joining method, both provided in the SeaView integrated software V 4.7 [57]. In both cases, default parameters were used. Phylogenetic trees were visualized with ITOL [58].
RESULTS
Mass spectrometry
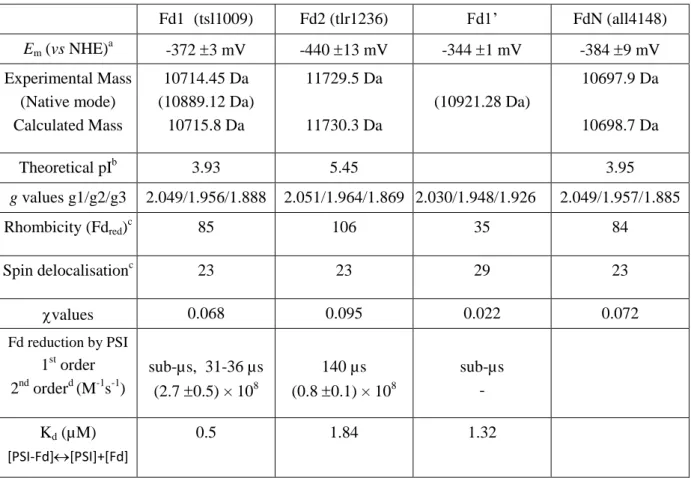
Fd1 and Fd2 were identified by their molecular masses determined at 10714.45 Da and 11729.5 Da by ESI-MS (Table 2, Supp. Figure 1). In whole cells, the ratio between Fd2 and Fd1 was estimated at 5% considering similar extinction coefficients for Fd1 at 425 nm and Fd2 at 418 nm [59] and neglecting possible loss of proteins during purification. Fd2 is thus a minor Fd in T.
elongatus. During purification, we found a very small fraction containing a Fd with specific
electronic and EPR properties. The experimental mass of this protein determined by ESI-MS in the native mode corresponded to Fd1 with the [2Fe-2S] cluster and a +32 Da mass adduct (Supp. Figure 1). This protein fraction likely corresponds to a post-translationally modified Fd1 and it was denoted Fd1’. The mass adduct was less present in the denaturing mode (Supp. Figure 1) and lost upon reduction of Fd1’ by dithionite (data not shown). It could correspond to a peroxidation or a persulfidation with the formation of a CysSSH side chain [60], since both modifications are prone to reversion [61]. Fd1’ could be the result of oxidative stress or a Fd fraction involved in signalization, since cysteine persulfidation was identified as a possible relay in H2S signaling
([60] and refs therein). The results obtained with Fd1’ are provided to the reader despite the fact that the small amount of Fd1’ did not enable some experiments to be performed for its characterization.
UV-visible spectra
The UV-Vis absorption spectra of the oxidized forms of Fd1, Fd1’, Fd2 and FdN are all typical of [2Fe-2S] type Fds and indicate a high degree of purity for the proteins (Figure 1A) [59]. Fd1 and FdN have almost identical UV-Vis spectra, with three main absorptions at 330, 425, and 470 nm and a shoulder at 520 nm. Fd2 shows a hypsochromic shift and a larger relative amplitude for the band at 418 nm, versus 425 nm for Fd1 and FdN. The spectrum of Fd1’ differs by a split of the UV band in two contributions at 320 and 355 nm, a slight bathochromic shift of the band at 428 nm and a larger relative amplitude of the 520-530 nm shoulder. The small changes in the near-UV and visible parts of the spectra are indicative of different electronic structures of the [2Fe-2S] clusters and hence of different interactions between the cluster and the protein.
EPR spectroscopy
The EPR spectra of reduced Fd1 and FdN are very similar, while the spectrum of Fd2 is slightly more rhombic and that of Fd1’ is significantly more axial (Figure 1B). The corresponding
g values and the degree of rhombicity calculated as reported in [62] are given in Table 2. In
reduced Fds, the Fe2+ is localized on one of the irons, Fe1, and the variation in rhombicity of the EPR spectra has been interpreted in terms of distortion of the Fe2+ tetrahedral environment, which results in variable mixing of some d orbitals of the Fe2+ ion [63]. The value = g2-g3 is correlated
with the mixing between the dz2 and the dx2-y2 orbitals allowed by the rhombic geometry. In
addition, the width of the g3 band, correlated with , was associated to the stiffness of the
[2Fe-2S] site [63]. The values obtained for Fd2, Fd1, and Fd1’ (=0.095, =0.068, and =0.022, respectively) suggest a larger stiffness of the [2Fe-2S] cluster in Fd1’ as compared to Fd1 or Fd2. A smaller value, as observed for Fd1’ and to a lesser extent for Fd1 when compared to Fd2, has also been associated to a stronger antiferromagnetic exchange interaction between the two high spin irons of the [2Fe-2S] cluster [63]. Cys to Ser mutation of one of the Cys ligands of Fe2 in FdN has been found to lead to an axial EPR spectrum and to a splitting of the 330 nm band, which show similarities with the spectral characteristics of Fd1’ [64], suggesting that the post-translational modification in Fd1’ could affect the environment of the Fe2 iron.
Redox potentials
The redox midpoint potentials of the Fds were determined by spectro-electrochemical titrations at equilibrium in the UV-Vis range (Table 2, Supp. Figure 2). The midpoint potential of FdN, -384 9 mV, is in full agreement with the literature [65]. The mid-point potential of Fd1, -372 3 mV, is close to that of FdN, and the midpoint potential of Fd1’ is slightly less negative, by 28 mV. Fd2 has a significantly lower redox midpoint potential than Fd1, at -440 ± 13 mV. For Fd2, a small hysteresis possibly due to slow dynamics of Fd exchange at the electrode led to differences in the reductive and oxidative titrations. However, this hysteresis was much smaller than the -70 mV difference between the midpoint potentials of Fd2 and Fd1 (Supp. Figure 2).
Crystal structure of Fd2
A thin plate crystal of Fd2 with a size of 130 µm x 50 µm x 10 µm (Supp. Figure 3) was used to collect the X-ray diffraction data. The crystal belongs to the space group P21 with unit
cell dimensions of a = 28.0 Å, b = 51.1 Å, c = 31.6 Å (Supp. Table 1). The phase information was obtained by the molecular replacement method using the structure of Fd1 as the search model (PDB ID: 5AUI [21]), and the structure was refined to a resolution of 1.38 Å with Rwork
and Rfree values of 0.1124 and 0.1570. For comparison, the structure of Fd1 from the same
cyanobacterium was also determined to a resolution of 1.55 Å.
The structure of Fd2 contains residues 2-108 (the full length of the protein is 108 residues), a [2Fe-2S] type iron-sulfur cluster, a tentatively assigned sulfate ion, and 109 water molecules (Figure 2A). The secondary structure of the domain contains three -helices: 1, Ile33-Ala39; 2, Pro75-Asp79; 3, Glu101-Leu105, one 310 helix: G1, Leu85-Ala87, and seven
-strands: 1, Val9-Asn16; 2, Leu21-His28; 3, Ala57-Lys62; 4, Val65-Gln67; 5, Phe82-Leu84; 6, Ala88-Pro90; 7, Cys94-Ser97. Five of the β-strands are arranged into a -sheet with the strand order of 2-1-7-3-5 in an antiparallel fashion, except 1 and . The -strands 4 and 6 are arranged antiparallel and connected to the main -sheet with an angle almost perpendicular to it (Figure 2A). The sulfate ion is probably needed for the crystal packing to fix the flexible N terminal loop structure by interaction with the loop structure, Gln67-Lys74. The electron density map at high resolution shows multiple conformations for amino acid side chains in some regions, in particular Val65, Asp66, Ser68, Asp69 and His70 as well as Val83, Cys94, and Ser97 (Supp. Figure 4).
The iron and sulfur atoms in the [2Fe-2S] cluster are clearly located in the Fd2 structure based on their 2Fo - Fc maps (Figure 2B). The mFo - DFc map showed some weak negative
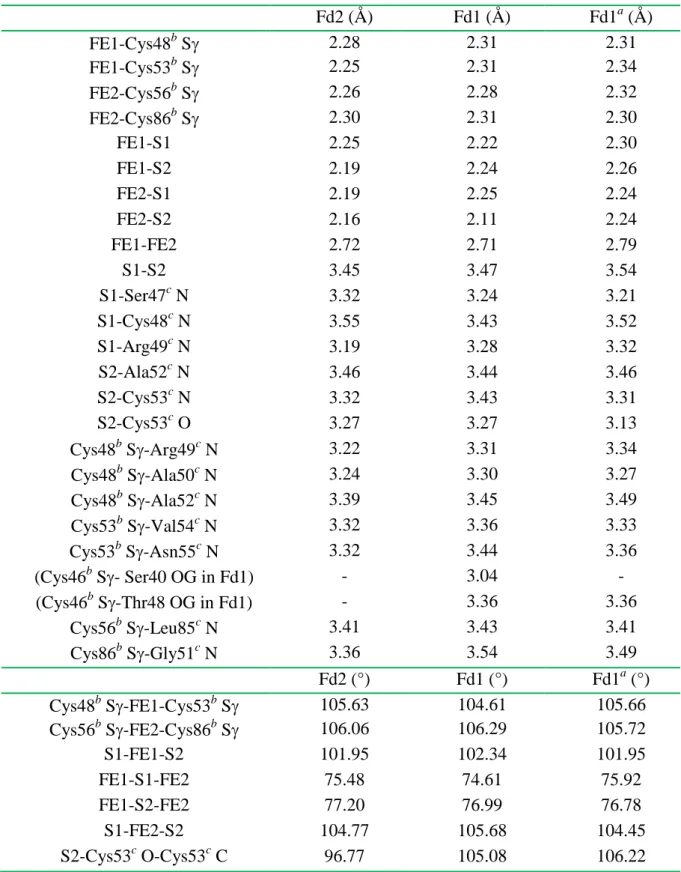
densities around the center of the cluster (Figure 2C), possibly caused by some X-ray irradiation damage during data collection, as the [2Fe-2S] cluster is very prone to radiation damage. As expected from the sequence alignment (Table 1), Cys48, Cys53, Cys56, and Cys86 are involved in the coordination of the cluster (Figures 2B and 2C). Cys48 and Cys53 are coordinated to the iron atom Fe1, and Cys56 and Cys86 to Fe2. The [2Fe-2S] cluster is located near the surface of the molecule and Fe1 and the sulfur atoms of Cys48 and Cys53 face the solvent. The bond lengths and angles among the iron-sulfur cluster atoms of Fd2 and Fd1 are summarized in Table 3. Bond lengths are in line with typical bond lengths of 2.30 Å and 2.24 Å reported in the literature between the iron and the S atoms of the cysteine residues, and between the iron and bridging sulfur atoms of the [2Fe-2S] cluster, respectively [6].
Structural comparison of Fd2 and Fd1
The structures of the two [2Fe-2S] clusters in Fd1 (PDBID: 5AUI [21] and this work) and Fd2 are not significantly different, although the overall structures of Fd2 and Fd1 exhibit relatively large differences in several regions. These differences include an additional N-terminal structure, Thr2-Asn7 in Fd2, two loop regions defined as loops 1 and 2, the α2-helix adjacent to loop 2, and the C-terminal region (Figures 3A-B, Supp. Figure 5).
On a global scale, the distribution of surface charges and the properties of the dipole moment are significantly different for Fd1 and Fd2 (Figures 3C-E). The surface charges are close to neutrality at the iron-sulfur center for Fd1 and Fd2. In contrast, the specific N-terminal extension and the loop 2 structure of Fd2 not only modify the overall shape of the protein but also result in a more positive surface charge distribution in this area than for Fd1. The magnitude and orientation of the dipole moment in Fd2, calculated as previously described [51], completely differs from that of Fd1 in which the dipole moment is close to that observed for other Fd1-type cyanobacterial Fds for which a 3D-structure has been reported (Figure 3E, data collected in Supp. Table 2). Remarkably, Fd2 has a small net charge of -6, versus -17 on average for the Fd1-type Fds. The magnitude of the dipole moment in Fd2, in both the oxidized and reduced states, is also larger than in Fd1-type Fds. Although the dipole moment in the heterocyst Fd from Nostoc PCC7120 has also a large magnitude, its orientation is very different from those of both Fd1 and
Fd2 (Figure 3E).
At the atomic scale, differences are noticeable between Fd1 and Fd2 in loop 1 and loop 2 and more generally in the hydrogen bonding interactions and orientation of key residues. The differences in loop 1 (Asn16-Leu21 of Fd2 or Arg9-Ser13 of Fd1) include the deletion of one amino acid in Fd1 as compared to Fd2 and the replacement of Pro11 in Fd1 by Glu17 in Fd2. This induces local differences in hydrogen bond patterns (Supp. Figure 6). Larger structural differences are observed for loop 2 (Gln67-Lys74 in Fd2 or Gln60-Asp67 in Fd1, Supp. Figure 7), with consequences on hydrogen bonding interactions involving the loop around the [2Fe-2S] cluster (Figure 4). The amino acid sequences are not much different but the loop 2 structures are quite different. These differences are caused by the bulkiness of His70 in Fd2 compared with Gln63 in Fd1, and by the very different orientation of the conserved phenylalanine side chain Phe72 in Fd2 as compared to Phe65 in Fd1. The specific orientation of Phe72 in Fd2 in turn results from the bulkiness of the Val54 residue in the Cys53ValAsnCys56 sequence of Fd2, as
compared to the Ser47 side chain in the corresponding Cys46SerThrCys49 sequence of Fd1
(Figure 4C). The different loop 2 structures are also due to different hydrogen bonding patterns derived from the different amino acids present in the Leu51-Lys73 sequence for Fd1 or Arg59-Ala80 sequence in Fd2 (Supp. Figure 7). In addition, in Fd2, residues Asp66 and Lys76 near loop 2 have interactions with residues Arg4 and Ala108 of the N- and C- terminus, respectively, which have no equivalents in Fd1 (Figure 4A).
Some hydrogen-bond connections to the [2Fe-2S] clusters are also different in Fd1 and Fd2 (Figure 4C and Table 3). The hydrogen bond between Cys46/S ligand of Fe1 and Thr48/O is specific of the Cys46Ser47Thr48Cys49 motif of Fd1 (Figure 4C). The bond angle and distance
between the bridging S2 and the Cys53 peptide carbonyl C=O (corresponding to Cys46 in Fd1) are slightly different between Fd1 and Fd2, as well as the hydrogen bonding distances between S1 and the peptide NH groups of Ser47 and Arg49. The distances between Cys48/S and the peptide groups of Arg49, Ala50 and Ala52 are slightly shorter in Fd2 as compared to Fd1 (Table 3). The distance Cys86S-Gly51N is also shorter in Fd2. These differences probably result in part from different interactions formed by the side chains of Arg49 and Arg42 in Fd2 and Fd1, respectively (Figure 4A-B).
Other significant differences in hydrogen bonding connections are present in some regions of the two Fds. The hydrogen bond of Gly51 with Phe72 in Fd2 is replaced by an H-bond
between the homologous Gly44 and Ser64 in Fd1 (Figure 4C). The interaction between Ser68 and Ala87 is observed only in Fd2 (Fd2 numbering), while hydrogen-bonding interactions between Tyr25 and Asp62, Glu31 and Leu35, Cys49 and Thr78, and between Ser47, Glu94 and Tyr98 are observed only in Fd1 (Fd1 numbering, Figure 4B). These different connections seem to be caused by the differences in amino acid residues Pro43Asp, Tyr46Phe, Val54Ser and Asn55Thr in the CysValAsnCys (Fd2) or CysSerThrCys (Fd1) motifs, as well as His70Gln, Leu85Thr and Ala87Val, or orientation differences such as those of Arg49 and Phe72, between Fd2 and Fd1 (Fd2 numbering).
The structural properties of Fd2 are thus very different from previously reported Fds structures from cyanobacteria both at the global and molecular or atomic scale. These differences will be further discussed in relation with the redox and electron transfer properties of Fd1 and Fd2.
Vibrational properties determined by FTIR difference spectroscopy
Structural differences between Fd1 and Fd2 and structural changes associated to the redox changes of the [2Fe-2S] cluster were also identified using FTIR difference spectroscopy coupled with electrochemistry in the mid- and far- infrared regions. The Mid-IR range gives information on protein conformation and on amino acid side-chain modes, while the metal-ligand signatures of the [2Fe-2S] center are contributing in the Far-IR domain.
In the Mid-IR range, the reduced-minus-oxidized spectra recorded with all the Fds are dominated by contributions from peptide (C=O) Amide I and (CN) + (NH) Amide II vibrational modes at 1700-1620 cm-1 and 1550-1500 cm-1, respectively (Figure 5), as shown by
1
H2O/2H2O exchange experiments (detailed in Supp. Figure 8). These bands correspond to a
minute reorganization of the protein backbone both on the active site loop and on the β-sheet structure. Contributions from β-sheet structures are inferred from the band at 1642-1638 cm-1
(Fdred) and those from loops or -helices from bands at 1668-1672 (Fdox) and 1653-1649 cm-1
(Fdred) [66]. The band at 1700-1692 cm-1 (Fdox) corresponds to carbonyl group(s) free of
hydrogen bonding interactions. These amide bands probably result in part from changes in the strength of hydrogen bonding interactions between the Cys ligands of the [2Fe-2S] cluster and peptide carbonyl groups upon Fds reduction.
Spectra recorded with Fd1 and FdN are strikingly similar, not only in the amide range but also in a fingerprint region below 1400 cm-1, where mainly amino acid side-chain modes are
expected to contribute (Figure 5). This indicates very similar structural reorganization upon [2Fe-2S] oxidation/reduction in Fd1 and FdN and similar redox-sensitive amino acids. The spectrum obtained with Fd1’ is also highly similar to that of Fd1 in the 1800-1000 cm-1
range. Small redox-sensitive structural differences between Fd1 and Fd1’ are observed at the level of a loop and/or -helix with a Fd1’ upshift by 1 cm-1 of the band at 1668/1653 cm-1 and differences in the relative amplitude of bands at 1566, 1551, 1528 and 1522-1520 cm-1 [66].
The FTIR difference spectra recorded with Fd1 and Fd2 in H2O and in 2H2O (Figure 5 and
Supp. Figure 8) present an overall similarity, although significant differences are observed both in the Amide I and Amide II regions as well as below 1400 cm-1. Bands at 1668, 1652 and 1640 cm-1 in Fd1 appear upshifted by 1-4 cm-1 in Fd2 and the band at 1698 cm-1 is more clearly split into two contributions at 1692 and 1705 cm-1 for Fd2ox. Different frequencies are also observed in
the Amide II range for Fd2red at 1554 and 1525 cm-1 in H2O and at 1433 and 1406 cm-1 in 2H2O
for Fd2ox (Supp. Figure 8). These spectral differences point to slightly different properties of the
peptide bonds and notably of the β-sheet structure in Fd2 or of their minute reorganization upon reduction. The frequency of amide carbonyl groups from β-sheet structures has been correlated to the β-sheet twist angle [67-69]. The slightly higher frequency observed at 1642 cm-1 for Fd2 suggests a very small increase in this twist angle in Fd2.
The effect of 1H2O/2H2O exchange also suggests contributions from side-chains of
tyrosine, aspartate and/or glutamate in the 1576-1504 cm-1 range, which show different frequencies for Fd1 and Fd2 (Supp. Figure 8A). In addition, below 1400 cm-1, bands at 1295/1279 cm-1 and at 1074-72/1063 cm-1 observed for Fd1, Fd1’ and FdN but not for Fd2 are tentatively assigned to a redox-sensitive Thr or Ser side-chain (Supp. Figure 8B). They are therefore proposed to arise from the Cys46SerThrCys49 motif in direct interaction with the
[2Fe-2S] cluster, which is not conserved in Fd2.
Surprisingly, a band shift from 2567 cm-1 to 2548 cm-1 is observed for Fd1 and Fd1’ but not for FdN or Fd2 (Figure 5 insets). This band is characteristic of the (SH) mode of a cysteine side chain [70] and the -19 cm-1 downshift upon Fd1 reduction indicates a stronger hydrogen bonding interaction in reduced Fd1. This band could be due to Cys87 not involved in coordination of the [2Fe-2S] cluster in Fd1, since this cysteine has no equivalent in FdN. The Cys87 side-chain is at hydrogen bonding distance to the carbonyl oxygen of Glu57 in our new Fd1 structure (3.14 Å, Supp. Figure 9, the structure PDBID: 5AUI [21] has a Cys-SOH group at
this position). The (SH) band is not detected for Fd2, although the Cys is conserved (Cys94) and at hydrogen bonding distance to the carbonyl oxygen of Thr64 (3.05 Å, Supp. Figure 9). Since two electron densities are observed for the Cys94 side chain in the Fd2 structure, as well as for residues Val65-His70 located just after Thr64 (see above), some flexibility probably exists in this region that could impair the formation of a strong hydrogen bond and explain the absence of a (S-H) band in the FTIR spectrum. Alternately, the (S-H) band may result from a specific interaction between the Cys46 ligand of the [2Fe-2S] cluster and Ser40 and Thr48 in Fd1, as revealed in the new Fd1 structure (Supp. Figure 10 and descriptions of the new Fd1 structure in Supp. Figure 11). In this structure, in addition to a conformation involving an hydrogen bonding interaction between Ser40 and Glu31 from the adjacent molecule, as reported in [21] and probably caused by crystal packing, we observe a second conformation of Ser40 in interaction with Cys46 and Thr48 (Supp. Figure 10B). This later conformation likely represents the structure in solution without the effect of crystal packing. Proximity between Cys46 and Ser40 was not found in FdN in spite of their similar amino acid sequences. This is probably due to the different orientations of Arg42 and Phe39 between Fd1 and FdN, which brings the backbone of Ser41 in FdN closer to the [2Fe-2S] cluster and forces Ser41-OG orientation toward outside of the cluster (Supp. Figure 10B). In Fd2, the orientation of Ser47-OG is also different, because Thr48 in Fd1 is replaced by Asn55, in Fd2. Thus we cannot exclude that the (S-H) IR mode may account for a protonated Cys46-S stabilized by a strong and specific hydrogen bonding interaction with the Ser40-OG in Fd1.
In the Far-IR range, the spectra recorded with FdN and Fd1 are almost identical both in shape and in band frequencies, except for a difference band at 554/540 cm-1 present only in Fd1 (Figure 6, see band assignments in Table 4). The spectrum recorded with Fd2 has the same overall shape, but some bands appear at significant different frequencies. Above 450 cm-1, far-IR bands are associated to contributions from the peptide –CO–NH– moiety (Amide IV-VI bands) and amino acid side-chains. We assign the main bands at 581 and 507 cm-1 for Fd1ox and FdNox
to Amide IV-VI modes associated to peptide bonds. The Amide IV-VI modes are very sensitive to the peptide bond properties and conformation and are up-shifted upon hydrogen bond strengthening [71-73]. These bands appear at +11 and +6 cm-1, respectively, for Fd2ox, suggesting
that the redox-sensitive peptide groups are involved in stronger hydrogen bonding interactions in Fd2 than in Fd1 or FdN.
The Cys4Fe2S2 cluster contributes to bands below 450 cm-1. The (Fe-Sb2) IR modes
involving the bridging sulfurs are assigned at 423-424, 388-389 and 360 cm-1 for Fd1ox or FdNox
(i.e. B2u, Ag and B3u modes, Table 4) and at 397-398, 380 and 311 cm-1 for Fd1red or FdNred, in
agreement with the literature [74-77]. The large frequency downshift of the (Fe-Sb) modes upon Fd reduction is in line with structural data on FdN, which show that the largest change upon reduction of the [2Fe-2S] cluster is related with the Fe1-Sb distances and the positions of the Fe1 atom and S2 bridging sulfur [14].
The (Fe-Sb) mode frequencies are very similar for Fd1 and Fd2 both in the oxidized and reduced states (Table 4). This indicates almost similar properties of the Fe-Sb bonds in reduced and oxidized Fd1 and Fd2. In contrast, significant differences are observed between Fd1 (or FdN) and Fd2 for modes involving (Fe-St) contributions. The (Fe-St) mode contributes at 349 cm-1 for Fd2ox (B1u mode, [75, 76, 78, 79]) and at significantly higher frequency in Fd1ox or FdNox, as
a shoulder at ~356 cm-1, almost superimposed to the (Fe-Sb) mode at 360 cm-1. For reduced Fds, the B1ut and B3ut modes involving (FeIII-St) and (FeII-St) vibrations, respectively [74]
contribute at 321-320 and 278-276 cm-1 for FdNred and Fd1red, and at 316 and 270 cm-1 for Fd2red.
The significantly lower (Fe-St) mode frequency for Fd2 in both the oxidized and reduced forms, points to weaker Fe-St interactions in Fd2 or different geometries of Fe-Cys bonds, since the (Fe-St) mode is coupled with the SCC bending mode of the cysteine ligand and this coupling depends on the Fe-S-C-C dihedral angle [74, 80]. In addition, the effect of 1H2O/2H2O exchange
on the (FeII-St) mode of reduced Fd is smaller and in opposite directions for Fd2 as compared to Fd1 (Table 4). A larger effect of 1H/2H exchange on the Raman bands of the Cys4Fe2S2 cluster
has been taken as indicative of stronger cluster interaction with the peptide moiety of the protein [74, 77].
The Far-IR data thus show that main differences between Fd1 (or FdN) and Fd2 concern the interactions between the [2Fe-2S] cluster and the cysteine ligands both in the oxidized and reduced states. These data are in line with the structural data of the oxidized proteins.
2
Kinetics of Fd reduction by photosystem I
Electron transfer kinetics from PSI to Fds were compared for Fd1, Fd2 and Fd1' from T.
elongatus. Photoinduced charge separation and stabilization in PSI lead to the formation of the
state P700+-(FA FB)1red within a few hundreds of nanoseconds ((FA FB)1red = singly reduced (FA
FB)).3 FB is the direct partner of Fd during forward electron transfer (ET). The kinetics of Fd
reduction by FB- have submicrosecond and microsecond phases in the first-order kinetics that
correspond to Fd bound to PSI prior to the laser flash illumination and a slower second-order [Fd]-dependent phase that corresponds to Fd reduction preceded by diffusion-limited binding of Fd to PSI.
The kinetics of Fd reduction have long been studied by flash-absorption spectroscopy with PSI and Fd from the cyanobacterium Syn. 6803 [52, 81] and more recently, in T. elongatus [51, 82]. The present measurements were performed at 580 nm, a wavelength where Fd reduction by (FA FB)1red results in a decrease in the absorption. The dissociation constant Kd of the PSI:Fd
complex "at rest", i.e. with the terminal PSI acceptor (FA FB) and Fd both oxidized, the first-order
ET rate(s) and the second-order kinetics of Fdox reduction by PSI are given in Table 2. Several
differences are observed between the three Fds.
First, the Kd values of Fd2 (1.84 µM) and of Fd1' (1.32 µM) are ~ 3 times larger than that
of Fd1 (0.5 µM) (Supp. Figure 13). The present value of Kd(Fd1) is slightly smaller than the
value of 0.76 µM recently determined [51]. This is very likely due to the use of different preparations of PSI trimers, since Kd values from 0.2 to 0.8 µM were reported for different
preparations of PSI trimers from Syn. 6803 [52]. In the present work, the same PSI preparation was used for comparing Fd1 and Fd2 whereas Fd1' was studied with another PSI preparation.
Second, the first-order intracomplex ET kinetics (Figure 7, series of Fd2 kinetics in Supp. Figure 12) significantly differ with the three Fds. These kinetics were obtained by subtracting the signal recorded with PSI alone from those recorded with PSI and the different Fds (original kinetic data and Kd titration curves in Supp. Figures 12-13). With Fd1, a kinetically non-resolved
sub-µs component appearing as a step-like negative signal and a component with a t1/2 of ~ 33 µs
are observed. The presence of only one µs component, instead of two in a previous report [51] has no consequences on the interpretation of the present data. Reduction kinetics of Fd1’ are
3
P700 is a dimer of chlorophyll a molecules located on the lumenal side of the photosynthetic membrane. FA and FB are both [4Fe-4S] clusters in sub-µs redox equilibrium, borne by the PSI
mostly in the sub-µs range with possibly a minor µs component, while with Fd2 no sub-µs component is present and the sub-ms decay kinetics can be fitted with a single phase with a t1/2 of
140 µs. The midpoint potentials of the different Fds increase from Fd2 to Fd1 to Fd1' (Table 2). Therefore, it appears that the rates of intracomplex Fd reduction increase with the driving force for ET from (FA FB)1red to Fdox, as expected.
Third, the association rate constant kon obtained from the second-order kinetics is ~ 3-fold
smaller for Fd2 (0.8 0.1 108 M-1 s-1; Supp. Figure 12) than for Fd1 (2.7 0.5 108 M-1s-1) [51]. This difference may be attributed to the differences in the global charges or protein dipoles between Fd2 and Fd1. Kon could not be reliably determined in the case of Fd1', due to the lack of
protein. Albeit these different kinetic properties, we can conclude that Fd2 can be efficiently reduced by PSI.
Kinetics of Fdred oxidation by ferredoxin-NADP+-oxidoreductase (FNR)
In vitro kinetic studies of Fdred oxidation by soluble partners have been reported in the
case of FNR [24], NiR [54] and nitrate reductase [83]. A similar approach has been performed here. Flash-induced absorption kinetics are recorded using mixtures of PSI, Fd and the Fd-partner. In these conditions, the soluble partners FNR and NiR are reduced after Fdred dissociation
from PSI and then diffusion to FNR or NiR. This corresponds to photosynthetic conditions, where the PSI-acceptor side reactions are initiated by PSI photoexcitation followed by Fd reduction, Fdred dissociation and partners reduction. In such experiments, however, only
association rates can be studied for FNR and NiR reduction by Fdred.
FNR reduction by Fd1red and Fd2red was measured by flash-absorption spectroscopy at
580 nm (Figure 8). Under photosynthetic conditions, FNR catalyzes the 2-electron reduction of NADP+ into NADPH by hydride transfer from its fully reduced form containing FADH- to NADP+ [84]. The catalytic cycle involves sequential reduction of FAD by Fdred, with Fd binding
to FNR at a single site. The intermediate semiquinone redox state of FNR, FNRsq, contains
FADH• which strongly absorbs at 580 nm, whereas FADH- does not. In the present experiments performed in the absence of the NADP+ substrate, FNR is in large excess over PSI and hence over the Fdred produced after a single PSI turnover flash. It can then be hypothesized that FNRsq
case of Fd2) and FADH- since the binding of a second Fdred would be required following the
dissociation of the firstly-bound Fd from FNRsq.
Remarkably, a much slower FNRsq formation is observed with Fd2red than with Fd1red
(Figure 8). The signal at 1 ms, a time where mostly irreversible and single reduction of FNR is occurring (see further explanations below), is thus 100-times larger with Fd1 than with Fd2 (see numbers in Figure 8 legend).
However, for a quantitative comparison of the second-order rate constants kon of FNR
reduction by Fd1red or Fd2red, one must take into account the fact that the full extent of FNRsq
formation is observed neither with Fd1 nor with Fd2. Indeed, this full extent would give a signal corresponding to the red line in Figure 8 (see Supp. Figure 14 for the procedure to measure this signal level). The reasons for the incomplete formation of FNRsq are likely different for Fd1 and
Fd2. In the case of Fd1, this is attributed to an incomplete forward reaction in the equilibrium Fd1red + FNRox Fd1ox + FNRsq, due to the small value of the reaction constant (Keq = 1.26,
corresponding to ~ 72 % of FNRsq formation in the conditions of Figure 8; see Supp. Figure 14
for the Keq determination). Such an incomplete reaction is consistent with the small difference in
midpoint potentials between Fd1red (Em = -370 mV) and previously reported values of
Em(FNRox/FNRsq) at pH 8.0, e.g. -402 mV for spinach FNR [85] and -378 mV for Syn. 6803 FNR
[24]. Indeed, with Keq = 1.26, one can estimate the Em(FNRox/FNRsq) at -364 mV, very close to
that of Fd1: Em(FNRox/FNRsq) = Em(Fdox/Fdred) + (RT/F) × Ln(Keq).
In the case of Fd2, which has a midpoint potential at ~ -440 mV, significantly lower than that of the (FNRox/FNRsq) couple, Keq should not be a limiting factor for FNR reduction. In this
case, we hypothesize that the first step of FNR reduction by Fdred is so slow that the probability
of a second FNR reduction, via slow Fd-catalyzed dismutation of FNRsq [24] cannot be neglected. This means that during the full Fdred oxidation, some FNRred is formed together with FNRsq, thus
decreasing the final amount of FNRsq and consequently the 580 nm signal amplitude. The final
amount of FNRsq formed at long times (> 100 ms) in the presence of Fd2 may also be decreased
by slow processes such as O2 reduction by Fdred and FNRsq, or electron recombination between
P700+ and Fd2red, via uphill population of (FA FB)1red from Fd2red.
Therefore the kon values were determined by fitting only the initial formation of FNRsq
with the constraint that the extrapolated fitted amplitudes should correspond to 100% of FNRsq.
transfer from FNRsq to Fdox in the case of Fd1) nor the second FNR reduction (in the case of Fd2), nor Fdred/FNRsq oxidation by O2, nor recombination between P700+ and Fdred, should be
significant at the onset of FNRsq formation.
A monoexponential rate kobs of 3.6 s-1 was thus obtained for Fd2 (trace bfit). From this rate
and under the present conditions of first-order approximation ([FNRox] = 7.79 µM >> [Fdred], kobs
= kon × [FNR]), we obtained a rate constant kon of 4.6 × 10⁵ M-1s-1 for Fd2 (Table 5).
For Fd1, the initial signal rise is sigmoidal, which indicates the presence of a limiting step preceding FNRsq formation. One can exclude Fdred dissociation from PSI, as its rate is larger than
1 × 10⁴ s-1 [51], which is too large to contribute to the signal sigmoidicity. Therefore, the rate-limiting reaction should occur after Fdred association to FNRox, according to the reaction scheme:
Fdred + FNRox → Fdred:FNRox → Fdox:FNRsq. The rate limiting reaction could be first-order
intracomplex ET itself or any step preceding it, as a conformational gating, or coupled to it, as FAD protonation. Using this scheme and fitting both trace a (trace afit) and other kinetics
measured at different FNR concentrations between 0 and 0.5 ms (Supp. Figure 14C), we determined the rates kon = 4.1 × 10⁸ M-1s-1 and klimit = 640 s-1 for the two consecutive reactions.
This kon value has the same order of magnitude as that previously measured with Syn. 6803
partners (6.2 × 10⁸ M-1s-1, [24]).
Thus, the kon value of FNR reduction by Fdred is about three orders of magnitude smaller
for Fd2 than for Fd1. As a control experiment, we also measured the kinetics of FNR reduction by Fd2 in the presence of 1 mM NADP+. Kinetics were slightly faster than that without NADP+ with a 20% increase in the initial signal rise. This is consistent with the small effect of NADP+ addition previously observed with Syn. 6803 proteins [24].
Kinetics of Fdred oxidation by NiR
NiR reduces nitrite to ammonium in a six-electron reaction, where electrons are provided by Fdred one by one [86-88]. The NiR catalytic center is a siroheme, which becomes reduced after
single reduction by Fdred. The second cofactor of NiR, a [4Fe-4S] cluster, is most probably
involved as an electron-transfer relay between the Fd and the siroheme. To compare the reactivity of Fd1 and Fd2 with NiR, we used the approach described above for FNR. The flash-absorption changes were measured at 520 nm, a wavelength where a large part of the absorption changes is
attributed to Fdred oxidation with only a small contribution due to NiR (Figure 9) [54]. The
properties of the recombinant form of NiR from the green algae Chlamydomonas reinhardtii used here were found to be similar to those of spinach NiR [28], which itself has been studied by the same flash-absorption method with PSI and Fd from Syn. 6803 [54]. In this last study [50], the absorption changes were consistent with reduction of the siroheme of NiR, with only a minor contribution of the [4Fe-4S] cluster.
The kinetics of NiR reduction by Fd2 are slower than by Fd1, but the difference between the two Fds is much smaller than in the case of FNR (Figure 9). With both Fds, increasing the NiR concentration 2- and 4-fold led to faster kinetics but unchanged final amplitudes, which shows that the reverse reaction from NiR1red to Fdox can be neglected (Supp. Figure 15).
The kinetics of NiR reduction by Fd1 and Fd2 exhibit a sigmoidal shape. In the case of Fd1, the sigmoidicity can be attributed to Fdred dissociation from PSI following light-induced
reduction [51, 89]. We will assume that it is also the case for Fd2. In the absence of reverse reaction, the following simplified kinetic model can be used: PSI:Fdred → free Fdred + NiRox →
Fdox + NiR1red with rates koff and k2 for the first and second reactions, respectively. Using the
analytical expression derived from this scheme (see Supp. Figure 15), the following best-fit values were determined: (koff, k2) = (5313 s-1, 441 s-1) and (1398 s-1, 155 s-1) for Fd1 and Fd2,
respectively. Notably, koff(Fd1) is smaller here than when studying FNR reduction (koff > 1 × 10⁴
s-1), as reported in [3], because of the different salt concentrations and the presence of mannitol. From k2, the second-order rate constants kon of NiR reduction (= k2/[NiR]) were calculated to be
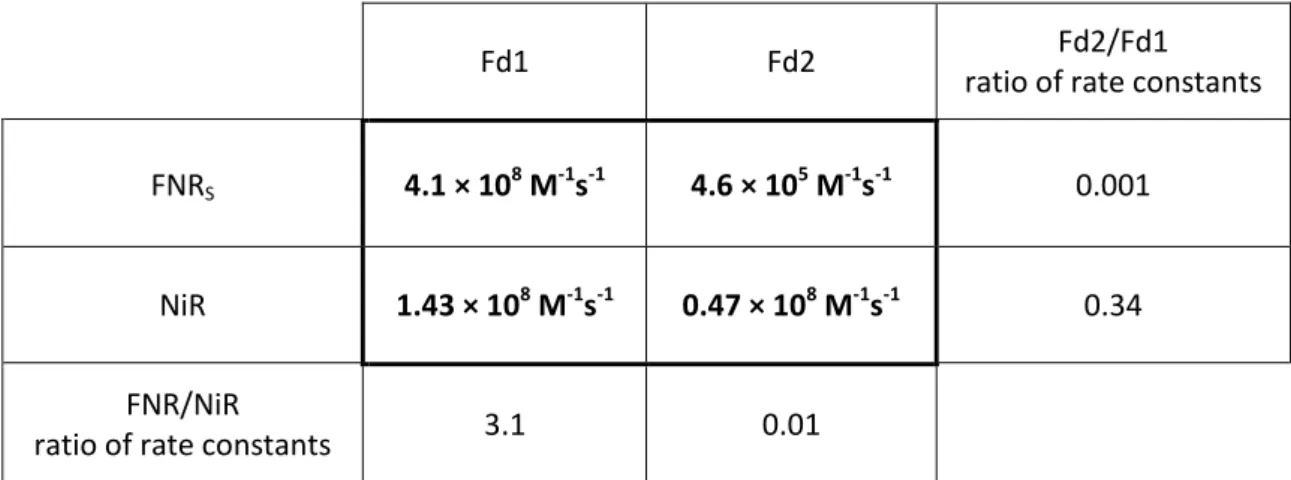
1.42 x 10⁸ M-1s-1 and 0.50 × 10⁸ M-1s-1 for Fd1 and Fd2, respectively. Moreover, by fitting kinetics at three different NiR concentrations with a global-fit procedure for each Fd, similar rate constants were obtained with kon values of 1.43 × 10⁸ M-1s-1 and 0.47 × 10⁸ M-1s-1 for Fd1 and
Fd2, respectively (see Supp. Figure 15). The Fd1 kon value is rather similar to that previously
found for the spinach enzyme (2.6 × 10⁸ M-1s-1, [54]) whereas the Fd2 kon is about 3-times
smaller than that of Fd1. These kon values, as well as those measured with FNR, are summarized
in Table 5. The table also displays ratios of kon values showing how a given partner discriminates
between Fd1 and Fd2 (ratio Fd2/Fd1) and how a given Fd discriminates between FNR and NiR (ratio FNR/NiR).
A phylogenetic analysis of Fd2-like Fds in cyanobacteria was performed in 83 different cyanobacterial strains (for a total of 342 sequences), plus [2Fe-2S] Fds from a few eukaryotic Fds (the alga C. reinhardtii, the C3 plant A. thaliana and the C4 plant maize), for a total of 357 sequences. The phylogenetic tree is shown in Supp. Figure 16A and a partial tree with only 26 different cyanobacterial strains is shown in Figure 10 (see below how these 26 strains were chosen).
Interestingly, large branches can be defined by amino acids present at two positions, referred to as X and Y, and the branches were colored according to the identity of these amino acids. These positions were found to be important to distinguish Fd2 from Fd1. Position X corresponds to the residue following the second cysteine ligand (in the order of the amino-acid sequence) of the [2Fe-2S] cluster: Ser47 of the Cys46Ser47Thr48Cys49 motif in Fd1 and Val54 of
the Cys53Val54Asn55Cys56 motif in Fd2. Position Y corresponds to the Phe residue that was found
to be essential for FNR reduction by Fdred in previous studies: Phe65 and Phe72 in Fd1 and Fd2,
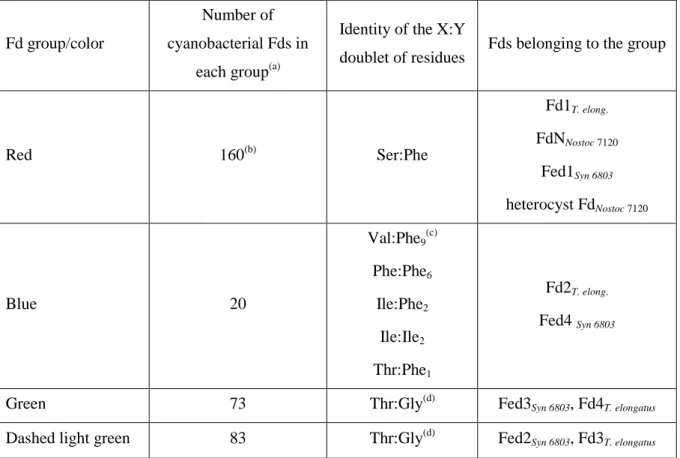
respectively [18]. Sequence alignment shows that, for the vast majority of Fds, the positions X and Y are occupied by only two residues in each case and moreover the identity of the residues at the two positions is highly correlated (Table 6). Thus 47% and 46% of cyanobacterial Fds have X:Y = Ser:Phe (colored in red) or Thr:Gly (colored in green), respectively, corresponding to 160 and 156 sequences out of 342, respectively. Whereas Fd1 belongs to the first class (X:Y = Ser:Phe), Fd2, with X:Y = Val:Phe, is relatively atypical, as it does not belong to a major group. However, from the phylogenetic tree, Fd2 appears to belong to a well-defined sub branch of the red branch, which was colored in blue and contains 20 different Fds. In this blue branch, X:Y can take several values, the most frequent being Val:Phe, as in Fd2. Most of the other members of this group have Y = Phe (except 2 with Ile) whereas the identity of X is more variable (beside Val: Phe, Ile and Thr). It appears that in all cases, the side chain of X is bulkier than that of Ser.
The partial tree shown in Figure 10 is made with all Fds from the 17 strains having a "blue" Fd plus those from 9 diverse strains, including Nostoc sp. PCC7120 and some being commonly studied. The tree structure is highly similar to that of the large tree and differs essentially only by the over-representation of "blue" Fds. Both trees suffer from relatively low bootstrap values, although those of the partial tree are better, especially regarding the base of the red branch. Low bootstrap values may be explained by the short size of Fd, which prevents to deduce any clear phylogenetic relationship. However, it is of note that the bootstrap value for the
base of the blue branch is higher than for most red branches, which suggests a common evolutionary origin. The green branch is subdivided in two sub-branches, marked in green and dashed light green, this last one exhibiting a relatively high bootstrap value. This branch includes Fed2 from Syn. 6803, which was found to be involved in the response to changing environmental iron concentrations [13], as well as Fd3 from T. elongatus. All Fds from this branch contain a C-terminal extension (Supp. Figure 16B for Fds from the partial tree).
With respect to the distribution of Fds, the following features are observable: all tested cyanobacteria possess at least one "red" Fd (X:Y = Ser:Phe), with one of these being presumably the main Fd isoform. They also possess one and only one Fd from the dashed light green group (X:Y = Thr:Gly, except in three cases where X:Y = Ser:Gly). Moreover, the vast majority of cyanobacteria possess one Fd from the continuous green group (Supp. Figure 16B for strains from the partial tree and Table 6). Fed3 from Syn. 6803 and Fd4 from T. elongatus belong to this group. To our knowledge, no member of this last group has been functionally characterized yet.
The "blue" Fds were found in only a subset, i.e. subclades B and E, of the seven subclades labelled A to G that were identified in a recent phylogenetic study of cyanobacteria (Figure 1 in [90], Supp. Figure 16C). Notably, these subclades are relatively distant whereas E appears to have split off early during evolution of cyanobacteria [90]. We therefore hypothesize that Fd orthologs to the "blue" ones have been lost in most cyanobacteria during evolution. Deletion mutants of Fed4, the homolog of Fd2 in Syn. 6803, showed that Fed4 is not essential for the survival and growth of the cyanobacteria under laboratory conditions [5]. This suggests that these Fds have a role associated with a specific physiology or with environmental conditions, which remain to be identified.
DISCUSSION:
The structural and physicochemical properties of the minor-type Fd2 from T. elongatus present significant differences with the main and well-characterized Fd1-type Fds. In addition to a significantly different structure, Fd2 has a redox potential more negative than that of Fd1, which lies at the lower edge of those measured for photosynthetic Fds. Fd2 has also a slightly more rhombic Fe1 environment and different redox-sensitive vibrational signatures of the amide bonds and of the [2Fe-2S] cluster environment. All these differences with Fd1 result in different
![Table 4. Vibrational modes of the [2Fe-2S]Cys 4 active site of Fds in the Far-IR domain](https://thumb-eu.123doks.com/thumbv2/123doknet/13326016.400373/41.892.97.796.169.534/table-vibrational-modes-cys-active-site-fds-domain.webp)