HAL Id: hal-01806820
https://hal.archives-ouvertes.fr/hal-01806820
Submitted on 26 May 2020
HAL is a multi-disciplinary open access
archive for the deposit and dissemination of
sci-entific research documents, whether they are
pub-lished or not. The documents may come from
teaching and research institutions in France or
abroad, or from public or private research centers.
L’archive ouverte pluridisciplinaire HAL, est
destinée au dépôt et à la diffusion de documents
scientifiques de niveau recherche, publiés ou non,
émanant des établissements d’enseignement et de
recherche français ou étrangers, des laboratoires
publics ou privés.
systems and their implications for phosphorus-use
efficiency
Fei Lun, Junguo Liu, Philippe Ciais, Thomas Nesme, Jinfeng Chang, Rong
Wang, Daniel Goll, Jordi Sardans, Josep Peñuelas, Michael Obersteiner
To cite this version:
Fei Lun, Junguo Liu, Philippe Ciais, Thomas Nesme, Jinfeng Chang, et al.. Global and regional
phosphorus budgets in agricultural systems and their implications for phosphorus-use efficiency. Earth
System Science Data, Copernicus Publications, 2018, 10 (1), pp.1 - 18. �10.5194/essd-10-1-2018�.
�hal-01806820�
https://doi.org/10.5194/essd-10-1-2018
© Author(s) 2018. This work is distributed under the Creative Commons Attribution 3.0 License.
Global and regional phosphorus budgets in agricultural
systems and their implications for
phosphorus-use efficiency
Fei Lun1, Junguo Liu2, Philippe Ciais3, Thomas Nesme4, Jinfeng Chang3, Rong Wang3, Daniel Goll3, Jordi Sardans5, Josep Peñuelas6, and Michael Obersteiner7
1College of Resources and Environmental Sciences, China Agricultural University, Beijing 100193, China 2School of Environmental Science and Engineering, South University of Science and Technology
of China, Shenzhen 518055, China
3IPSL – LSCE, CEA CNRS UVSQ, Centre d’Etudes Orme des Merisiers, 91191 Gif-sur-Yvette, France 4Bordeaux Sciences Agro, Université de Bordeaux, UMR 1391 ISPA, CS 40201,
33175 Gradignan CEDEX, France
5CREAF, Cerdanyola del Vallès 08193, Catalonia, Spain
6CSIC, Global Ecology Unit CREAF-CSIC-UAB, Cerdanyola del Vallès 08193, Catalonia, Spain 7International Institute for Applied Systems Analysis, 2361 Laxenburg, Austria
Correspondence:Junguo Liu (liujg@sustc.edu.cn, junguo.liu@gmail.com)
Received: 16 May 2017 – Discussion started: 6 June 2017
Revised: 31 October 2017 – Accepted: 21 November 2017 – Published: 8 January 2018
Abstract. The application of phosphorus (P) fertilizer to agricultural soils increased by 3.2 % annually from 2002 to 2010. We quantified in detail the P inputs and outputs of cropland and pasture and the P fluxes through human and livestock consumers of agricultural products on global, regional, and national scales from 2002 to 2010. Globally, half of the total P inputs into agricultural systems accumulated in agricultural soils during this period, with the rest lost to bodies of water through complex flows. Global P accumulation in agricultural soil increased from 2002 to 2010 despite decreases in 2008 and 2009, and the P accumulation occurred primarily in cropland. Despite the global increase in soil P, 32 % of the world’s cropland and 43 % of the pasture had soil P deficits. Increasing soil P deficits were found for African cropland vs. increasing P accumulation in eastern Asia. European and North American pasture had a soil P deficit because the continuous removal of biomass P by grazing exceeded P inputs. International trade played a significant role in P redistribution among countries through the flows of P in fertilizer and food among countries. Based on country-scale budgets and trends we pro-pose policy options to potentially mitigate regional P imbalances in agricultural soils, particularly by optimizing the use of phosphate fertilizer and the recycling of waste P. The trend of the increasing consumption of livestock products will require more P inputs to the agricultural system, implying a low P-use efficiency and aggravating P-stock scarcity in the future. The global and regional phosphorus budgets and their PUEs in agricultural systems are publicly available at https://doi.pangaea.de/10.1594/PANGAEA.875296.
1 Introduction
Population increases and dietary changes require higher food production, which increases global demand for fertilizers (Grote et al., 2005; Foley et al., 2011). Phosphorus (P) is an essential element for all organisms, and a lack of P limits growth. Fertilizer P enhances agricultural production, but P is also fixed in soils and can accumulate. In countries with high fertilizer use, much P is lost to leaching and run-off, leading to the eutrophication of both inland and coastal wa-ters (Carpenter et al., 1998; MacDonald et al., 2011).
To supply the growing need for P in fertilizer, the mining of phosphate rock has quadrupled in the past half century, in-creasing from 46 Mt in 1961 to 198 Mt in 2011 (Scholz et al., 2013). Despite some short-term fluctuations in the price of phosphate rock, the global production of fertilizer P has been steadily increasing at a rate of 3 to 4 % annually during the half century before 2011 and is projected to increase by 50 to 100 % by 2050 (Cordell et al., 2009, 2012). Extractable phosphate rock is a non-renewable resource, and significant depletion of the resource is projected by the end of this cen-tury if the current intensive use continues, possibly leading to resource shortages (Cordell et al., 2009; van Vuuren et al., 2010; Peñuelas et al., 2013).
The mining of P and its application as fertilizer in culti-vated land is a major anthropogenic perturbation of the nat-ural biogeochemical P cycle (Carpenter and Bennett, 2011; Elser and Bennett, 2011; Steffen et al., 2015). The negative impacts of this perturbation on the natural environment de-pend on how much P is lost from regions with intensive fer-tilizer use (Smil, 2000; Bennett et al., 2001).
P application differs significantly between countries and crop types (Grote et al., 2005), and previous researchers have attempted to estimate the P flows in agricultural systems in Europe (Ott & Rechberger, 2012), the United States (Suh & Yee, 2011), China (Ma et al., 2011), France (Senthilku-mar et al., 2012), Australia (Cordell et al., 2013), and the world (Smil, 2000; Liu et al., 2008; MacDonald et al., 2011; Schipanski & Bennett, 2012). International trade and re-gional agricultural policies affect P budgets by increasing or decreasing the gap between P inputs and P outputs in agri-cultural land (Grote et al., 2005). Previous research mainly focused on cropland, and P fluxes in pasture and livestock production systems have also received more and more atten-tion recently, especially due to diet change. The differences in methodologies, system boundaries, and data sources have made it difficult to assess the differences in the phosphorus-use efficiencies (PUEs) among agricultural sectors and to ex-trapolate regional findings to the global scale.
To mitigate these problems, we (1) compiled a detailed and harmonized dataset of P fluxes in agriculture for coun-tries around the world, including detailed analysis of input and output fluxes for cropland, managed grassland (here-after, pasture), livestock, and human consumers of agricul-tural products; (2) characterized P budgets and P-use
effi-ciencies in those different subsystems; and (3) examined how the international trade of phosphate fertilizer and agricultural commodities influences regional P fluxes. We performed this analysis on the scale of countries, regions, and the world; wherever possible, we distinguished different crop types. The study period was from 2002 to 2010, allowing us to study temporal trends.
2 Materials and methods
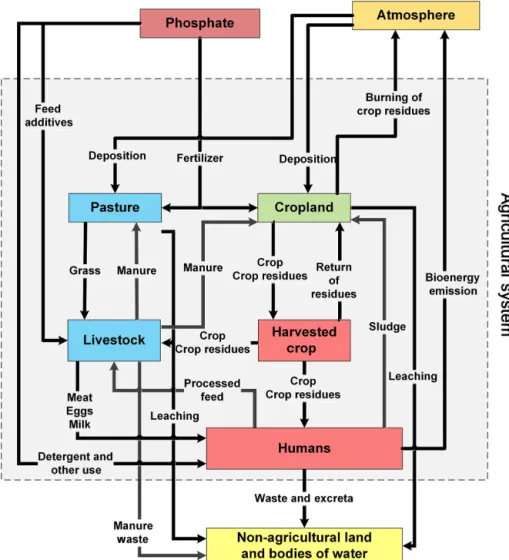
In this study, we obtained data for 224 countries (Table S1 in the Supplement). We defined the agriculture system as crop-land and pasture ecosystems plus human and livestock sumers of agricultural production and of other products con-taining P (Fig. 1). External P inputs to the agriculture system came from mined phosphate rock and atmospheric deposi-tion. Several processes cause P losses from the system into the external environment (here, defined as non-agricultural land and bodies of water). Figure 1 presents the fluxes of P into and out of the agriculture system on a global scale, in-cluding internal fluxes between ecosystems and consumers. We quantified these fluxes in the present study based on a mass-balance approach (Cordell et al., 2012). We defined the phosphorus-use efficiency (PUE) of the agricultural sys-tem and of its subsyssys-tems as the ratio of the total P harvested in economic outputs (e.g. crops, meat, milk, and eggs) to the total P input. International trade in fertilizer and food is discussed separately in Sect. 2.3. The data sources and an overview of the mass-balance equations are presented in the rest of this section; details and equations are presented in the Supplement.
2.1 P flows into and out of the agricultural system
Inputs into the agricultural system, which are within the grey box in Fig. 1, are from mined phosphate rocks and atmo-spheric deposition. We did not include P from the in situ weathering of soil particles because the rate of this process is insignificant compared with the magnitude of other inputs (Liu et al., 2008). Outputs included P emission into the at-mosphere from fires and P loss to uncultivated land or bodies of water.
2.1.1 P inputs
Data on agricultural inputs of phosphate P in fertilizers were collected from the International Fertilizer Industry Associ-ation (http://www.fertilizer.org) and divided between crop-land and pasture uses based on information from FAO (2002) and the FAOSTAT database (http://www.fao.org/faostat/en/ #data). A small fraction (8 %) of P from mined phosphate rock is used to produce animal feed additives. Apart from fertilizer and animal feed additives, the rest of the mined P is used to produce detergents and other products directly consumed by humans (Ringeval et al., 2014). Atmospheric
Figure 1.Scheme of the P pools and fluxes used to diagnose global P budgets for the agricultural sector. The agricultural sector (or system) in the grey box includes cropland and pasture soils, livestock, human consumers of livestock and crop products, and users of phosphate-derived products. National and regional P budgets are calculated using the same scheme, but including in addition exports and imports of P embedded in traded crop and livestock products and fertilizers.
P deposition in cropland and pasture areas was calculated separately in each country using gridded global P-deposition maps obtained using the LMDz-INCA aerosol chemistry transport model of Wang et al. (2014, 2015) and agricultural land-use maps. Details are provided in the Supplement (Ta-ble S2).
2.1.2 P outputs
P emissions from agricultural fires were obtained from the gridded dataset of Wang et al. (2015) and cover the burn-ing of crop residues in the field, by households, and for the production of bioenergy from crop biomass. Leaching from cropland and pasture soils was assumed to be a constant frac-tion (12.5 %) of P inputs for each agricultural land-use type (Bouwman et al., 2013). P outputs from non-recycled live-stock and human manure were calculated based on the mass
balance. Note that erosion-induced losses of P are important in many agricultural regions (Quinton et al., 2010), but were not considered in this study because we lack data on the re-deposition of P in eroded soil material from agricultural soils. In future studies, it will be important to quantify this source of P, particularly in agricultural areas that receive large an-nual inputs of sediment (e.g. in river floodplains and sites on steep terrain that experience significant erosion farther up the slope followed by deposition).
2.2 P flows within the agricultural system
2.2.1 P in harvested crop biomass and crop residues
The flux of P in harvested crop biomass was estimated from yield data (FAOSTAT) using crop-specific P concen-trations after grouping 178 different crops into 13 crop types (COMIFER, 2007; USDA-NRCS, 2009; Waller, 2010;
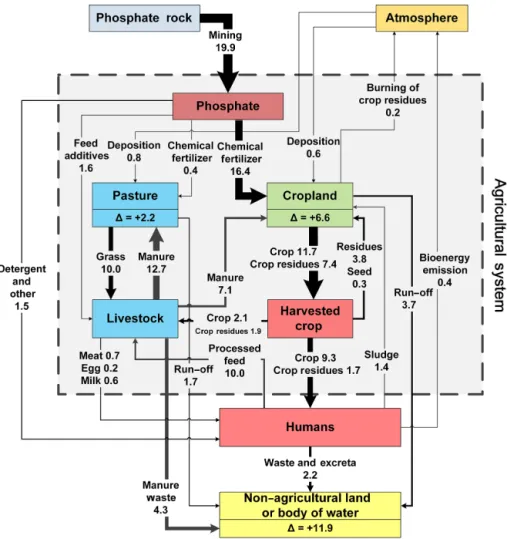
Figure 2.Annual P flows in the global agriculture system from 2002 to 2010. Values are Tg P yr−1. The notation 1 denotes the average change of P in pasture and cropland soils, respectively. By convention, a positive value means accumulation. Note that livestock and human changes of P are assumed to be zero.
Table S2). P in harvested crop biomass was partitioned into crops (for human and livestock consumption) and crop residues (Fig. 1). We estimated the P fluxes of crop residues from FAOSTAT data and from Liu et al. (2008) to account for residue that is recycled in the field (50 %), transformed into livestock feed (25 %), and burned or used by other human activities (25 %).
2.2.2 P in grazed biomass
The P removed from pasture by livestock grazing was esti-mated by combining forage grass consumption data with the P concentrations in grass biomass (Antikainen et al., 2005; COMIFER, 2007; USDA-NRCS, 2009; Waller, 2010). Grid-ded data on grass biomass consumption by livestock were ob-tained by combining the global livestock production systems dataset of Herrero et al. (2013) with pasture net primary pro-ductivity simulated by the ORCHIDEE-GM global pasture model (Chang et al., 2013, 2015). We chose the
ORCHIDEE-GM model for this analysis because it is able to separate the intake of grazed vs. cut forage grass.
2.2.3 P in animal feed products
Animal feed products used as complementary diet (“feed ad-ditives”) represent direct inputs to the livestock subsystem (Fig. 1). This flux was deduced from the mass balance of the known input and output fluxes for the livestock P pool, but did not account for long-term changes in P storage in that pool. See the Supplement for more details.
2.2.4 P embedded in livestock products
This flux of P leaving the livestock subsystem and entering the human subsystem (Fig. 1) through the harvesting of prod-ucts was calculated by multiplying the FAOSTAT production data for meat, eggs, and milk by the product-specific P con-centrations reported by Grote et al. (2005).
2.2.5 P in livestock manure
We calculated the manure P production based on FAOSTAT data about N in livestock manure and P : N values for each types of livestock manure (MWPS-18, 1985; OECD Secre-tariat, 1991; Levington Agriculture, 1997; Sheldrick et al., 2003; ASAE, 2005; see Table S3). Once produced, manure P is either applied to cropland, left in the pasture, or lost to the environment as waste (Fig. 1), following the same partition-ing as that for N in the manure from FAOSTAT.
2.2.6 P in human sewage sludge
We assumed that the P output from humans equaled the in-puts from non-fertilizer P-ore products and the consumed crop and livestock products (Fig. 1) and used this to calculate the total P production in human excreta. P in human sewage sludge was estimated using population data and values of per capita production of P in excreta (Smil, 2000; Cordell et al., 2009). Following the method of Liu et al. (2008), we assumed that 30 % of the excreta P from urban populations and 70 % of P from rural populations were returned to crop-land, either directly or after the treatment of sewage sludge, with the remaining P assumed to be lost to the environment (e.g. in landfills or bodies of water).
2.3 P flows from international trade
We compiled the flows of P in international trade both from the P embodied in crops and livestock products and in P em-bodied in fertilizers exchanged between countries. For agri-cultural commodities, we used FAOSTAT data that provided a matrix of commodities exchanged between countries and converted this data into P fluxes using commodity-specific P content data. For P fertilizers, we used the International Fer-tilizer Industry Association trade statistics. By convention, a positive trade balance for a country means that it is a net P importer. In addition, P fluxes associated with the inter-national trade of fertilizers, food, feed, and fibre commodi-ties can be associated with local cropland PUE and pasture PUE. We defined the dependency on chemical fertilizer im-ports (Ffer) as the ratio of the P in imported chemical
fertil-izers (Pfer-imp) to the P in all chemical fertilizers consumed
by a country (Pfer-con). Similarly, we defined the dependency
on food imports (Ffood) as the ratio of P in food imports
(Pfood-imp) to the P in all food consumed by a country.
Fur-thermore, we defined Ftotalas the ratio of the total P imported
(food and fertilizers) to the total P consumed as fertilizers and food in a country. The equations for these calculations are presented in Sects. 2 to 6 of the Supplement.
2.4 Annual P budgets of cropland and pasture soils
Annual changes in P stocks in cropland and pasture soils (1P ) were estimated as the difference between inputs and
outputs (i.e. the budget); 1P > 0 indicates net P accumula-tion in the soil, 1P < 0 indicates a net deficit, and 1P = 0 represents no net change. 1P calculated in this manner does not reflect the legacy effects from previous management and fertilization practices (Ringeval et al., 2014), but it is a use-ful metric to identify regions with a P surplus or deficit at any point in time and to compare countries.
Annual soil 1P values were calculated as the differences between annual inputs and outputs. Details and the equations are presented in Sect. 2 of the Supplement.
2.5 Cumulative P budgets of cropland and pasture soils
Following the method of Sattari et al. (2012), we separated the P inputs to soils (except inputs in seeds) into two pools: (1) a stable P pool, which represents P that is unavailable to plants on an annual basis, such as the P absorbed onto iron and aluminum oxides (20 % of total P inputs, including fer-tilizers, manure, sludge, and deposition); and (2) a labile P pool that is assumed to be available for plant uptake (80 % of total P inputs). P can be exchanged between the two pools. If inputs of labile P are larger than P removal in crop biomass, we assumed that the surplus labile P gets transferred into the stable P pool at the end of the year. In the opposite case, in which inputs of labile P are lower than P removal, plants can take up P from the stable pool (Sattari et al., 2012). This ap-proach assumes that the P loss by run-off and leaching into bodies of water is from the labile P pool only and that P stored in seeds does not belong to either the stable pool or the labile pool. This approach is simplistic, as more research will be required to allow for more realistic modelling of these two pools and the flows they are involved in.
2.6 Phosphorus-use efficiency
We defined PUE as the ratio of P in the harvested economic outputs to P in the inputs for the entire agricultural system (the grey area in Fig. 1) or for a given subsystem. PUE in-dicates how much of the input P is transferred into value-added products. If PUE > 1, the input of P is insufficient to sustain the output (harvested P), suggesting a net reduction of the system’s P reservoir. For cropland PUE, we defined P in harvested crops as the economic P output of the crops and the sum of phosphate fertilizer, livestock manure, human sewage sludge, and P from atmospheric deposition as the P input. For pasture PUE, harvested P refers to the P consumed by grazing animals and the sum of phosphate fertilizer, live-stock manure going to the pasture, and P from atmospheric deposition as the total inputs. For the livestock subsystem, the harvested P output represents the P in livestock products (meat, eggs, and milk), whereas the inputs represent the in-put into livestock. We also defined the PUE of human food (εfood) as the ratio of the P content in human excreta to the
total P input in human food; this represents an inconsistency with our previous definitions, since human excreta currently
have no economic value. The equations for all the PUE terms are provided in Sect. 5 of the Supplement.
2.7 Uncertainty estimates
Uncertainties in each flux originate both from the material flux data and from data on the P concentration in each ma-terial considered by our analysis, including crop products, crop residues, livestock, meat, eggs, milk, livestock, and hu-man excreta. Many of the global statistical datasets used in our analysis are not replicated, and no alternative dataset is available for establishing a range of uncertainty values for the different P fluxes. National datasets have usually not been formally analysed to determine their uncertainty, and many of the sources of uncertainty are difficult to trace (e.g. clerical errors, differences between countries in product definitions). Thus, we have only addressed the effect of uncertainties in the P concentration by means of Monte Carlo simulations (3000 iterations) using the range of P concentrations reported in the literature (Table S5).
3 Results
3.1 Global agricultural P flows and their trends 3.1.1 Global P fluxes in and out of the agricultural
system
Figure 2 summarizes the annual average of global P flows for the period from 2002 to 2010. P from phosphate fertil-izers was the largest single input flux, representing 93 % of the 21.3 Tg P yr−1 of global input, and most of it (82.4 %) goes to cropland and pasture. Outputs from the agriculture system amounted to 12.5 Tg P yr−1, which combines outputs from leaching and run-off into bodies of water (5.4), non-recycled manure waste (4.3), and sewage (2.2), bioenergy (0.4), and burned crop residues (0.2). The global annual P balance of agricultural systems was therefore positive dur-ing the entire study period, with 8.8 Tg P yr−1accumulating in soil, of which 6.6 Tg P yr−1accumulated in cropland and 2.2 Tg P yr−1in pasture. On average, 41 % of the P input ac-cumulated in soils from 2002 to 2010.
3.1.2 Temporal trends
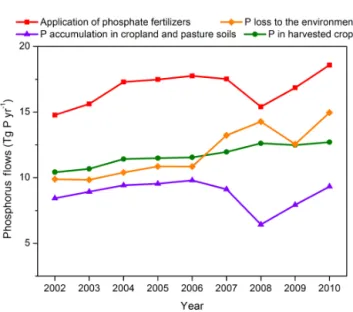
Figure 3 shows the trends for the four largest P fluxes in the agriculture system, illustrating that chemical fertilizer inputs, P loss to the environment, and P harvested in crops presented significantly increasing trends during this period. The appli-cation of phosphate fertilizer increased at an average annual rate of 3.2 % from 2002 to 2010 despite a decrease in 2008 that reflected reduced fertilizer application at a time when the price of phosphate fertilizers increased (Cordell et al., 2009, 2012). The trend for P in harvested crop biomass was also a steady increase, but at a lower annual rate (2.4 %) and with no decrease in 2008, probably because of the availability of
Figure 3.Time series in the four largest global annual P flows within, in, and out of the agriculture system from 2002 to 2010.
P that accumulated in the soil from previous years (as de-scribed in Sect. 2.5). Overall, P in agricultural soils increased by 1.3 % annually, whereas P losses to the environment in-creased faster (6.4 % yr−1) than fertilizer inputs.
3.1.3 Global P fluxes in cropland
Cropland received the largest fraction (82 %) of phosphate fertilizer, 29 % of the manure produced by livestock, and all of the recycled human sewage sludge (Fig. 2). Atmospheric deposition contributed an additional 0.6 Tg P yr−1 of inputs to croplands. Harvesting of cropland removed 11.7 Tg P yr−1, which can be divided into crop products used for human nu-trition (9.3 Tg P yr−1, including 5.3 for food, 2.7 for process-ing, 0.4 for waste, and 0.9 for other use) and for livestock feed (2.1 Tg P yr−1), with a small pool in seeds returned to the cropland (0.3 Tg P yr−1). On average, 50 % of the P con-tained in crop residues was recycled to cropland during the study period, with 0.2 Tg P yr−1lost to the atmosphere from the burning of crop residues. The remaining 3.6 Tg P yr−1 contained in harvested crop residues is removed from crop-land and redistributed to livestock and humans. Globally, 3.7 Tg P yr−1was lost from cropland soils through leaching and run-off. The sum of all these fluxes results in an annual soil P accumulation of 6.6 Tg P yr−1(Fig. 2).
The global cropland PUE averaged 0.46, with a maximum of 0.51 in 2008 and a minimum of 0.44 in 2006. The annual cropland P accumulation ratio (cropland soil P accumula-tion / total P input to cropland) was 23 %, which is lower than the accumulation ratio of 48 % found for the overall agricul-ture system. In countries where labile P inputs were lower than P removal in crops, the soil’s labile P pool was depleted by 1.9 Tg P yr−1 through the harvesting of crop biomass. In countries where labile P inputs are higher than P removal by
Figure 4.Map of global net soil P budgets (positive values, increase; negative values, decrease) for (a) cropland and (b) pasture.
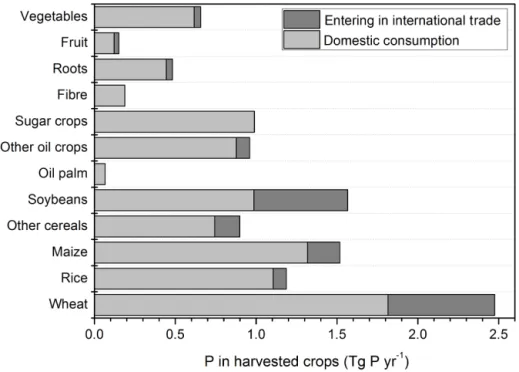
Figure 5.P flows embedded in different crop products, including the fraction of these flows entering into international trade circuits vs. being used for domestic consumption, for the year 2010.
crops, the accumulation of soil labile P was 6.0 Tg P yr−1. Thus, there is an asymmetry between these two groups of countries, with accumulation being larger than depletion on a global scale. In addition, the global stable P pool in crop-land increased by an average of 5.6 Tg P yr−1 from 2002 to 2010.
3.1.4 Global P fluxes in pasture
Different from croplands, most P inputs to pasture were from livestock manure (12.7 Tg P yr−1), with small additional con-tributions from atmospheric deposition (0.8 Tg P yr−1) and phosphate fertilizers (0.4 Tg P yr−1). The primary production of pasture incorporates 10.0 Tg P yr−1of P into grass biomass that is digested by animals, and the leaching and run-off loss
averages 1.7 Tg P yr−1. From all these fluxes, we estimated a global pasture PUE of 0.72 and a net accumulation of 2.2 Tg P yr−1in the soil. In the countries where grass P re-moval exceeded the labile P inputs, the labile soil P pool was depleted by 1.4 Tg P yr−1. In the countries where the labile P input exceeded grass P removal, an average of 5.3 Tg P yr−1 was transferred from the labile to the stable soil P pool from 2002 to 2010.
3.1.5 Global P fluxes in livestock
The annual P input to livestock was 25.6 Tg P yr−1, with most of the contributions from grazed grass (10.0 Tg P yr−1) and processed feed (10.0 Tg P yr−1). The economic P output in the form of livestock products averaged 1.5 Tg P yr−1, which
gives a PUE of 0.06. Averages of 29 and 56 % of the P pro-duced in livestock manure were recycled into cropland and pasture, respectively; the rest of this manure (4.3 Tg P yr−1) was lost to the environment.
3.1.6 Global P fluxes in human use
Humans receive an annual input of 14.0 Tg P yr−1from har-vested crop products, livestock products, and the use of de-tergents and other products manufactured from phosphate rock. Although P inputs as food (crop food and livestock products) amounted to 6.8 Tg P yr−1, humans only absorbed 3.0 Tg P yr−1(44 %); the remainder was either wasted before consumption (e.g. in food processing) or transferred back to livestock as processed feed. Thus, only 14.3 % of the total P inputs into the agriculture system end up as food being actually consumed by humans. P lost to the environment by human use amounts to 2.6 Tg P yr−1, which is divided among 2.2 Tg P yr−1lost through inefficient processing and excreta and 0.4 Tg P yr−1 through bioenergy-related emissions. The fate of non-recycled P in human waste was not separated be-tween bodies of water (untreated sewage) and landfills.
3.2 Regional P budgets
Globally, both cropland and pasture presented soil P accu-mulation from 2002 to 2010, with an accuaccu-mulation of 59.6 and 19.4 Tg P, respectively. For croplands, the net P accumu-lation in the stable P pools amounted to 52.7 Tg P, and the remaining 6.9 Tg P accumulated in soil labile pools. For pas-ture, the accumulation in the stable P pool was 25.0 Tg P, but 5.6 Tg P was transferred from the stable P pool to be incorpo-rated by grass in regions where P inputs are lower than grass P uptake.
Those global numbers mask large regional differences (Ta-ble 1 and Fig. 4) and there were also differences between cropland and grassland. About 32 % of the global cropland area (in 75 countries) had annual soil P deficits from 2002 to 2007, with a net cropland soil P accumulation of 6.20– 7.66 Tg P yr−1. This fraction increased to 50 % in 2008 and 2009 but the net cropland soil P accumulation decreased to 4.38 Tg P yr−1 in 2008 and 5.39 Tg P yr−1 at the time of the global financial crisis as a result of high P prices and the resulting reduction in fertilizer application (Cordell et al., 2009, 2012). However, the fraction of cropland soil P deficits returned close to the decadal mean value in 2010, with a net soil P accumulation of 7.30 Tg P yr−1. On aver-age, 48 % of cropland P uptake was supplied by stable P that accumulated in previous years according to the equations in Sect. 3 of the Supplement. Including the United States, France, Russia, Argentina, and Paraguay, 89 countries had labile P inputs into cropland that were lower than crop P re-moval from 2002 to 2010. However, if we consider stable P inputs, cropland soil still presented a net soil P surplus in the United States during the same period. Compared with
cropland, a slightly larger proportion of the total global pas-ture area had a net annual soil P deficit from 2002 to 2010, mostly in Europe and North America. The deficit proportion of grassland was only about 38 % in 2002 and 2003, with an annual net soil P accumulation of 2.26 Tg P yr−1; however, it increased to 43 % during the period of 2004–2010 and the annual pasture soil P accumulation was about 2.10 Tg P yr−1, with the smallest of 2.00 Tg P yr−1in 2009. However, only 48 countries had labile P inputs into pasture that were lower than the P removal in grass.
3.2.1 Regional cropland budgets
Examining Fig. 4a reveals that cropland in all African coun-tries experienced an annual soil P deficit, especially in west-ern and central Africa, with soil P loss rates per unit area ranging from 2.5 kg P ha−1yr−1in 2002 to 2.7 kg P ha−1yr−1 in 2010. In contrast, cropland in eastern Asia accumulated 23.4 kg P ha−1yr−1 during the period from 2002 to 2010, a cumulative storage equivalent to more than 4 years of P fertilizer application. Cropland in Oceania, Europe, and the Caribbean and Central America also annually accumulated P in their soils. Cropland soils in North America and South America accumulated P from 2002 to 2007, but experienced temporary P deficits from 2008 to 2010. Yet despite this, crop yields did not decrease from 2008 to 2010 in those two regions, probably because of the re-mobilization of P that accumulated in stable pools. Cropland soils in western and central Asia were nearly balanced, with a mean areal flux of 0.2 kg P ha−1yr−1.
Considering the different countries (Fig. 4a), the largest cumulative soil P increase was found in China (34.6 Tg P) for the 9 years from 2002 to 2010, followed by India (11.4 Tg P) and Brazil (3.6 Tg P). Pakistan (1.8 Tg P), the United States (1.8 Tg P), and New Zealand (1.8 Tg P) also had net soil P accumulation, yet of a smaller magnitude. These six coun-tries accounted for 77 % of the global accumulation of P in countries where cropland had a positive soil P balance. Fur-thermore, a large amount of P accumulated in the soil labile P pools of cropland in China and India, at about 20.0 and 4.5 Tg P, respectively; however, in the United States, about 6.0 Tg P accumulated in the cropland stable P pool from 2002 to 2010; thus, 4.2 Tg P was absorbed from the previ-ous cropland soil P. In contrast, most African countries ex-perienced persistent cropland soil P deficits from 2002 to 2010. This was especially true in Nigeria, which had a cu-mulative deficit of 1.7 Tg P (Fig. 4a). We also found cumu-lative soil P deficits in Russia, the Ukraine, and Kazakhstan, but with a smaller magnitude (1.1, 0.9, and 0.7 Tg P, respec-tively) for the 9 years. Comparing the rates of change of crop soil P per unit area, New Zealand had the fastest rate of increase (> 100 kg P ha−1yr−1), whereas Argentina had the fastest rate of decrease (–7.9 kg P ha−1yr−1). In terms of the difference between inputs and outputs, loss rates in Argentina were about 5 times input rates.
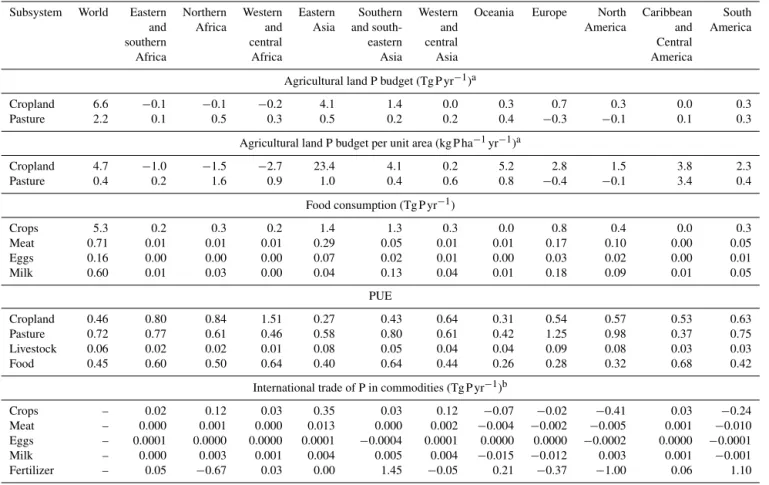
Table 1.Regional annual agricultural P budgets and P-use efficiency (PUE).
Subsystem World Eastern Northern Western Eastern Southern Western Oceania Europe North Caribbean South and Africa and Asia and south- and America and America
southern central eastern central Central
Africa Africa Asia Asia America
Agricultural land P budget (Tg P yr−1)a
Cropland 6.6 −0.1 −0.1 −0.2 4.1 1.4 0.0 0.3 0.7 0.3 0.0 0.3
Pasture 2.2 0.1 0.5 0.3 0.5 0.2 0.2 0.4 −0.3 −0.1 0.1 0.3
Agricultural land P budget per unit area (kg P ha−1yr−1)a
Cropland 4.7 −1.0 −1.5 −2.7 23.4 4.1 0.2 5.2 2.8 1.5 3.8 2.3 Pasture 0.4 0.2 1.6 0.9 1.0 0.4 0.6 0.8 −0.4 −0.1 3.4 0.4 Food consumption (Tg P yr−1) Crops 5.3 0.2 0.3 0.2 1.4 1.3 0.3 0.0 0.8 0.4 0.0 0.3 Meat 0.71 0.01 0.01 0.01 0.29 0.05 0.01 0.01 0.17 0.10 0.00 0.05 Eggs 0.16 0.00 0.00 0.00 0.07 0.02 0.01 0.00 0.03 0.02 0.00 0.01 Milk 0.60 0.01 0.03 0.00 0.04 0.13 0.04 0.01 0.18 0.09 0.01 0.05 PUE Cropland 0.46 0.80 0.84 1.51 0.27 0.43 0.64 0.31 0.54 0.57 0.53 0.63 Pasture 0.72 0.77 0.61 0.46 0.58 0.80 0.61 0.42 1.25 0.98 0.37 0.75 Livestock 0.06 0.02 0.02 0.01 0.08 0.05 0.04 0.04 0.09 0.08 0.03 0.03 Food 0.45 0.60 0.50 0.64 0.40 0.64 0.44 0.26 0.28 0.32 0.68 0.42
International trade of P in commodities (Tg P yr−1)b
Crops – 0.02 0.12 0.03 0.35 0.03 0.12 −0.07 −0.02 −0.41 0.03 −0.24 Meat – 0.000 0.001 0.000 0.013 0.000 0.002 −0.004 −0.002 −0.005 0.001 −0.010 Eggs – 0.0001 0.0000 0.0000 0.0001 −0.0004 0.0001 0.0000 0.0000 −0.0002 0.0000 −0.0001 Milk – 0.000 0.003 0.001 0.004 0.005 0.004 −0.015 −0.012 0.003 0.001 −0.001 Fertilizer – 0.05 −0.67 0.03 0.00 1.45 −0.05 0.21 −0.37 −1.00 0.06 1.10
aThe positive values represent a soil P surplus, whereas negative values represent a soil P deficit.bThe positive values represent net P importers, whereas negative values represent net P exporters.
3.2.2 Regional pasture budgets
We found mainly net losses of P in pasture soils (Fig. 4b), most likely because of the net removal of P through an-imal grazing, followed by the export of manure P to en-rich cropland soils. Pasture soil P loss rates per unit area in Europe averaged 0.4 kg P ha−1yr−1and reached high val-ues in countries (Denmark, Luxembourg, Germany, and Bel-gium) with intensive livestock production systems (Chang et al., 2015) and large grass consumption by livestock, with loss rates > 10 kg P ha−1yr−1. North American pastures had a smaller average loss rate of about 0.1 kg P ha−1yr−1. The United States, India, and Russia had the largest cumulative P deficits at 2.1, 1.5, and 0.7 Tg P, respectively, from 2002 to 2010. In contrast, pasture in the Caribbean and Central Amer-ica had greater P inputs than P removals. Consequently, these regions had the largest soil P accumulation rates. Pasture in northern and eastern Africa also had net soil P accumulation. For instance, Mauritania, Tunisia, and Morocco had net soil P accumulation rates of 9.8, 9.4, and 5.5 kg P ha−1yr−1, re-spectively. The reason for this excess is not clear, but one possibility is that these countries apply P fertilizer to some of their pasture.
3.3 Phosphorus-use efficiencies in different regions
Table 1 gives the values of PUE for cropland, pasture, live-stock, and food (human use) in the world’s different regions. Globally, 116 countries have cropland PUE values above the global mean value of 0.46, mostly in Africa, and these coun-tries account for 64 % of the global cropland area. In addi-tion, 16 % of the countries had a PUE of around 0.6 (0.55 to 0.65). In particular, African countries had the highest over-all cropland PUE (≥ 0.80) because of their low P input. On the other hand, eastern Asia and Oceania have cropland PUE below the global average. Conversely, pasture had high PUE in Europe (1.25) and North America (0.98) but low values in Africa (≤ 0.77) and particularly low values in the Caribbean and Central America (0.37). P removal from pasture ex-ceeded P inputs in Europe, resulting in pasture PUE > 1, largely because of P inputs from feed given to animals.
The livestock subsystem generally had a low PUE (< 0.1), with the highest values in Europe, North America, and east-ern Asia (Table 1). Regarding human food PUE, our data in-dicate that only 25 to 40 % of the P in food products in east-ern Asia, Oceania, Europe, and North America is actually consumed by humans (Table 1). The resulting low PUE of
human use in these regions results from both large P inputs and high food waste. Eastern and southern Africa, western and central Africa, southern and southeastern Asia, and the Caribbean and Central America had the highest PUE for hu-man use, with more than 60 % of P in food being consumed by humans. Globally, most of the P consumed by humans (78 %) originates from crops, and the fraction of P from live-stock differs among regions; it ranges from 35 % of the total human food P consumption in Oceania, Europe, and North America to 10 % in less developed regions (Africa and the Caribbean and Central America) and to 4 % in western and central Africa.
3.4 P flows through international trade
Approximately 2.1 Tg P yr−1entered into international trade in 2010, amounting to about 17 % of the total harvested crop P (Fig. 5). The remainder (10.6 Tg P yr−1) is consumed do-mestically. Differences in crop types as a result of their spe-cific P content (Table S1) strongly determine the magnitude of the traded P fluxes. For example, 37 % of the P in soybeans and 27 % of the P in wheat produced each year were traded internationally in 2010. Also significant fractions of the P in maize, other cereals, and fruit were traded internationally, but almost all of the P in sugar crops and fibre were consumed or processed in the countries where they were grown.
Considering the P fluxes in phosphate fertilizers and food products, we examined how international trade influences re-gional P budgets and redistributes P between regions. We found that southern and southeastern Asia have the largest net P imports (Table 1), with imports of phosphate fertil-izer amounting to 1.4 Tg P yr−1and P exports as food prod-ucts being much smaller, mainly to China and South Ko-rea. South America is the second-largest exporter of P in food, but imports 56 % of its P fertilizer. North America is a large exporter of P in both crop products and fertilizer, yet it also imports P-rich milk products. Most European coun-tries imported nearly all their phosphate fertilizers, but Eu-rope as a whole is a net exporter because of large exports (0.9 Tg P yr−1) from Russia (Fig. 6). Western European coun-tries were the main exporters of P-rich livestock products. Some northern African countries (especially Morocco and Tunisia, which have the largest mines of P-rich ores) ex-ported a total of 0.7 Tg P yr−1in fertilizer. The remaining re-gions (eastern and southern Africa, northern Africa, and the Caribbean and Central America) imported P in both food and fertilizer, although much less than other regions (Table 1).
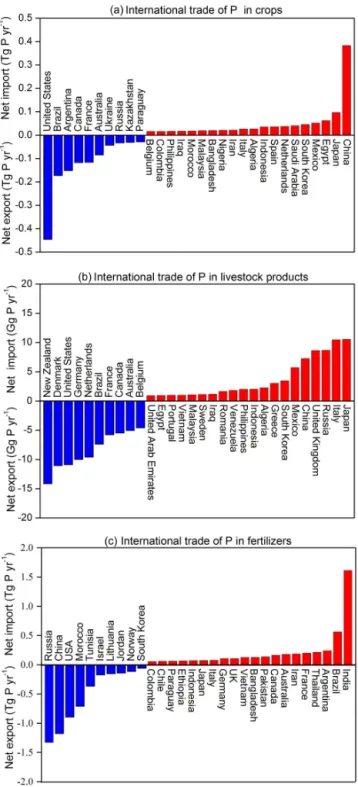
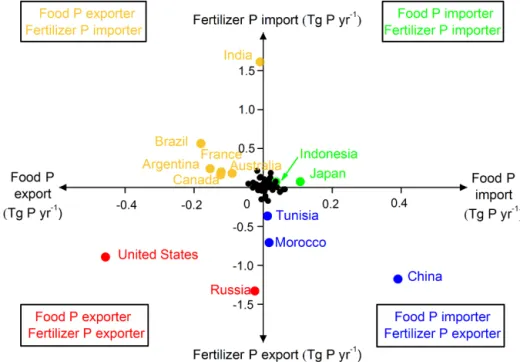
Figure 6 illustrates the disparities among countries with respect to the role of international trade in crops, livestock, and fertilizer for the main exporters and importers. Based on data for all 224 countries, a country can be categorized into one of the following four groups (Fig. 7).
Food and fertilizer P exporters. P storage in these coun-tries has been decreasing due to their international exports of
Figure 6.Annual P flows embedded in traded crop products (a), livestock products (b), and fertilizers (c) in 2010. By convention, a positive flow is P received (imported) by a country.
both fertilizer and food. Examples include the United States and Russia.
Food P importers and fertilizer P exporters. This group mainly comprises countries that export phosphate fertilizers and import food to meet domestic consumption. Examples includes Tunisia, Morocco, and China.
Figure 7.Groupings of the countries based on whether they import or export P through their international trade in food and fertilizer.
Food P exporters and fertilizer P importers. These coun-tries have high food and livestock production, but this depends strongly on phosphate fertilizer imported from other countries. Examples include Brazil, Argentina, Canada, France, Australia, and India.
Food and fertilizer P importers. These countries depend on imports for both food and fertilizers; they are thus vulnerable to economic shocks that result from changing food prices. Examples include Japan and Indonesia.
International trade affects the global P cycle by physically moving the P contained in traded crops, livestock products, and phosphate fertilizers (Grote et al., 2005). Imports of P fertilizers accounted for 55 and 79 %, respectively, of the to-tal application of P fertilizer for countries that are food P ex-porters and fertilizer P imex-porters or food and fertilizer P im-porters. The P trade in food followed a similar trend. Coun-tries that are food P importers and fertilizer P exporters or food and fertilizer P importers depended more on food im-ports than countries that are food and fertilizer P exporters or food P exporters and fertilizer P importers. International trade also increased the connections among countries (Ta-ble 2). For example, although the United States and China are clearly major P fertilizer exporters, they also import fer-tilizer from each other; 2.6 % of the P ferfer-tilizer applied in the United States originated in China, and 3.6 % of the phosphate fertilizer applied in China originated in the United States. In addition, 11.4 % of the phosphate fertilizer consumption in the United States originated from Russia, Morocco, Tunisia, and other countries. About 1.5 % of Chinese domestic P con-sumption originates from the United States, which is higher than the fraction of domestic P consumption in the United
States from China. Countries with small or no reserves of P-containing minerals imported large amounts of phosphate fertilizer; for example, imports accounted for 61 and 46 % of total P consumed in France and Brazil (food P exporters and fertilizer P importers) and 76 % of total P consumed in Japan.
3.5 Uncertainties in soil P changes result from uncertain P concentrations
We estimated the net cropland soil P balance in 2000 by means of Monte Carlo simulations, as described in Sect. 2.7. We found a net accumulation of 5.8 ± 0.6 Tg P yr−1. More detailed calculations suggest that uncertainty in the crop P concentrations contributed ±0.2 Tg P yr−1of the uncertainty in the net cropland soil P balance; this is because of the dom-inance of calculations using cereals, which have low uncer-tainty due to the narrow range of reported P concentrations (Antikainen et al., 2005; COMIFER, 2007; USDA-NRCS, 2009; Waller, 2010). Uncertainty in P concentrations in crop residues contributed an additional ±0.2 Tg P yr−1 to the to-tal uncertainty, and uncertainty in P concentrations in the livestock manure applied to cropland added ±0.4 Tg P yr−1. In addition, the uncertainty in the pasture soil P balance attributed to uncertainty in the P concentrations in grass biomass and manure was ±1.3 Tg P yr−1. This relative un-certainty is higher than that for the cropland soil P balance and the results from the large range of grass P concentrations found in our review of the available data. See Table S5 for more details.
Table 2.Proportions of total consumption and total international trade accounted for by P in fertilizer and food imports and exports. Proportion (%)
Group P fertilizer P fertilizer exports P in food imports P in food exports as imports as a as a proportion as a proportion of a proportion of the proportion of total of the total total consumption total international consumption international P P in the food trade
fertilizer trade Group level
Food and fertilizer exporter 22 43 7 31 Food importer and fertilizer exporter 5 48 22 5 Food exporter and fertilizer importer 55 5 5 48 Food and fertilizer importer 79 4 28 15
Country level
United States (food and fertilizer exporter) 13 18 6 26 China (food importer and fertilizer exporter) 2 20 14 2 France (food exporter and fertilizer importer) 52 0 19 8 Brazil (food exporter and fertilizer importer) 44 1 4 10 Japan (food and fertilizer importer) 40 0 60 0
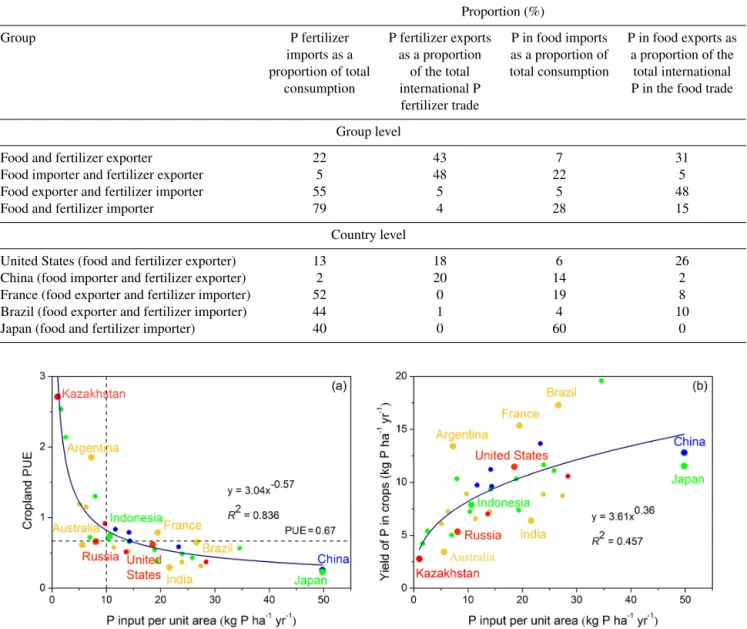
Figure 8. The relationships between P input per unit area of cropland and (a) phosphorus-use efficiency (PUE) The horizontal line at PUE = 0.67 represents the global average. (b) P in harvested crops for the 35 largest crop producers representing 90 % of global crops. The equations give the fit to the data represented by black curves.
4 Discussion
4.1 Cropland PUE and P in harvested crops as
a function of cropland P inputs
Figure 8a shows the relationship between the cropland PUE and cropland P inputs for 35 countries that are large crop producers. PUE decreased exponentially with increasing in-put; that is, P was used most efficiently at low applica-tion rates. PUE decreased rapidly as P inputs increased to 10 kg P ha−1yr−1and then decreased more slowly. High PUE values were associated with countries that had a low P input and a soil P deficit. This suggests that there is a trade-off be-tween the efficient use of P in cropland and the avoidance
of soil P deficits that limit crop yields (Obersteiner et al., 2013). Figure 8a also indicates that cropland soils have a net soil P deficit if their inputs are lower than 10 kg P ha−1yr−1, which is a threshold value that corresponds to PUE = 0.67. Argentina, South Africa, Indonesia, Mexico, and Paraguay are below this threshold (Fig. 9).
P in harvested crops increased exponentially with increas-ing P inputs, but the response slowed at high P inputs (Fig. 8b). The P in harvested crops in countries with crop-land PUE > 0.67 (except Argentina) is only half of that in countries with high P in the harvested crops, such as the United States and China. P in the harvested crops was very low in Australia due to low cropland P input, which was less
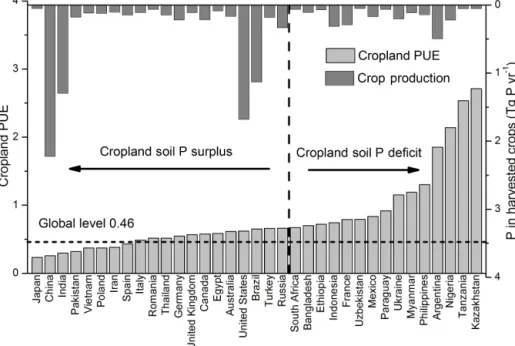
Figure 9.Phosphorus-use efficiency (PUE) and P in harvested crops for the 35 large countries shown in Fig. 8. Cropland soil P surplus or deficit is separated by the vertical dashed line.
than 25 % of the inputs in the United States and China. P al-ready present in the soil may be sufficient to sustain high crop yields for some time without additional inputs in some coun-tries (e.g. France) that formerly had large P fertilization rates, despite currently having a negative annual P balance. Com-paring Fig. 8a and b suggests that total cropland P inputs of 20 to 25 kg P ha−1yr−1may be a good compromise that will achieve high yields while creating a near-equilibrium soil P balance. Both excessive P inputs (e.g. China and Japan) and low PUE (e.g. India) can lead to high P accumulation in crop-land soil, leading to high losses into the environment.
The data in Fig. 8 indicate that different countries face different challenges for P resource management, implying a need for country-specific policy options and solutions. Countries like Kazakhstan and Argentina may have to in-crease P inputs to their cropland in order to prevent long-term depletion of soil P, which could be realized by increasing the application of phosphate fertilizer or reducing losses to leaching and erosion. Countries like France that are currently experiencing a net negative soil P balance (Fig. 9) follow-ing a period of sustained accumulation (Senthilkumar et al., 2012; van Dijk et al., 2016) may need to progressively ad-just fertilizer inputs in coming years to balance inputs with removals and avoid the risk of a long-term soil fertility de-cline due to inadequate levels of P. In contrast, countries such as Japan and China are rapidly accumulating P in crop-land soils due to high and sustained P inputs and will ur-gently need to consider how to improve their cropland PUE. This could be initiated by identifying crop types that are be-ing over-fertilized and regions with excessive application of
phosphate fertilizer; they can then consider a range of options such as precision agriculture (i.e. applying only as much P as the crop requires). We estimate that if Chinese cropland PUE could be increased to the global average of 0.46 (Fig. 9), China would save 3.8 Tg P yr−1of phosphate fertilizer, which is equivalent to 60 % of its phosphate fertilizer consumption in 2010. Last, in countries like India where crop P harvests are lower than average despite high average P inputs and positive soil 1P , improvements in agricultural management (such as the use of precision fertilization) appear necessary. We did not have access to subnational data for this study, but it is likely that in a country as large as India, excessive or in-sufficient P may occur in different regions, for different crop types, or for different region–crop-type combinations.
4.2 Pasture P budget, livestock consumption, and
international trade
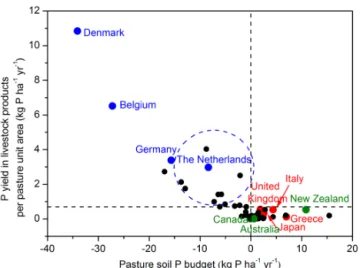
Figure 10 shows that the soil P balance is negatively related to the flux of P in livestock products per unit area of pasture. Several western European countries (Germany, the Nether-lands, Denmark, and Belgium) achieve high P yields in live-stock products (defined by the amount of P in livelive-stock prod-ucts per unit area of pasture), and all of these countries export livestock products. In these countries, only a small fraction of livestock manure is recycled to pasture, so there is currently a soil P deficit; in the long term, this may result in a loss of soil fertility. Therefore, these countries should increase P fer-tilization in pasture or import forage or feed to supply the P required to sustain high livestock production. New Zealand, Australia, and Canada are also large exporters of P in
live-Figure 10.The relationship between the P yield of livestock prod-ucts, defined by the amount of P in livestock products per unit area of pasture and the P balance of pasture soils.
stock products. However, given their low-input production systems and large areas of pasture (Fig. 4b), P removals per unit area through grazing are much lower than in western Eu-rope, and the soil P balance of pasture ranges from slightly negative to slightly positive.
4.3 Livestock and human food PUE and trends in P
consumption
The increasing consumption of livestock products by hu-mans is an essential factor that is responsible for increas-ing P minincreas-ing and increasincreas-ing P inputs to agricultural systems (Metson et al., 2012; van Dijk et al., 2016). Where socioe-conomic development is improving the income of residents, especially in Africa and the Caribbean and Central American region, residents are consuming more P from livestock prod-ucts (Fig. S3). Unfortunately, the livestock PUE in countries in these two regions is much smaller (0.01 to 0.03) than the global average of 0.06 (Table 1), indicating that only a small proportion of livestock P inputs is used by humans. This may be because countries in these regions are primarily importers of livestock products. Therefore, animal husbandry has im-portant implications for global P security and special atten-tion will be required to improve livestock PUE (Wu et al., 2014). If livestock PUE reaches the global level of 0.06 in these two regions, both regions could more than double their livestock production by about 0.16 Tg P yr−1.
In addition, the management of manure differs greatly among regions due to different livestock production systems. The yield of livestock products is very low in African coun-tries, resulting in low livestock PUE. Almost all livestock manure is applied to cropland for which this resource is an important P input. In contrast, with the application of phos-phate fertilizer to pasture in Europe and eastern Asia, only a small fraction of livestock manure is recycled for pasture
(36 and 17 %, respectively); a larger fraction of the manure is applied to cropland in eastern Asia (40 %) and Europe (60 %). Consequently, improving the manure utilization ef-ficiency and applying more livestock manure to pasture will be important strategies in eastern Asia and Europe (Wu et al., 2014).
As shown in Sect. 3.3, only 45 % of the P that enters the food production subsystem was absorbed by humans; thus, large amounts of food (and the P it contains) are wasted, although some parts of the waste were consumed by live-stock. Despite this recycling, 2.2 Tg P yr−1 flowed into the environment as waste either before or after food consump-tion, and only 14.3 % of the total P inputs to the agriculture system ended up in food consumed by humans. In eastern Asia, Oceania, Europe, and North America, the PUE of hu-man food was very low, reflecting the high proportion of live-stock products in the diet and a high degree of waste. There-fore, decreasing food waste before consumption, recycling P in food waste, and better treatment of organic waste could significantly decrease the amount of P required to support humans (Metson et al., 2012; van Dijk et al., 2016). In east-ern Asia, Oceania, Europe, and North America, fully absorb-ing the 45 % of the P that enters food produced for humans could reduce agricultural inputs of P by 0.7 Tg P yr−1 glob-ally. Thus, decreasing food waste and improving the PUE of human food represent key challenges that must be solved to achieve sustainable P management.
Population increases and dietary changes are requiring higher P inputs in cultivated land and the increased min-ing of P ores (Grote et al., 2005; Foley et al., 2011). From 2002 to 2010, this mining increased by 33 % in our estimate, during a period when the global population and per capita food P consumption increased by 10 and 5 %, respectively. In 2010, humans consumed 8.0 and 3.8 % more P in livestock products and crops, respectively. Since livestock PUE was much lower than cropland PUE, the consumption of more livestock products resulted in lower external P inputs in food that flowed into the human subsystem; this proportion de-creased from 36 % in 2002 to 31 % in 2010. Therefore, con-suming more livestock products will require increasing P in-puts. Thus, human dietary shifts may have been responsible for half of the increase of P-ore mining.
4.4 International trade and global P flows
International trade also increased the connections among countries. Whether international trade is good or bad for hu-mans and the environment in terms of its impact on the man-agement of P resources is a complex question. International trade can increase cropland P deficits if countries that ex-port large amounts of P in crop and livestock products do not counteract these exports by increasing inputs of phosphate fertilizer to soils. For example, Argentina exported lots of food to other countries (about 0.15 Tg P yr−1) and has de-veloped a serious cropland soil P deficit of 0.38 Tg P yr−1
(10.3 kg P ha−1yr−1). Massive P imports through trade can result in an excess supply of P to cropland soils as ma-nure (Schipanski and Bennett, 2012), with potentially sig-nificant negative environmental effects. On the one hand, trade can hamper the proper recycling of P resources from waste and manure to agricultural soils through local food webs (Schipanski and Bennett, 2012). On the other hand, trade may contribute to more efficient use of P resources if traded products flow from countries with lower PUE to countries with higher PUE, as is generally observed for wa-ter resources (Dalin et al., 2014). This confirms that more integrated studies are required to fully assess the effects of trade on P resource recycling, efficiency, and conservation. Our study identified world regions and countries with lower PUE and others with high PUE and regions and countries with a net loss of P in soils and others with a net gain. This provides valuable information to policymakers on how to im-prove the trade relationships for a global optimization of PUE and therefore global food security.
4.5 Comparison with previous studies
Previous studies have estimated P flows in agriculture on a global scale (Smil, 2000; Sheldrick et al., 2003; Liu et al., 2008; Cordell et al., 2009; Bouwman et al., 2009, 2013; Pot-ter et al., 2010; MacDonald et al., 2011). However, to the best of our knowledge, the present analysis provides the first consistent multi-year overview of the P flows in agriculture. In addition, it provides national and regional P budgets, cal-culates agricultural PUE, and quantifies P fluxes in interna-tional trade based on a combination of datasets for cropland and pasture inputs (fertilizers, manure, atmospheric deposi-tion, and recycling of crop residues) and outputs (crop har-vests, residue removal, and P loss by burning and leaching or surface run-off into bodies of water). For data from 2000, our results are consistent with the abovementioned studies for most P flows (Table 3). For data from 2000, our results are generally consistent with those in the previous studies for cropland soil P inputs, harvested crop P, cropland soil P lost by erosion or surface run-off into bodies of water, pasture soil P inputs, and harvested grass P (Table 3). However, methods, data sources, and system boundaries differed among the stud-ies, making an accurate comparison difficult. Our estimate of a net accumulation of 5.8 ± 0.6 Tg P yr−1is in line with the reported net accumulation in soils, which ranged between 0 and 11.5 Tg P yr−1(Smil, 2000; Bennett et al., 2001; Bouw-man et al., 2009; MacDonald et al., 2011), but disagrees with the estimate of Liu et al. (2008), who calculated a net loss of 9.6 Tg P yr−1. The difference from the present results can be explained by accounting for large P losses (19.3 Tg P yr−1) due to soil erosion caused by land-use change and over-grazing. The quantification of erosional losses of P from arable land is prone to high uncertainties due to the unknown amount of redeposited soil material, and other studies have
reported much lower losses (e.g. 2.5 Tg P yr−1; Quinton et al., 2010).
The main cropland P fluxes estimated in our study agreed with previous results, except for the production and recycling of crop residues (Table 3). Smil (2000) and Liu et al. (2008) used harvest index data (defined as the ratio of total above-ground biomass to crop residues) for estimating the P in crop residues, whereas we estimated P in crop residues by com-bining data from Liu et al. (2008) and FAO. MacDonald et al. (2011) estimated that 29 % of the global cropland area was subject to soil P deficits in 2000, which is similar to our estimate (32 %) based on data from 2002 to 2010. In addi-tion, our estimate of 22.3 Tg P yr−1in animal manure for the livestock subsystem in 2000 is within the reported range of 17.1 to 24.3 Tg P yr−1from Potter et al. (2010). We defined global cropland PUE as the ratio of P in harvested crops to total P inputs without accounting for the recycling of crop residues. Under this definition, global PUE was estimated to be 0.43 by Liu et al. (2008) and 0.40 by Smil (2000), both of which are comparable to our estimate of 0.46 from 2002 to 2010. Since we applied the same methods across the globe to calculate agricultural P fluxes, we were able to compare the P fluxes and budgets for different regions and countries on a consistent basis. This information is of critical impor-tance for the development of more appropriate agricultural policy and to support the development of technological and other solutions for different types of countries, which better integrate cultivated ecosystems, livestock production, and the human food supply.
4.6 Limitations and novelty of our study
Due to limited data sources for some parameters, our study and most previous studies focused on P in livestock products and manure as the outputs of the livestock system and did not consider the fate of P in non-edible livestock products (e.g. bones, blood, leather products). Xu et al. (2005) pointed out that from 12 to 23 and 72 % of P were contained in livestock meat and bones, respectively. If these percentages are applied to our data, this gives an annual flux of 2.5 Tg P yr−1 in the bones of slaughtered animals. Although most livestock bones are currently wasted or landfilled, some countries have begun to use them as fertilizers, protein sources, and condiments (Wu and Ma, 2005; Li, 2008). In addition, as we focused on the annual P budgets for livestock and human beings, we did not account for P accumulation in humans. From 2002 to 2010, the global population increased by 635 × 106 per-sons. If we assume that a typical adult body contains 600 g of P, then about 0.38 Tg more P would have accumulated in humans. Therefore, the annual human P accumulation would be 0.04 Tg P yr−1, accounting for only 0.3 % of the P inputs into humans.
Despite the abovementioned limitations in our study, we were able to achieve some interesting and novel results. First, we have provided a detailed and harmonized summary of
Table 3.Comparison of the present results for P flows and budgets in 2000 with the results of other studies at a global level (Tg P yr−1). Global P flux Previous studies Our study Reasons for differences Cropland Fertilizer input 14–151–3 13.7 —
Animal manure to cropland 6–82,3 6.7 ± 0.4 Method Human sewage sludge to cropland 1.51,3 1.3 Method Crop production 8.2–12.31–5 10.2 ± 0.4 Boundary/data Crops (human food) 3.53 4.8 ± 0.2 Method/data Crops (animal feed) 2.63 1.9 ± 0.1 Data Crop residues 3.75–4.51–2 6.7 ± 0.2 Method/data Recycling of residues 1–2.21–3 3.5 ± 0.1 Method/data Leaching and run-off from cropland 46 3.2 Method Pasture Livestock manure 17.1–24.35,7,8 22.3 ± 1.3 Method/data
Manure wasted (released into the environment) 2–81–3 4.1 ± 0.2 Method/data Grass 6–12.13,4 8.9 ± 1.3 Method/data Animal feed additives 0.93 1.4 Data Leaching and run-off from pasture 1.05 1.6 Method Humans Excreta 3–3.31,3 2.8 Method
Sources:1Liu et al. (2008),2Smil (2000),3Cordell et al. (2009),4MacDonald et al. (2011),5Bouwman et al. (2009),6Bouwman et al. (2013),7Sheldrick et al. (2003),8Potter et al. (2010).
the P fluxes as inputs and outputs for the agricultural sys-tem and the internal P flows within the agricultural syssys-tem on national, regional, and global scales. In addition, we have characterized the P budgets and P-use efficiencies in the subsystems of the overall agricultural system and discussed their influences and impacts. Finally, we have discussed how changes in population, diets, and food consumption have in-fluenced the global mining of P ore and how international trade has influenced P fluxes. These insights will support the development of policies to use P more sustainably at na-tional, regional, and global levels.
5 Data availability
The global and regional phosphorus budgets and their PUEs in agricultural systems are publicly available at https://doi. pangaea.de/10.1594/PANGAEA.875296.
6 Conclusions
The estimation of global and regional phosphorus budgets in agricultural systems and their PUE is a major effort by the anthropogenic nutrient cycle research community that requires lots of work. We quantified in detail the P inputs and outputs of cropland and pasture and the P fluxes through human and livestock consumers of agricultural products on global, regional, and national scales from 2002 to 2010. The results from this analysis confirmed that P from phosphate fertilizers is the largest single input flux into the agricultural system, while one-half of this input was lost to freshwaters and one-third accumulated in soils. Chemical fertilizer
in-puts, P losses to the environment, and P harvested in crop biomass all present increasing trends. The positive global P balance in cropland and pasture soils is the sum of regional excess and deficits, with differences in the sign of the bal-ance between cropland and pastures as well. Compared with croplands, a slightly larger proportion of the global pasture area had a net annual soil P deficit. The hot spots of crop-land P budgets are on the one hand eastern Asian tries with excessive inputs and sub-Saharan African coun-tries with deficits. Hot spots of pasture P budgets are Eu-ropean and North American grazing lands showing signifi-cant soil P deficits. There are great differences in PUE for croplands, pastures, livestock products, and food products on global, regional, and national scales. Livestock products gen-erally had the lowest PUE. We showed that cropland PUE decreased exponentially with increasing input implying that P is used more efficiently at low application rates. In parallel, P in harvested crop biomass increased with P inputs follow-ing a saturatfollow-ing exponential relationship. International trade plays a significant role in the P redistribution among coun-tries when considering P embedded in imported livestock and food products consumed in each country and the trade of fer-tilizers. Nearly one-fifth of total harvested crop P entered into international trade during the period 2002–2010. Population increases and dietary changes are requiring higher P inputs in cultivated land and the increased production of P fertilizers from minerals. Human dietary shifts may have been respon-sible for half of the increase in P mining during the period 2002–2010. Regional P imbalances in agricultural soils can be mitigated both by optimizing phosphate fertilizer applica-tion and recycling P.
The Supplement related to this article is available online at https://doi.org/10.5194/essd-10-1-2018-supplement.
Competing interests. The authors declare that they have no con-flict of interest.
Acknowledgements. This study was supported by the National Natural Science Foundation of China (41625001, 41571022), the Beijing Natural Science Foundation (grant 8151002), the Southern University of Science and Technology (grant no. G01296001), and a Synergy Grant (ERC-2013-SyG-610028 IMBALANCE-P) from the European Research Council.
Edited by: Attila Demény
Reviewed by: two anonymous referees
References
Antikainen, R., Lemola, R., Nousiainen, J. I., Sokka, L., Esala, M., Huhtanen, P., and Rekolainen, S.: Stocks and flows of nitrogen and phosphorus in the Finnish food production and consumption system, Agr. Ecosyst. Environ., 107, 287–305, 2005.
ASAE: Manure Production and Characteristics. D384.2, American Society of Agricultural Engineers, St. Joseph, MI, USA, 2005. Bennett, E. M., Carpenter, S. R., and Caraco, N. F.: Human impact
on erodable phosphorus and eutrophication: a global perspective: increasing accumulation of phosphorus in soil threatens rivers, lakes, and coastal oceans with eutrophication, BioScience, 51, 227–234, 2001.
Bouwman, A. F., Beusen, A. H., and Billen, G.: Human al-teration of the global nitrogen and phosphorus soil bal-ances for the period 1970–2050, Global Biogeochem. Cy., 23, https://doi.org/10.1029/2009GB003576, 2009.
Bouwman, L., Goldewijk, K. K., Van Der Hoek, K. W., Beusen, A. H., Van Vuuren, D. P., Willems, J., Rufino, M. C., and Stehfest, E.: Exploring global changes in nitrogen and phospho-rus cycles in agriculture induced by livestock production over the 1900–2050 period, P. Natl. Acad. Sci. USA, 110, 20882–20887, 2013.
Carpenter, S. R. and Bennett, E. M.: Reconsideration of the plan-etary boundary for phosphorus, Environ. Res. Lett., 6, 014009, https://doi.org/10.1088/1748-9326/6/1/014009, 2011.
Carpenter, S. R., Caraco, N. F., Correll, D. L., Howarth, R. W., Sharpley, A. N., and Smith, V. H.: Nonpoint pollution of surface waters with phosphorus and nitrogen, Ecol. Appl., 8, 559–568, 1998.
Chang, J., Viovy, N., Vuichard, N., Ciais, P., Campioli, M., Klumpp, K., Matin, R., Leip, A., and Soussana, J. F.: Mod-eled changes in potential grassland productivity and in ruminant livestock density in Europe over 1961–2010, PLOS ONE, 10, e0127554, https://doi.org/10.1371/journal.pone.0127554, 2015. Chang, J. F., Viovy, N., Vuichard, N., Ciais, P., Wang, T.,
Co-zic, A., Lardy, R., Graux, A.-I., Klumpp, K., Martin, R., and Soussana, J.-F.: Incorporating grassland management in
ORCHIDEE: model description and evaluation at 11 eddy-covariance sites in Europe, Geosci. Model Dev., 6, 2165–2181, https://doi.org/10.5194/gmd-6-2165-2013, 2013.
COMIFER: Teneur en P, K et Mg des organes végétaux récoltés pour les cultures de plein champ et les principaux fourrages, Comité Français d’Étude et de Développement de la Fertilisation Raisonneé, Paris, 2007 (in French).
Cordell, D., Drangert, J., and White, S.: The story of phospho-rus: global food security and food for thought, Global Environ. Chang., 19, 292–305, 2009.
Cordell, D., Neset, T. S., and Prior, T.: The phosphorus mass bal-ance: identifying “hotspots” in the food system as a roadmap to phosphorus security, Curr. Opin. Biotech., 23, 839–845, 2012. Cordell, D., Jackson, M., and White, S.: Phosphorus flows through
the Australian food system: identifying intervention points as a roadmap to phosphorus security, Environ. Sci. Policy, 29, 87– 102, 2013.
Dalin, C., Hanasaki, N., Qiu, H., Mauzerall, D. L., and Rodriguez-Iturbe, I.: Water resources transfers through Chinese interprovin-cial and foreign food trade, P. Natl. Acad. Sci. USA, 111, 9774– 9779, 2014.
Elser, J. and Bennett, E.: Phosphorus cycle: a broken biogeochemi-cal cycle, Nature, 478, 29–31, 2011.
FAO: Fertilizer Use by Crop (5th Edition), Food and Agriculture Organization of the United Nations, Rome, 2012.
Foley, J. A., Ramankutty, N., Brauman, K. A., Cassidy, E. S., Ger-ber, J. S., Johnston, M., Muller, N. D., O’Connell, C., Ray, D. K., West, P. C., Balzer, C., Bennett, E. M., Carpenter, S. R., Hill, J., Monfreda, C., Polasky, S., Rockström, J., Sheehan, J., Siebert, S., Tilman, D., and Balzer, C.: Solutions for a cultivated planet, Na-ture, 478, 337–342, 2011.
Grote, U., Craswell, E., and Vlek, P.: Nutrient flows in international trade: ecology and policy issues, Environ. Sci. Policy, 8, 439– 451, 2005.
Herrero, M., Havlík, P., Valin, H., Notenbaert, A., Rufino, M. C., Thornton, P. K., Blümmelb, M., Weissc, F., Grace, D., and Obersteiner, M.: Biomass use, production, feed efficiencies, and greenhouse gas emissions from global livestock systems, P. Natl. Acad. Sci. USA, 110, 20888–20893, 2013.
Levington Agriculture: A Report for the European Fertiliser Manu-facturers’ Association. Levington Agriculture Ltd., Ipswich, UK, 1997.
Li, J.: The development and prospective of nutrition in livestock bones, Meat Ind., 322, 41–44, 2008 (in Chinese).
Liu, Y., Villalba, G., Ayres, R. U., and Schroder, H.: Global phos-phorus flows and environmental impacts from a consumption perspective, J. Ind. Ecol., 12, 229–247, 2008.
Ma, W., Ma, L., Li, J., Wang, F., Sisák, I., and Zhang, F.: Phos-phorus flows and use efficiencies in production and consumption of wheat, rice, and maize in China, Chemosphere, 84, 814–821, 2011.
MacDonald, G. K., Bennett, E. M., Potter, P. A., and Ra-mankutty, N.: Agronomic phosphorus imbalances across the world’s croplands, P. Natl. Acad. Sci. USA, 108, 3086–3091, 2011.
Metson, G. S., Bennett, E. M., and Elser, J. J.: The role of diet in phosphorus demand, Environ. Res. Lett., 7, 044043, https://doi.org/10.1088/1748-9326/7/4/044043, 2012.