HAL Id: hal-02453499
https://hal.archives-ouvertes.fr/hal-02453499
Submitted on 23 Jan 2020
HAL is a multi-disciplinary open access
archive for the deposit and dissemination of
sci-entific research documents, whether they are
pub-lished or not. The documents may come from
teaching and research institutions in France or
abroad, or from public or private research centers.
L’archive ouverte pluridisciplinaire HAL, est
destinée au dépôt et à la diffusion de documents
scientifiques de niveau recherche, publiés ou non,
émanant des établissements d’enseignement et de
recherche français ou étrangers, des laboratoires
publics ou privés.
Nathaniel D. Mueller, Christoph Müller, Thomas Nesme, Nicolas Vuichard,
Xuhui Wang, et al.
To cite this version:
Bruno Ringeval, Marko Kvakić, Laurent Augusto, Philippe Ciais, Daniel Goll, et al.. Insights on
nitrogen and phosphorus co-limitation in global croplands from theoretical and modelling fertilization
experiments. Biogeosciences Discussions, European Geosciences Union, 2019, pp.1-35.
�10.5194/bg-2019-298�. �hal-02453499�
theoretical and modelling fertilization experiments
Bruno Ringeval1*, Marko Kvakić1,2, Laurent Augusto1, Philippe Ciais2, Daniel Goll2,
Nathaniel D. Mueller3, Christoph Müller4, Thomas Nesme1, Nicolas Vuichard2, Xuhui
Wang2, Sylvain Pellerin1
1 :ISPA, Bordeaux Sciences Agro, INRA, 33140, Villenave d’Ornon, France.
2 : Laboratoire de Sciences du Climat et de l'Environnement, LSCE/IPSL, CEA-CNRS-UVSQ, Universite Paris-Saclay, Gif-sur-Yvette, France
3 : Department of Earth System Science, University of California, Irvine, CA, USA
4 : Potsdam Institute for Climate Impact Research, Member of the Leibniz Association, Potsdam, Germany
*: corresponding author: [email protected], +33 5 57 12 25 05
5
10
15
Abstract:
Crossed fertilization additions are a common tool to assess nutrient interaction in a given ecosystem. Such fertilization experiments lead to the definition of nutrient interaction categories: e.g. simultaneous co-limitation, single resource response, etc. (Harpole et al., 2011). However, the implications of such categories in terms of nutrient interaction modeling are not clear. To this end, we developed a theoretical analysis of nitrogen (N) and phosphorus (P) fertilization experiments based on the computation of ratios between plant demand and soil supply for each nutrient. The theoretical analysis is developed following two mathematical formalisms of interaction: Liebig's law of minimum and multiple limitation hypothesis. As results of the theoretical framework, we defined the corresponding between most Harpole categories and the values of the limitation by each nutrient when considered alone in the control experiment (i.e. without additional nutrient supply). We showed that synergistic co-limitation could occur even using Liebig's formalism under certain conditions as a function of the amount of N and P added in fertilization experiments. We then applied our framework with global maps of soil supply and plant demand for croplands to achieve their potential yield. This allowed us to estimate the global occurrence of each limitation category, for each of the possible interaction formalism. We found that a true co-limitation could affect a large proportion of the global crop area (e.g. ~42% for maize) if multiple limitation hypothesis is assumed. Our work clarifies the conditions required to achieve N and P co-limitation as function of the interaction formalism. Combined with compilation of field trials in cropland, our study would improve our understanding of nutrient limitation in cropland at the global scale.
Keywords: nutrient limitation, nutrient interaction, nitrogen, phosphorus, cropland 20
25
30
35
1. Introduction
In global assessments of crop ecosystem productivity limitations by nutrients, nitrogen (N) and phosphorus (P) are sometimes considered independently (Peñuelas et al., 2013); or they are considered together but without focusing on how the interaction modulates the limitation (Mueller et al., 2012). N and P cycles interact strongly with different processes that are key to this coupling (Achat et al., 2016). The most commonly studied interaction is related to the limitation of plant growth by nutrients: an increase in organ biomass (mainly composed of carbon, C) requires a given amount of both N and P, to respect stoichiometrical constraints. The interaction between carbon and nutrients is usually represented by C:nutrient ratios for each organ. Plant growth is assumed to be limited when the demand for nutrients, estimated from C:nutrient ratios and C available for potential growth, is not satisfied by the supply of nutrient taken up by the plant. Due to incomplete knowledge about the mechanisms at the basis of the interaction and how these mechanisms are combined when integrating spatial scales (plant organ, individual, community, ecosystem) (Ågren et al., 2012; Davidson and Howarth, 2007; Sistla and Schimel, 2012; de Wit, 1992) the characterization of multiple element limitation remains an open scientific question. Two formalisms are generally used: Liebig's law of the minimum (LM) or the multiple limitation hypothesis (MH). In LM, plants are assumed to be limited by a single nutrient at a time, while in MH, it is assumed that plants adjust their growth patterns and thus they are co-limited by multiple nutrients simultaneously (Ågren et al., 2012). The MH formalism thus assumes that plants will mine the least available nutrient by using other resources. For instance, plants or groups of species growing in an ecosystem with a P-poor soil will invest C and N in the root system (and potentially to fungal mycorrhizae that form symbioses with plant roots (Ryan and 45
50
55
60
Graham, 2018)) to access more P (Davidson and Howarth, 2007). Both formalisms could be considered as macro-properties that reflect the same plant adjustments processes but, depending on the conditions, those adjustments may lead to an emerging behaviour that verifies one or the other formalism (Ågren et al., 2012). The further the supply of an essential nutrient deviates from a conceptual optimum stoichiometry of plants, the more plants will follow the LM formalism (Ågren et al., 2012). LM is commonly assumed in many studies and is for instance used in most large-scale models dealing with multiple nutrient limitations (Barros et al., 2004; Goll et al., 2012; Mueller et al., 2012).
One way to assess the current nutrient limitation empirically is to provide single applications of +N, +P and +NP and to measure the increase in ecosystem productivity as compared to a control trial without any application. By definition (Harpole et al., 2011), there is a true NP co-limitation when the ecosystem is observed to respond to combined N and P addition only, or to both N and P when added separately. The different categories of nutrient limitation are summarized in Harpole et al. (2011) and in Table 1. Fertilization experiments are common in natural ecosystems and meta-analysis of these experiments have provided a global picture of nutrient limitation in natural ecosystems (Augusto et al., 2017; Elser et al., 2007; Harpole et al., 2011). Results from recent meta-analyses have shown that a true co-limitation is found in 28-42% of the studies (Augusto et al., 2017; Harpole et al., 2011). This challenges the view that plants are generally limited by one nutrient at a time (i.e. LM). However, which categories of nutrient limitation are consistent with each interaction formalism (LM and MH) is not clear. For croplands, experiments with single applications of fertilizer are not as common as those for natural ecosystems and it is usually difficult to retrieve the application level before the experiment (e.g. Deguchi et al., 2017; Restelatto et al., 2017), which prevents an 70
75
80
85
accurate definition of the control in these cases. On the other hand, long-term field experiments are common in croplands (especially for P, e.g. Bai et al., 2013) but for a given treatment; the same amount of fertilizer is applied each year for decades, which precludes analysis of current limitation. Crossed fertilization additions are difficult to decipher from multi-nutrients and repeated fertilizer applications, as usually performed in croplands. To our knowledge, no meta-analysis of NP limitation in cropland field trials exists, which prevents us from having a global picture of N and P limitation based solely on observations.
In this work, we provided a theoretical framework of N and P fertilization experiments based on the computation of ratios between plant demand and soil supply for each of the two nutrients. The theoretical analysis is developed for two mathematical formalisms of interaction (LM or MH). This allowed us to define the corresponding between Harpole categories and the values of the limitation by each nutrient when considered alone. We analytically investigated how the choice of formalism modifies the NP limitation. Finally, we applied our framework on global spatially explicit computations of soil supply and plant demand of N and P for croplands to achieve their potential yield, in order to assess the occurrence of co-limitation in croplands for each interaction formalism.
95
100
105
2. Theoretical framework
Based on a framework commonly used in global studies (Goll et al., 2012; Kvakić et al., 2018), we defined the limitation of a nutrient considered alone as the ratio of its soil supply (S) and the demand by the plant to achieve its potential biomass (D):
RN=min (1,SN
DN) (Eq.1)
RP=min(1, SP
DP) (Eq.2)
where SX and DX correspond to the supply and demand of the nutrient X, respectively (in
kgX/ha/yr) with X is in {N,P}.
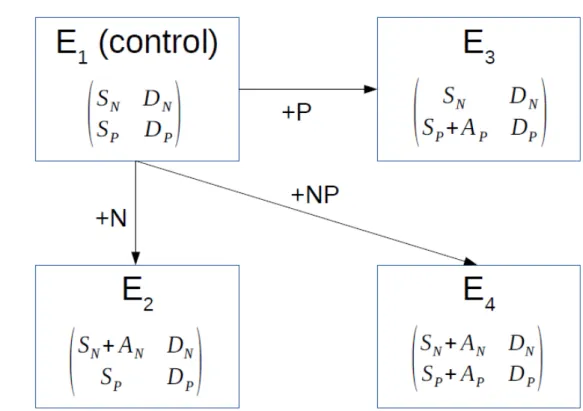
Crossed fertilization experiments are a common tool to assess nutrient limitation on a given site. They correspond to changes in nutrient supply in different combinations from the control (E1): addition of N alone (E2), P alone (E3) or N and P together (E4) (Fig. 1).
Based on the above equations defining the limitations of N and P (Eqs 1 and 2, respectively), theses changes in nutrient supply translate into limitations of each nutrient for each experiment E as follows:
E1: RN(E1)=min(1, SN DN) and RP(E1)=min(1, SP DP) (Eq.3) E2: RN(E2)=min (1, SN+AN DN ) and RP(E2)=min(1, SP DP) (Eq.4) E3: RN(E3)=min (1, SN DN) and RP(E3)=min(1, SP+AP DP ) (Eq.5) E4: RN(E4)=min(1, SN+AN DN ) and RP(E4)=min(1, SP+AP DP ) (Eq.6)
with AN and AP corresponding to the increase of N and P soil supply following addition of
115
120
125
130
N and P, respectively.
In the above framework, each nutrient is considered alone while the two nutrients interact. An ecosystem is thus defined by its NP limitation, called RNP in the following.
Two formalisms of interaction have been here considered to compute RNP from RN and RP:
multiple limitation hypothesis (called MH in the following, Eq.7) or Liebig's law of the minimum (LM, Eq.8):
RNP_ MH(Ei)=RN(Ei). RP(Ei) (Eq.7) RNP_ LM(Ei)=min(RN(Ei), RP(Ei)) (Eq.8)
where Ei is the experiment i.
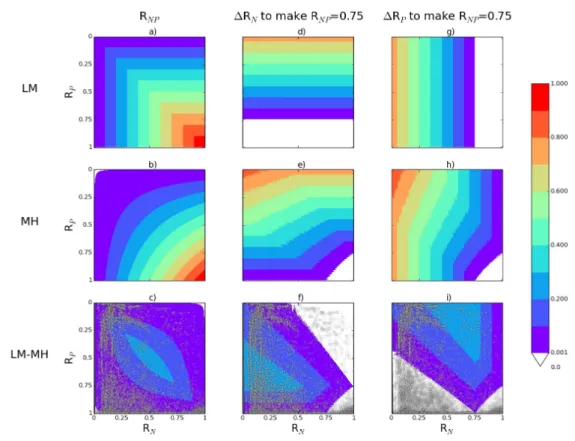
We analytically investigated to which extent the choice of the formalism has an effect on the value of RNP for a given (RN, RP) couple (Fig. 2a-c). We also investigated how the
formalism modulates the increases in RN and RP required to alleviate the NP limitation
(here represented by an increase in RNP to reach an arbitrary value of 0.75) (Fig. 2d-i).
Such increases are called RN and RP in the following. RN and RP corresponds to the
smallest increase in RN and RP required at the same time to make RNP equal to 0.75 (Fig.
3). We found that the largest differences in RNP between the LM and MH mathematical
formulations are obtained for comparable RN and RP values (RN~RP) and both within
[0.25-0.75] (Fig. 2c). In addition, the largest differences in RN between LM and MH occur
for RN<RP and both RN and RP lower than 0.75 (Fig. 2f). Symmetric results are obtained for
RP (Fig. 2i).
In fertilization experiments, nutrient limitation is assessed by looking at the change in productivity (pro) according to the addition of P alone (pro+P), N alone (pro+N) or N
140
145
150
155
and P together (pro+NP). pro is here expressed relatively to the potential productivity
(i.e. without any limitation). Harpole et al. (2011) defined different categories of limitation when considering the two nutrients in interaction. Each category is entirely defined by: i) the character null or non-null of pro+N and pro+P and ii) the relationship
between pro+NP and (pro+N+pro+P) (column 3 of Table 1). Following Harpole et al.
(2011), co-limitation exists when the increase in productivity following the addition of N and P together is strictly greater than the sum of increases in productivity when each nutrient is added alone (i.e. Δ pro+NP>Δpro+N+ Δpro+P ). Any co-limitation is defined as a
synergistic relationship. A given co-limitation is in addition considered as true if the responses to +N and +P are either both equal to 0 (i.e. Δ pro+N=0 and Δ pro+P=0 , simultaneous co-limitation, category A in Table 1) or both non-null (i.e. Δ pro+N≠0 and
Δpro+P≠0 , independent co-limitation, category B).
Here, we assumed that the change in productivity following the addition of +N, +P or +NP is equal to the change in RNP following the nutrient addition, i.e.:
Δpro+N=RNP(E3)−RNP(E1) (Eq.9)
Δpro+P=RNP(E2)−RNP(E1) (Eq.10)
Δpro+NP=RNP(E4)−RNP(E1) (Eq.11)
where Ei is the experiment i (Fig. 1). This is a key assumption in our approach. Through
these equations, we assumed that the productivity of a given experiment is proportional to RNP and that the slope of this relationship is equal to 1. In fact, a slope equal to 1 is not
necessary to develop the theoretical analysis described in Text S1. As mentioned before, Harpole categories are defined through i) the character null or non-null of pro+N and
pro+P and ii) the relationship between pro+NP and (pro+N+pro+P). These definitions are
165
170
175
true even if the productivity of each experiment (and thus the different pro) is divided by the same slope. We keep here a slope equal to 1 for the sake of simplicity. Eq.9-11 also imply that the relationship of proportionality between the productivity and RNP is
true for all values of RNP, in the range [0-1]. In reality, the productivity vs. limitation
relationship is very likely asymptotic (e.g. Bai et al., 2013). Here, we may approach this non-linearity by assuming a linear relationship for RNP in [0,thresh] where thresh is a given
threshold; followed by a plateau for RNP in [thresh,1] (which corresponds to assume a
slope of 0 for the productivity vs. limitation relationship). The corresponding between Harpole categories and the values of RN and RP found at the end of our theoretical
analysis are still valid in this more general case, but on the restricted range of RN and RP
values between 0 and thresh (in this case, the value 1 used as boundary for RN and RP in
category definitions – columns 4 and 6 of Table 1 – should be replaced by thresh). For the sake of simplicity, we keep in the following 1 as the high boundary and came back on this point in the Discussion.
For each interaction formalism (Eq.7 or 8), we translated the Harpole category definition (column 3 of Table 1) into conditions on RN(E1) and RP(E1) thanks to Eq.9-11. This means
that we are able to define most Harpole categories in terms of limitation of each nutrient considered alone in the control experiment. RN(E1) and RP(E1) are respectively
called RN and RP in the following. The equation manipulation is described in details in
Text S1 for both MH and LM.
We showed in particular that to belong to the category “independent co-limitation” (category B in Table 1) with MH formalism, an ecosystem has to be characterized by both RN and RP in ]0,1[ (a reversed bracket used in an interval means here that the
corresponding endpoint is excluded from the interval). All other categories (A, C-G) 185
190
195
200
require at least one ratio equal to 0 or 1: e.g. serial limitation N (category C) requires RN
equal to 0 and RP in ]0,1[ (Table 1). Categories E,F,G are defined by
Δpro+NP=Δpro+N+Δpro+P and we showed that this requires at least one ratio equal to 1 with MH formalism (Text S2).
We showed that the formalism LM cannot represent true co-limitation, except in the very specific category A (i.e. RP=RN≠1). We found that synergistic co-limitation alone
(categories C and D) can occur with LM but to be in these categories, the amount of N (if the control is N limited) or P (if the control is P limited) added in the fertilization experiments should be large enough to remove the initial limitation.
Conclusions of this analysis are summarized in Table 1 (columns 4 for MH and column 6 for LM).
210
215
3. Quantifying co-limitation in croplands at the global scale
3.1. Computation of spatially explicit RN and RP
We computed spatially explicit maps of RN and RP in croplands (0.5° latitude x 0.5°
longitude) based on the computation of nutrient demand and soil supply. We then applied the above described theoretical framework on these RN and RP values to classify
each grid-cell according to Harpole categories for the two interaction formalisms. The computation of supply and demand maps used to estimate RN and RP are described
below. To summarize, plant nutrient demand is based on nutrient harvest index data from the literature combined with spatially explicit distribution of crop potential yield (Ypot) (Mueller et al., 2012). The soil N supply has been approached by using a soil N
budget taking into account fertilizer (mineral and organic), atmospheric deposition, biological fixation, and losses by ammoniac volatilization (Bouwman et al., 2011a), while the soil P supply is assessed by a potential root uptake model that accounts for soil P diffusion and soil P legacy effects. More details can be found in Table S1.
Following Kvakić et al. (2018), demands for N and P to reach potential yields (DN and DP,
in kg(N or P)/ha/yr) were derived from the combination of i) fixed parameters related to distribution of carbon (C) and nutrients between the different plant organs at maturity found in the literature and ii) spatially explicit potential yield (Ypot, in kgC/ha/yr):
DX=Ypot.(X%, grain
XHI +
X%, root. RSR
HI ) (Eq.12).
XHI corresponds to the nutrient harvest index (i.e. the ratio between the nutrient content of grain and the nutrient content of shoot, no unit), HI is the harvest index (i.e. the ratio between the carbon content of grain and the carbon content of shoot, no unit), 225
230
235
240
RSR is the root/shoot ratio (no unit) and X%,grain and X%,root are nutrient concentrations
(kg(N or P)/kgC) for grain and root, respectively. Kvakić et al. (2018) has shown that a XHI-based method provides similar demand estimates compared with others based on the nutrient concentration of all plant organs or QUEFTS (Sattari et al., 2014). The definition of the parameters used in Eq.12 (XHI, HI, RSR, X%,grain, X%,root) is based on
nutrient and C biomass of different plant organs. These definitions as well as values used in the study are given in Table S2. Details about the Eq.12 are given in Text S3. The potential yield (Ypot) is provided by Mueller et al. (2012) in tons of dry matter per
hectare. In Mueller et al. (2012), the world grid-cells are divided into climate bins, defined by different combinations of growing degree days and amount of yearly precipitation; and within a climate bin, the potential yield is defined as the area-weighted 95th percentile of the observed yields.
The supply of P (SP, in kgP/ha/yr) corresponds to the sum of a potential root uptake and a
prescribed fraction (called ) of the inorganic content of total P fertilizer applied in the year considered Kvakić et al. (2018). The potential root uptake is determined by soil P availability and monthly root length density, following some assumptions about P diffusion in soil (Text S4). Soil P availability is derived from the current global distribution of soil P, as in Kvakić et al. (2018). The global distribution of soil P was determined by combining information on farming practices, soil P dynamics, soil biogeochemical background, climate effect on soil P dynamics, etc., as well as the past variation of some of these drivers (Ringeval et al., 2017). Thus, we explicitly considered the soil P legacy effect, as it has been shown to be an important process (Ringeval et al., 2014; Sattari et al., 2012). Root characteristics parameters, root biomass at harvest (derived from Ypot,
RSR and HI) and seasonality in root biomass (computed by 0 and 1 and derived from 250
255
260
265
simulations of one global gridded crop model, LPJmL (von Bloh et al., 2018)) were combined to compute monthly root length density (Text S4). As in Kvakić et al. (2018), we assumed that a fraction of the applied fertilizer P is directly available to the plant in the same growing season, thus bypassing the P diffusion pathway.
Following Bouwman et al. (2017), the supply of N is approached by the soil N input of the year considered (chemical and organic fertilizer, atmospheric deposition and fixation) minus losses corresponding to NH3 volatilization. Datasets were provided by Bouwman
et al. (2011). Except in few recent studies (e.g. ten Berge et al. (2019) that focuses on sub-Saharan Africa), N applied in previous years is generally neglected due to the higher lability of N than P. We follow the same assumption as it is common in global modelling approaches (Bouwman et al., 2017; Conant et al., 2013; Lassaletta et al., 2014). Mineralization of soil organic N was also neglected as under steady state conditions it is expected to be compensated by N immobilisation in soil microbial biomass.
Each term (SN, DN, SP, DP) is spatially explicit at half-degree resolution. An uncertainty
related to each term has been considered (Text S5). Maize, rice and wheat are considered in this study (see the crop-dependent terms in Table S1) and the ratios computed are representative of the year 2000. Only grid-cells for which RP and RN could be computed
are considered, which determines the crop area and the global crop production considered in our study (Table S3). In the Main Text, a specific focus is made on maize because it is the most widespread across latitudes. Caveats of our approach are discussed in Section 4.
3.2. Effects of formalism choice on global NP limitation 275
280
285
290
Spatial distributions of RN, RP as well as RNP computed with both formalisms are
described and discussed in Text S6. The relationship between RNP and actual yield gap
provided by statistical approaches (Yreal/Ypot,with Yreal being the actual yield) has been
investigated at country scale (Text S7).
The effect of formalism choice on the global values of RNP, RN and RP depends on the
distribution of grid-cells in the (RN, RP) space (grey dots in Fig. 2c,f,i). Even though
significant, the difference between LM and MH in global RNP is small (Table 2). This is
explained by a small number of grid-cells (~2%) characterized by conditions that maximize the difference between the LM and MH mathematical formulations (i.e. comparable RN~RP and both within [0.25-0.75], see above). Finally, ~55% of the grid-cells
are characterized by a difference LM – MH which is smaller than the uncertainty computed with a given formalism (LM or MH).
The global averages of R computed with MH (RN=0.44±0.00, RP=0.30±0.01) are larger
than those computed with LM (RN=0.37±0.00, RP=0.25±0.01). It was analytically shown
(Fig. 2) that the LM – MH difference of RN is maximal for a combination of small RN and
medium RP, as encountered in the centre of the USA (Text S6 and Fig. S1). Large
differences are also noticeable in regions with high limitations of both nutrients, such as the Western Russian Federation and Ukraine.
3.3. Occurrence of Harpole categories
We computed the occurrence of each Harpole category by using conditions on RN and RP
described in Table 1. We checked that these occurrences are equal to the values found when: numerical fertilization experiments are performed, RNP are computed for each
300
305
310
315
experiment (Eq.7-8) and Eq.9-11 are then applied. Increase of N and P supply (AN and AP)
in fertilization experiments are here equal to 30kgN/ha/yr and 5kgP/ha/yr, respectively and are spatially homogeneous for all cropland around the World.
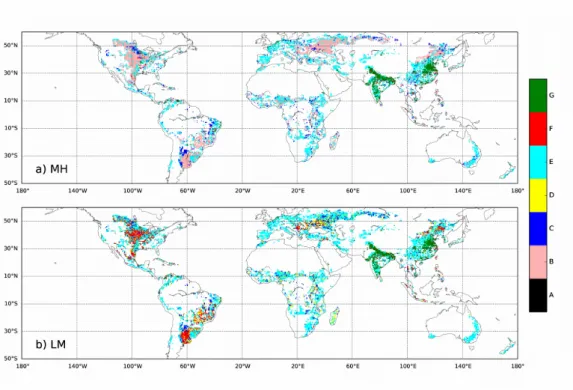
With the formalism MH, we found that true co-limitation occurs in 41.7±0.6 % of the global crop area for maize, via independent co-limitation (category B in Table 1). This category is found in the USA, South America, the Western Russian Federation and Ukraine (Fig. 4a). As showed theoretically, to belong to that category a crop has to be characterized by both RN and RP in ]0,1[. In our simulations, these conditions occur for
~42% of the maize crop area.
Synergistic co-limitation alone (categories C and D) occurs for 6.7±0.3 % of the global maize crop area and this is only explained by serial limitation N (category C, dark blue in Fig. 4a): no serial limitation P was found in our numerical application. This can be explained by the fact that RP (contrary to RN) is never null in our simulations because of
the soil P legacy taken into account in our approach (Ringeval et al., 2017). This also prevents simultaneous limitation (A) from being found. The occurrence of co-limitation at the global scale varies between crops (41.7±0.6 % for maize, 32.5±0.4 % for wheat and 18.7±0.8 % for rice, not shown). Except for few regions (e.g. India), grid-cells where the three crops are grown belong to the same limitation category for all crops (not shown): the difference in occurrence of co-limitation between crops is mainly explained by the crop-specific global distribution.
As theory shows (Text S1), the formalism LM cannot represent true co-limitation, except in the very specific category A (i.e. RP=RN≠1), which is never encountered in our study
325
330
335
340
(Fig. 4b and Table 1). We found that synergistic co-limitation alone (categories C and D) can occur in more than 15% of the global maize area with LM. However, this number is sensitive to the amount of N and P added in the fertilization experiments (called respectively AN and AP in Fig. 1). E.g. a cropland which is initially P-limited is classified in
the category D if the amount of P added (AP) is sufficient to remove the P limitation (i.e.
the cropland becomes N limited); otherwise, it belongs to the category F (Table 1). 350
4. Discussion
Previous studies estimating the occurrence of co-limitation in natural ecosystems were based on fertilization experiments performed around the World and provide some insights into the best way to represent the NP interaction (Elser et al., 2007; Harpole et al., 2011). Studies reviewing such experiments (characterized by a single application of nutrient) are not available for cropland, so we chose another strategy by computing the occurrence of co-limitation for each interaction formalism. Our work also clarifies the mathematical conditions in terms of supply/demand ratios required to place an ecosystem into a category of nutrient limitation, as defined by Harpole et al. (2011). In particular, we found that synergistic co-limitation can occur with Liebig's law of the minimum under certain conditions that are functions of the amount of N and P added in fertilization experiments, as already suggested by Ågren et al. (2012). We found that, if multiple limitation hypothesis is the most appropriate way to represent nutrient interaction, co-limitation should occur for ~50% of the maize crop area (42% of true and synergistic co-limitation + 7% for synergistic alone co-limitation). The percentage of true co-limitations found here is higher than those reported for natural ecosystems in Harpole et al. (2011) (28%) but similar to values found in Augusto et al. (2017) (42%). However, these previous figures should be compared with caution as they were not obtained with the same methodology. It is also worth noting that change in the plant community can occur consecutively to fertilizer application in natural ecosystems, which does not happen in cropland systems as they are mostly single crop. Experiments with single increase of fertilizer in cropland have to be selected and then compiled. Such meta-analysis would tell us if co-limitation is really common in croplands, suggesting e.g. that farming practices tend to promote co-limitation. On the contrary, the absence of 360
365
370
375
such co-limitation would suggest that human perturbation of nutrient cycles pushes the crop plant outside of its adaptation capacity.
The occurrences of different limitation categories are a function of the spatial distribution of RN and RP, as posited by our theoretical framework. However, these maps
are prone to uncertainty due to simplifications in our modeling approach.
First, we recognize that the use of constant parameters at the global scale in the computation of supply and demand is too simple (Sadras, 2006) in particular with respect to plant adjustments to nutrient limitations (Colomb et al., 2007) which are susceptible to modify nutrient organ concentrations. However, the aim of our study is to assess nutrient limitation and thus, we used organ concentrations derived from field experiments in stressed conditions (Van Duivenbooden (1992) and Table S2). Global changes are also very likely modifying yield and grain composition (e.g. Long et al., 2006; Müller et al., 2014) and this effect was not considered in our study which does not simulate temporal changes in nutrient limitation. Besides, it is worth nothing that considering grid-cells independently in our uncertainty analysis (Text S5) made these parameters artificially vary in space.
We used potential yield provided by statistical methods based on maximum attainable yield within climate bins (Mueller et al. 2012) but such approaches have difficulty distinguishing irrigated and rainfed crops and thus, the here used Ypot could be in fact
water-limited in some places (van Ittersum et al., 2013b). Updates to the statistical methodology are ongoing to improve the separation between water-limited and irrigated yield potential (Mueller, personal comm.).
We also did not consider some agronomic managements that are susceptible to modulate nutrient limitation. In particular, we did not consider cultivar diversity across 385
390
395
400
World regions. Such diversity is susceptible to modify parameters (in particular, HI) which are considered constant in space in our approach. However, cultivar diversity is difficult to consider at the global scale and up to now, it was mainly investigated through spatial variability in phenological development (van Bussel et al., 2015). To a much lesser extent, the effect of cultivar diversity on allocation (e.g. through variability in harvest index, susceptible to modify the here compute nutrient demand) was taken into account (Folberth et al., 2016). Also, some effects of crop rotation on nutrient limitation were not considered in our study. E.g. crop rotation can modulate the soil P availability because of difference in the strategies developed for enhancing nutrient acquisition among crops (Redel et al., 2007) and this effect was neglected here. However, N fixation by leguminous that can be incorporated within the crop rotation with cereals was indirectly considered in our study: our computation of N supply was not a function of crop (Table S1) and thus, the N supply budget encompasses an term for N fixation by leguminous occurring in the same grid-cell as cereals (Bouwman et al., 2011).
In our approach, the limitation of potential yield is computed by considering current farming practices to derive the supply. Current practices could be influenced by other limiting factors: e.g. if a crop is water limited, farmers can adapt their practices and reduce their nutrient applications accordingly. Sensitivity tests where the demand would be derived from actual yield (instead of potential yield, as in the Main Text) could help in the determination of areas where other limiting factors might play a role (Fig. S2). The next step is to consider more limiting factors together.
Our computation of RN and RP, i.e. the increase in RN and RP required to increase RNP is
based on the minimum “physiological” needs for plants. Behind the multiple limitation's mathematical formalism, an increase in RNP can be achieved for different combinations
of increases in N and P (i.e. for different couples (RN, RP)): despite non-substitution at
410
415
420
425
the molecular or cellular level (Sinclair & Park, 1993), one element can partly compensate for the other at the plant scale. Here, we considered only one couple (Fig. 3), while external variables such as the price or the ease of access to fertilizers will also influence the farmer's choice and could make him/her select another NP combination. This should be taken into account in future attempts to make link with scenarios of nutrient management and policy more straightforward. RN and RP could be translated to
increase in soil supply by considering nutrient demand in each grid-cell. However such change in supply cannot be easily translated into a change in fertilizer, since our supply estimates take into account some processes occurring after the fertilizer application: for P, we take into account the dynamics of P in soil (diffusion and root uptake) while for N, we allow for NH3 volatilization. Our nutrient requirement calculation is driven solely by
nutrient limitation, independently of yield gap, contrary to previous estimates based on: soil quality indicators (with no distinction between N and P) (Fischer et al., 2012; Pradhan et al., 2015), statistical relationships between fertilizer application and yield (Mueller et al., 2012) or “N uptake gaps” based on yield gap and minimal/maximal values of the physiological N efficiency in aboveground biomass derived from the QUEFTS model (ten Berge et al., 2019; Schils et al., 2018). More generally, our nutrient limitation is not straight connected to the yield gap because the actual yield is not used in our computation.
Our theoretical analysis has also few caveats. In particular, we assumed a linear relationship between RNP and the productivity of each experiment (Eq. 9-11). As
underlined in the method section, our conclusions are still valid if we assumed a linear relationship up to a value thresh if thresh replaces 1 in the definition categories given in Table 1. The value thresh is nevertheless theoretical because the calculated nutrient limitation (RN, RP, RNP) has no physical meaning and is disconnected from physical
435
440
445
450
measure of e.g. soil P content (Olsen P, etc.). The fact that the transition between linear and plateau regimes occurs for the same RNP (1 or thresh) globally should be an
acceptable assumption as we took into account the spatial variation in soil properties to compute the soil nutrient supply.
Two formalisms are usually used to characterize multiple element limitation: in Liebig's law of the minimum, plants are generally limited by one nutrient at a time, while plants are generally co-limited in a multiple limitation hypothesis. Our study reveals that the choice of the formalism has only a marginal effect on the estimate of current global NP limitation (RNP) for the cereals considered. This result is explained by the fraction of
grid-cells in our approach that is within the area of the RN vs RP space that maximizes the
difference between the two formalisms. The formalism choice has a bigger effect on the increases in RN and RP required at the same time to alleviate the NP limitation. Because
of very different theoretical founding principles behind each formalism, the use of one or other formalism leads to very different estimates of occurrence of co-limitation in cropland. As mentioned earlier, Liebig's law of minimum or multiple limitation hypothesis could be considered as macro-properties that reflect the same processes of plant adjustments but, depending on the context, plant adjustments lead to one or the other formalism (Ågren et al., 2012). It was also stipulated (Farrior et al., 2013) that plants can be limited by only one resource at a time, but that the integration of the different limitations in time makes the plants limited by several resources at the scale of the growing season. In our point of view, the use of mechanistic models, through the representation of dynamic allocation (e.g. through a cost-based approach (Franklin et al., 2012)) and floating C:nutrient ratios (Zaehle and Dalmonech, 2011) would allow the explicit consideration of some plant adjustments, preventing the need to choose 460
465
470
475
References
Achat, D. L., Augusto, L., Gallet-Budynek, A. and Loustau, D.: Future challenges in coupled C–N– P cycle models for terrestrial ecosystems under global change: a review, Biogeochemistry, 131(1-2), 173–202, doi:10.1007/s10533-016-0274-9, 2016.
Ågren, G. I., Wetterstedt, J. Å. M. and Billberger, M. F. K.: Nutrient limitation on terrestrial plant growth - modeling the interaction between nitrogen and phosphorus, New Phytol., 194(4), 953–960, doi:10.1111/j.1469-8137.2012.04116.x, 2012.
Augusto, L., Achat, D. L., Jonard, M., Vidal, D. and Ringeval, B.: Soil parent material-A major driver of plant nutrient limitations in terrestrial ecosystems, Glob. Change Biol.,
doi:10.1111/gcb.13691, 2017.
Bai, Z., Li, H., Yang, X., Zhou, B., Shi, X., Wang, B., Li, D., Shen, J., Chen, Q., Qin, W., Oenema, O. and Zhang, F.: The critical soil P levels for crop yield, soil fertility and environmental safety in different soil types, Plant Soil, 372(1-2), 27–37, doi:10.1007/s11104-013-1696-y, 2013.
Barros, I. de, Williams, J. R. and Gaiser, T.: Modeling soil nutrient limitations to crop production in semiarid NE of Brazil with a modified EPIC version, Ecol. Model., 178(3-4), 441–456,
doi:10.1016/j.ecolmodel.2004.04.015, 2004.
Ten Berge, H. F. M., Hijbeek, R., van Loon, M. P., Rurinda, J., Tesfaye, K., Zingore, S., Craufurd, P., van Heerwaarden, J., Brentrup, F., Schröder, J. J., Boogaard, H. L., de Groot, H. L. E. and van Ittersum, M. K.: Maize crop nutrient input requirements for food security in sub-Saharan Africa, Glob. Food Secur., 23, 9–21, doi:10.1016/j.gfs.2019.02.001, 2019.
Von Bloh, W., Schaphoff, S., Müller, C., Rolinski, S., Waha, K. and Zaehle, S.: Implementing the nitrogen cycle into the dynamic global vegetation, hydrology, and crop growth model LPJmL (version 5.0), Geosci. Model Dev., 11(7), 2789–2812, doi:10.5194/gmd-11-2789-2018, 2018. Bouwman, L., Goldewijk, K. K., Van Der Hoek, K. W., Beusen, A. H. W., Van Vuuren, D. P., Willems, J., Rufino, M. C. and Stehfest, E.: Exploring global changes in nitrogen and phosphorus cycles in agriculture induced by livestock production over the 1900-2050 period, Proc. Natl. Acad. Sci. USA, doi: 10.1073/pnas.1012878108, doi:10.1073/pnas.1012878108, 2011a.
Bouwman, L., Goldewijk, K. K., Van Der Hoek, K. W., Beusen, A. H. W., Van Vuuren, D. P., Willems, J., Rufino, M. C. and Stehfest, E.: Exploring global changes in nitrogen and phosphorus cycles in agriculture induced by livestock production over the 1900-2050 period, Proc. Natl. Acad. Sci., doi:10.1073/pnas.1012878108, 2011b.
Bouwman, L., Beusen, A. H. W., Lassaletta, L., van Apeldoorn, D. F., van Grinsven, H. J. M., Zhang, J. and Ittersum van, M. K.: Lessons from temporal and spatial patterns in global use of N and P fertilizer on cropland, Sci. Reports, 7, 40366, doi:10.1038/srep40366, 2017.
Van Bussel, L. G. J., Stehfest, E., Siebert, S., Müller, C. and Ewert, F.: Simulation of the
phenological development of wheat and maize at the global scale: Simulation of crop phenology at global scale, Glob. Ecol. Biogeogr., 24(9), 1018–1029, doi:10.1111/geb.12351, 2015.
Colomb, B., Debaeke, P., Jouany, C. and Nolot, J. M.: Phosphorus management in low input stockless cropping systems: Crop and soil responses to contrasting P regimes in a 36-year experiment in southern France, Eur. J. Agron., 26(2), 154–165, doi:10.1016/j.eja.2006.09.004,
2007.
Conant, R. T., Berdanier, A. B. and Grace, P. R.: Patterns and trends in nitrogen use and nitrogen recovery efficiency in world agriculture, Glob. Biogeochem. Cycles, 27(2), 558–566,
doi:10.1002/gbc.20053, 2013.
Davidson, A. E. and Howarth, W. R.: Nutrient in synergy, Nature, 449(7165), 1000, 2007.
Deguchi, S., Uozumi, S., Touno, E., Uchino, H., Kaneko, M. and Tawaraya, K.: White clover living mulch reduces the need for phosphorus fertilizer application to corn, Eur. J. Agron., 86, 87–92, doi:10.1016/j.eja.2017.03.006, 2017.
Van Duivenbooden, N.: Sustainability in terms of nutrient elements with special reference to West-Africa, CABO-DLO., 1992.
Elser, J. J., Bracken, M. E. S., Cleland, E. E., Gruner, D. S., Harpole, W. S., Hillebrand, H., Ngai, J. T., Seabloom, E. W., Shurin, J. B. and Smith, J. E.: Global analysis of nitrogen and phosphorus limitation of primary producers in freshwater, marine and terrestrial ecosystems, Ecol. Lett., 10(12), 1135–1142, doi:10.1111/j.1461-0248.2007.01113.x, 2007.
Farrior, C. E., Tilman, D., Dybzinski, R., Reich, P. B., Levin, S. A. and Pacala, S. W.: Resource limitation in a competitive context determines complex plant responses to experimental resource additions, Ecology, 94(11), 2505–2517, 2013.
Fischer, G., Nachtergaele F.O., Prieler S., Teixeira E., Toth G., van Velthuizen H., Verelst L. and Wiberg D.: Global Agro_ecological Zones (GAEZ ver 3.0), Model documentation,, 2012. Folberth, C., Elliott, J., Müller, C., Balkovic, J., Chryssanthacopoulos, J., Izaurralde, R. C., Jones, C. D., Khabarov, N., Liu, W., Reddy, A., Schmid, E., Skalský, R., Yang, H., Arneth, A., Ciais, P., Deryng, D., Lawrence, P. J., Olin, S., Pugh, T. A. M., Ruane, A. C. and Wang, X.: Uncertainties in global crop model frameworks: effects of cultivar distribution, crop management and soil handling on crop yield estimates, Biogeosciences Discuss., 1–30, doi:10.5194/bg-2016-527, 2016.
Franklin, O., Johansson, J., Dewar, R. C., Dieckmann, U., McMurtrie, R. E., Brannstrom, A. and Dybzinski, R.: Modeling carbon allocation in trees: a search for principles, Tree Physiol., 32(6), 648–666, doi:10.1093/treephys/tpr138, 2012.
Goll, D. S., Brovkin, V., Parida, B. R., Reick, C. H., Kattge, J., Reich, P. B., van Bodegom, P. M. and Niinemets, ü.: Nutrient limitation reduces land carbon uptake in simulations with a model of combined carbon, nitrogen and phosphorus cycling, Biogeosciences, 9(9), 3547–3569,
doi:10.5194/bg-9-3547-2012, 2012.
Harpole, W. S., Ngai, J. T., Cleland, E. E., Seabloom, E. W., Borer, E. T., Bracken, M. E. S., Elser, J. J., Gruner, D. S., Hillebrand, H., Shurin, J. B. and Smith, J. E.: Nutrient co-limitation of primary producer communities: Community co-limitation, Ecol. Lett., 14(9), 852–862, doi:10.1111/j.1461-0248.2011.01651.x, 2011.
Van Ittersum, M. K., Cassman, K. G., Grassini, P., Wolf, J., Tittonell, P. and Hochman, Z.: Yield gap analysis with local to global relevance—A review, Field Crops Res., 143, 4–17,
doi:10.1016/j.fcr.2012.09.009, 2013.
Mollier, A., Mueller, N. D., Wang, X. and Ringeval, B.: Quantifying the Limitation to World Cereal Production Due To Soil Phosphorus Status, Glob. Biogeochem. Cycles,
doi:10.1002/2017GB005754, 2018.
Lassaletta, L., Billen, G., Grizzetti, B., Anglade, J. and Garnier, J.: 50 year trends in nitrogen use efficiency of world cropping systems: the relationship between yield and nitrogen input to cropland, Environ. Res. Lett., 9(10), 105011, doi:10.1088/1748-9326/9/10/105011, 2014.
Long, S. P., Ainsworth, E. A., Leakey, A. D., Nösberger, J. and Ort, D. R.: Food for Thought: Lower-Than-Expected Crop Yield Stimulation with Rising CO, Science, 312, 2006.
Mueller, N. D., Gerber, J. S., Johnston, M., Ray, D. K., Ramankutty, N. and Foley, J. A.: Closing yield gaps through nutrient and water management, Nature, 490(7419), 254–257,
doi:10.1038/nature11420, 2012.
Müller, C., Elliott, J. and Levermann, A.: Food security: Fertilizing hidden hunger, Nat. Clim. Change, 4(7), 540, 2014.
Peñuelas, J., Poulter, B., Sardans, J., Ciais, P., van der Velde, M., Bopp, L., Boucher, O., Godderis, Y., Hinsinger, P., Llusia, J., Nardin, E., Vicca, S., Obersteiner, M. and Janssens, I. A.: Human-induced nitrogen–phosphorus imbalances alter natural and managed ecosystems across the globe, Nat. Commun., 4, doi:10.1038/ncomms3934, 2013.
Pradhan, P., Fischer, G., van Velthuizen, H., Reusser, D. E. and Kropp, J. P.: Closing Yield Gaps: How Sustainable Can We Be?, edited by J. L. Gonzalez-Andujar, PLOS ONE, 10(6), e0129487, doi:10.1371/journal.pone.0129487, 2015.
Redel, Y. D., Rubio, R., Rouanet, J. L. and Borie, F.: Phosphorus bioavailability affected by tillage and crop rotation on a Chilean volcanic derived Ultisol, Geoderma, 139(3-4), 388–396,
doi:10.1016/j.geoderma.2007.02.018, 2007.
Restelatto, R., Menezes, L. F. G. de, Paris, W., Sartor, L. R., Martin, T. N., Herrera, W. F. B. and Pavinato, P. S.: Sorghum and black oat forage production and its nutritive value under phosphate levels, Semina Ciências Agrárias, 38(1), 429, doi:10.5433/1679-0359.2017v38n1p429, 2017. Ringeval, B., Nowak, B., Nesme, T., Delmas, M. and Pellerin, S.: Contribution of anthropogenic phosphorus to agricultural soil fertility and food production, Glob. Biogeochem. Cycles, 28(7), 743–756, doi:10.1002/2014GB004842, 2014.
Ringeval, B., Augusto, L., Monod, H., van Apeldoorn, D., Bouwman, L., Yang, X., Achat, D. L., Chini, L. P., Van Oost, K., Guenet, B., Wang, R., Decharme, B., Nesme, T. and Pellerin, S.: Phosphorus in agricultural soils: drivers of its distribution at the global scale, Glob. Change Biol., doi:10.1111/gcb.13618, 2017.
Ringeval, B.: Global gridded dataset about supply and demand for nitrogen and phosphorus for maize, https://doi.org/10.15454/NXYH6G, Portail Data Inra, DRAFT VERSION, 2019
Ryan, M. H. and Graham, J. H.: Little evidence that farmers should consider abundance or diversity of arbuscular mycorrhizal fungi when managing crops, New Phytol., 220(4), 1092–1107,
doi:10.1111/nph.15308, 2018.
95(1), 13–29, doi:10.1016/j.fcr.2005.01.020, 2006.
Sattari, S. Z., Bouwman, A. F., Giller, K. E. and van Ittersum, M. K.: Residual soil phosphorus as the missing piece in the global phosphorus crisis puzzle, Proc. Natl. Acad. Sci. USA, 109(16), 6348–6353, doi:10.1073/pnas.1113675109, 2012.
Sattari, S. Z., van Ittersum, M. K., Bouwman, A. F., Smit, A. L. and Janssen, B. H.: Crop yield response to soil fertility and N, P, K inputs in different environments: Testing and improving the QUEFTS model, Field Crops Res., 157, 35–46, doi:10.1016/j.fcr.2013.12.005, 2014.
Schils, R., Olesen, J. E., Kersebaum, K.-C., Rijk, B., Oberforster, M., Kalyada, V., Khitrykau, M., Gobin, A., Kirchev, H. and Manolova, V.: Cereal yield gaps across Europe, Eur. J. Agron., 101, 109–120, 2018.
Sinclair, T. R. and Park, W. I.: Inadequacy of the Liebig limiting-factor paradigm for explaining varying crop yields, Agron. J., 85(3), 742–746, 1993.
Sistla, S. A. and Schimel, J. P.: Stoichiometric flexibility as a regulator of carbon and nutrient cycling in terrestrial ecosystems under change: Research review, New Phytol., 196(1), 68–78, doi:10.1111/j.1469-8137.2012.04234.x, 2012.
De Wit, C. de: Resource use efficiency in agriculture, Agric. Syst., 40(1-3), 125–151, 1992. Zaehle, S. and Dalmonech, D.: Carbon–nitrogen interactions on land at global scales: current understanding in modelling climate biosphere feedbacks, Curr. Opin. Environ. Sustain., 3(5), 311– 320, doi:10.1016/j.cosust.2011.08.008, 2011.
Tables
Table 1 (two pages). Nutrient limitation categories defined in Harpole et al. (2011) and occurrence for each crop in our modelling approach with MH formalism. pro+X is the
change in productivity following the application of +X (with X=N, P or NP) in fertilization experiments. In the 1st column, the y-axis defines ecosystem productivity and the dots
correspond to the different experiments (white: control, blue: after addition of P, red: after addition of N, magenta: after addition of NP). Each category is defined as function of i) the character null or non-null of pro+N and pro+P and ii) the relationship between
pro+NP and (pro+N+pro+P) (3th column). Synergistic co-limitation means that
Δpro+NP>Δpro+N+ Δpro+P . The different categories (columns 1-3) are derived from
Harpole et al. (2011) while category B is restricted here to the “super-additive case” (sub-additive or (sub-additive are neglected because they cannot happen in MH or LM, see Text S1).
485
490
Long name of the category, letter
used hereafter and figure
Co-limitation Definition of the category
Analytic conditions required to be in that category for MH * Occurrence for MH: % of global crop area (% of grid-cells) Analytic conditions required to be in that category for LM Occurrence for LM: % of global maize area (% of grid-cells) Silmutaneous co-limitation A True and synergistic Δpro+N=0 Δpro+P=0 Δpro+NP>Δpro+N+ Δpro+P
RN=0 and RP=0 0.0±0.0 (0.0±0.0) RP=RN≠1 (0.0±0.0)0.0±0.0 Independent co-limitation; super-additive B True and synergistic Δpro+N≠0 Δpro+P≠0 Δpro+NP>Δpro+N+ Δpro+P
RN in ]0,1[ and RP in ]0,1[ 41.7±0.6 (35.9±0.3) Cannotoccur (0.0±0.0)0.0±0.0 Serial limitation N C Synergistic Δpro+N≠0 Δpro+P=0
Δpro+NP>Δpro+N+ Δpro+P
RN=0 and RP in ]0,1[ 6.7±0.3 (8.9±0.2) RN<RP and RP(E2)<RN(E2) ** 6.3±0.4 (9.4±0.2) Serial limitation P D Synergistic Δpro+N=0 Δpro+P≠0 Δpro+NP>Δpro+N+ Δpro+P
RN in ]0,1[ and RP=0 0.0±0.0 (0.0±0.0) RRN(EP<R3)<RN andP(E3) 9.5±0.5 (10.6±0.3) Single-resource response N E No Δpro+N≠0 Δpro+P=0
Δpro+NP=Δpro+N+Δpro+P
RN in [0,1[ and RP=1 37.1±0.6 (46.0±0.4) RN<RP and RP(E2)≥RN(E2) *** 48.4±0.8 (60.7±0.5) Single-resource response P F No Δpro+N=0 Δpro+P≠0
Δpro+NP=Δpro+N+Δpro+P
RN=1 and RP in [0,1[ 2.7±0.3 (1.3±0.1) RandP<RN RN(E3)≥RP(E3) 24.0±0.9 (11.5±0.5) 500
No response G
No
Δpro+N=0 Δpro+P=0
Δpro+NP=Δpro+N+Δpro+P
RN=1 and RP=1 11.8±0.3 (7.8±0.1) RN=1 and RP=1 11.8±0.3 (7.8±0.1)
* a reversed bracket used in an interval means that the corresponding endpoint is excluded
from the interval; e.g. R in [0,1[ means 0≤R<1. ** corresponds to “E1: N-limited and E2: P-limited”
*** corresponds to “E1: N-limited and (E2: N-limited or NP-limited or not limited at all)”
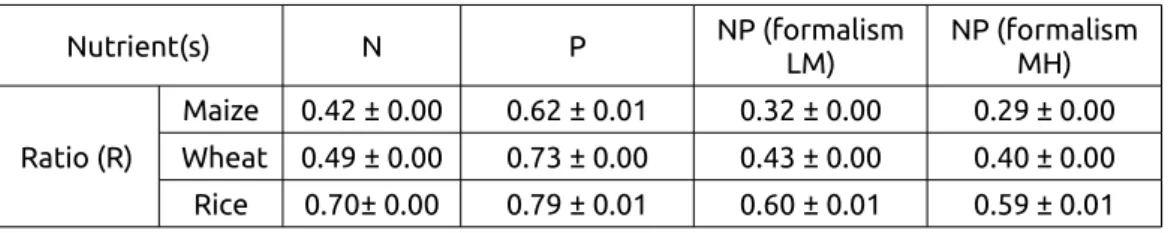
Table 2. Global values (± one standard-deviation) of the supply/demand ratio (R) for N, P or NP. Nutrient(s) N P NP (formalism LM) NP (formalism MH) Ratio (R) Maize 0.42 ± 0.00 0.62 ± 0.01 0.32 ± 0.00 0.29 ± 0.00 Wheat 0.49 ± 0.00 0.73 ± 0.00 0.43 ± 0.00 0.40 ± 0.00 Rice 0.70± 0.00 0.79 ± 0.01 0.60 ± 0.01 0.59 ± 0.01 510
Figures
Figure 1. Fertilization experiments. The different experiments (E1-E4) vary as function of
their supply of N (SN or SN+AN) and P (SP or SP+AP).
Figure 2. RNP, RN and RP for any values of RP (x-axis) and RN (y-axis). Each variable is
provided for the two formalisms (LM and MH) as well as for the difference LM-MH. Grey transparent dots in panels c,f,i correspond to all grid-cells considered for maize in our modelling approach.
520
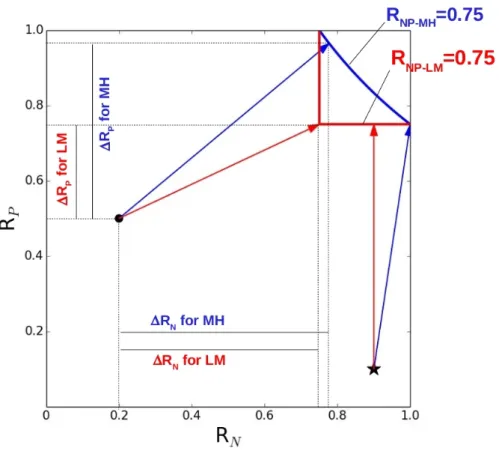
Figure 3. Schematic representation of the computation of (RN, RP). A given grid-cell is
defined by its (RN, RP) in the plan characterized by the base ( ⃗RN, ⃗RP) . For a given
grid-cell and a given formalism, we called ⃗u the shortest vector linking (RN, RP) and the
curve (or segments) defining RNP=0.75. We called x and y the compounds of ⃗u in the
basis ( ⃗RN, ⃗RP) , i.e. ⃗u=
(
xy)
. We defined Δ RN=max(0, x) and Δ RP=max (0, y) . Inthe above figure, two grid-cells are provided as an example: (RN=0.2; RP=0.5) for the black
dot, and (RN=0.9; RP=0.1) for the black star. The formalism of interaction defines the
(RN,RP) couples that make RNP=0.75: the blue curve defines RNP=0.75 for MH while the two
orthogonal red segments define RNP=0.75 for LM. ⃗u is provided for each grid-cell and
each formalism (blue arrow for MH ; red arrow for LM). We explicitly plotted the RN and
RP for the black dot and the two formalisms (solid black lines). Note that for the
grid-cell symbolized by the black star, Δ RN=0 for LM. 530
535
Figure 4. Spatial distribution of the categories defined in Table 1 and in Harpole et al. (2011) for MH (a) and LM (b) for maize. For LM, whether one grid-cell belongs either to category C (dark blue) or to category E (cyan) depends on the value of AN. The same
reasoning applies for categories D (yellow) and F (red) with AP.
Data and Code availability:
Files corresponding to supply and demand for N and P (variables called SN, SP, DN, DP in
the manuscript) are made available (Ringeval et al. ,2019) on the following link.
Computer scripts written by the authors to generate and manipulate files of supply and demand for N and P are available upon request to the corresponding author.
Acknowledgements:
This research was supported by the “Institut National de la Recherche Agronomique” (INRA) and the Environnement et Agronomie (EA) division. We thank Thomas A.M. Pugh, Frédéric Barraquand, Alain Mollier, Pascal Denoroy and Noémie Schaller for helpful discussion. Finally, we would like to thank Aldyth Nys for her assistance with the linguistic aspects of this paper. Modelling and analysis were performed in using Python (Python Software Foundation. Python Language Reference, version 2.7. Available at http://www.python.org).
Author contribution:
B.R conceived the project; B.R. and M.K. performed the computations; B.R, S.P and L.A analysed the results; N.D.M, C.M, T.A.M.P and X.W. provided datasets and their expertise on these datasets; B.R, M.K, L.A, P.C, D.G, N.D.M, C.M, T.N, T.A.M.P, N.V, S.P wrote the article.
Competing interests:
The authors declare no conflict of interest. 550 555 560 565 570 575