HAL Id: hal-01315386
https://hal.archives-ouvertes.fr/hal-01315386
Submitted on 13 May 2016
HAL is a multi-disciplinary open access
archive for the deposit and dissemination of
sci-entific research documents, whether they are
pub-lished or not. The documents may come from
teaching and research institutions in France or
abroad, or from public or private research centers.
L’archive ouverte pluridisciplinaire HAL, est
destinée au dépôt et à la diffusion de documents
scientifiques de niveau recherche, publiés ou non,
émanant des établissements d’enseignement et de
recherche français ou étrangers, des laboratoires
publics ou privés.
Determination of plutonium in nitric acid solutions
using energy dispersive L X-ray fluorescence with a low
power X-ray generator
J Py, J.-E Groetz, J.-C Hubinois, D Cardona
To cite this version:
J Py, J.-E Groetz, J.-C Hubinois, D Cardona. Determination of plutonium in nitric acid solutions
using energy dispersive L X-ray fluorescence with a low power X-ray generator. Nuclear Instruments
and Methods in Physics Research Section A: Accelerators, Spectrometers, Detectors and Associated
Equipment, Elsevier, 2015, 780, pp.131-137. �10.1016/j.nima.2015.01.073�. �hal-01315386�
Determination of plutonium in nitric acid solutions using
energy dispersive L X-ray fluorescence with a low power X-ray
generator
J. Pya,b, J.-E. Groetza,∗, J.-C. Hubinoisb, D. Cardonab
aLaboratoire Chrono-Environnement, UMR CNRS 6249, Universit´e de Franche-Comt´e, 16 route de
Gray, F-25030 Besan¸con, France
bCommissariat `a l’ ´Energie Atomique, Centre de Valduc, F-21120 Is-sur-Tille, France
Abstract
This work presents the development of an in-line energy dispersive L X-ray fluorescence spectrometer set-up, with a low power X-ray generator and a secondary target, for the determination of plutonium concentration in nitric acid solutions. The intensity of the L X-rays from the internal conversion and gamma rays emitted by the daughter nuclei from plutonium are minimized and corrected, in order to eliminate the interferences with the L X-ray fluorescence spectrum. The matrix effects are then corrected by the Compton peak method. A calibration plot for plutonium solutions within the range 0.1-20 g.L−1 is given.
Keywords: L X-rays, EDXRF, Secondary target, Plutonium, SDD detector, Compton Peak correction
1. Introduction
The energy dispersive X-ray fluorescence spectrometry (EDXRF) is used to quantify rapidly, simultaneously and by non-destructive assays, the transuranic elements (ura-nium, neptu(ura-nium, pluto(ura-nium, americium) in liquid wastes from the nuclear reprocessing plants. In the last 30 years, several configurations have been developed to determine in-line transuranic elements by excitation of K-lines from radionuclide sources or X-ray tube [1–4]. Only a few configurations have been developed by excitation of L-lines from radionuclides or X-ray tube, mainly with a wavelength-dispersive X-Ray fluorescence in-strument: one is installed in a glove box at the Los Alamos National Laboratory leading to a sensitivity of around 2 ppm for uranium [5–8], another one was installed for in-line processes at AREVA La Hague [9] or CEA Marcoule in France. These devices use a spe-cific detector and a X-ray generator of high power, requiring liquid cooling and a graphite monochromator for selecting the element which will be analysed. Other configurations use HPGe detectors to measure self-induced X-ray fluorescence in spent nuclear fuel [10].
∗Corresponding author Tel. : + 33 3 81 66 65 07 ; fax: + 33 3 81 66 65 22
Email address: jegroetz@univ-fcomte.fr (J.-E. Groetz)
Advanced technology makes now possible a portable device for on-site analysis of the L X-rays transuranic elements by EDXRF without liquid cooling [11], in order to minimize as low as possible the amount of solid or liquid wastes. The purpose of this work is to develop, with an adjustable prototype, a new compact fluorescence L X-ray spectrometer and an analytical method to determine on a derivation duct, without dilution, the concentration value of plutonium within 0.1-20 g.L−1in nitric acid solution (10% HNO3). In these solutions, the concentration values of uranium and americium
are deliberately lower than the limit of detection of the spectrometer (∼ 10 mg.L−1 for a counting time of 300 s), so as not to interfere with the plutonium peaks.
2. Experimental
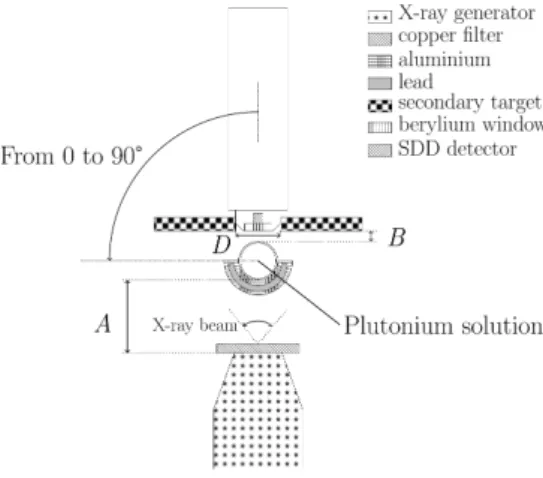
For the development of this spectrometer, two thallium standard solutions were firstly used to limit as low as possible the number of experiments with nuclear materials, and secondly, several plutonium solutions were prepared with ultra-pure plutonium standard. Then, these solutions were measured by our L X-ray fluorescence prototype spectrometer (Fig. 1).
Figure 1: Top view of the L X-ray fluorescence spectrometer used for the determination of plutonium in nitric acid solutions. A: distance from the X-ray generator to the sample. B : distance from the secondary target to the sample. D : diameter of the circular hole for the secondary target.
2.1. Properties of plutonium standard
A solid plutonium standard was used to prepare plutonium solutions. This standard has a 239
94Pu isotopic concentration higher than 90% and some radioactive impurities.
The concentration values of uranium and americium were analysed in September 2007 by inductively coupled plasma mass spectrometry and inductively coupled plasma atomic emission spectroscopy respectively, at 31 µg/g and 18 µg/g. These concentration values were then evaluated at the date of the experiments with an internal CEA evolution code of isotopic composition. The241Am concentration value (from the β− decay of24194Pu
with a half-life of 14.29 years), is evaluated at 33 µg/g. The total uranium concentration is evaluated at 200 µg/g.
2.2. Plutonium solution preparation
Plutonium solutions were prepared in glovebox by using this solid standard Pu diluted in nitric acid solution and 18.2 MΩ.cm deionised water. From this solution, five samples were prepared into 5 mL volumetric flasks in 10% HNO3, containing respectively 19.98,
9.99, 4.99, 9.99.10−1and 9.99.10−2g.L−1of plutonium. Flasks are in polypropylene (PP, 1 mm thick, 90 mm high and diameter of 12 mm) and are moved out of the glovebox to be measured by XRF. Flasks were then put into a double flexible plastic shield made up of ethylene-vinyl acetate and ethylene-butyl acrylate (EVA/EBA), each one 0.3 mm thick and a width of 14 cm, in order to confine radioactive elements and to protect operators. 2.3. Instrumentation
To decrease as low as possible the amount of solid or liquid nuclear wastes, the instru-mentation requires compact devices without liquid cooling. If the plutonium detection limit is higher than 0.1 g.L−1, a low power X-ray generator cooled by thermal conduction could be used. The X-ray generator is a 50 kV MAGNUM Cabled (Moxtek, USA) made up of a tungsten filament, a silver target metal (Ag) and a beryllium window of 0.25 mm thick. The voltage can be adjusted from 10 to 50 kV and the beam current up to 200 µA; the maximum power for the X-ray production is 10 W. The X-ray generator is operated with a Moxtek FTC-200 Controller. Firstly, the X-ray generator parameters are adjusted during experiments at 50 kV and 50 µA. The fluorescence X-rays emitted from the sample are measured between 0.2 and 20 keV by a silicon drift detector (SDD) cooled with a Peltier module (Ketek, Germany) with a beryllium window of 8 µm thick and a detection area of 7 mm2. The energy resolution at 5.8 keV is 148 eV and the shaping time of the detector amplifier is 2 µs. The analog signal from the amplificator was converted into a digital signal by an analog-to-digital converter (ADC, KeteK) and is analysed through a multichannel analyser with 4096 channels (MCA, Ketek) to generate the spectra with the MCDWIN software. The intensity of L X-rays was determined by a Gaussian fit.
The distance A between the X-ray generator and the sample and the distance B between the secondary target and the sample are controlled through a graphical user interface and electric motors. The distance between the X-ray generator and the sample ranges from 12 to 40 mm and the distance between the secondary target and the sample varies within limits of 3 mm and 30 mm. The detector angular position ranges from 0° to 90°.
A big circular secondary target is placed in front of the detector (section 3.1). Its characteristics are 50 mm in diameter and 2 mm thick. A circular aperture takes place at the centre of the secondary target so that X-rays emitted by the sample reaches the detector.
A lead half protection of 1.14 mm thick covered with a 0.7 mm thick aluminium sheet is used to stop the polychromatic radiations from the X-ray generator and to protect operators from the lead toxicity.
To analyse plutonium samples in a double plastic shield (EVA/EBA), an aluminium sample support has been designed with a container to maintain and protect the plastic shield, and to contain the solution in case of vial leak (Fig. 2).
These instruments are in a lead box (50 cm × 50 cm × 65 cm) to protect operators from X-rays.
Figure 2: Support used to analyse plutonium samples.
3. Determination of the optimum geometry 3.1. Requirements
The interpretation of X-rays spectra from plutonium samples must be carefully per-formed with portable EDXRF instruments, as the peak intensities are not necessarily correlated with the concentration values of the elements [12]. Daughter nuclei can be in excited states after alpha decays from238
94Pu to23492U, from23994Pu to23592U, from24094Pu to 236
92U and from24294Pu to23892U. Two relaxation processes are then possible: either γ-rays
are emitted with an energy generally higher than 50 keV [13], or X-rays from daughter nucleus are emitted from an internal conversion. Thus X-rays from internal conversion and γ-rays from de-excitation of the nuclear state are added to the characteristic X-rays from fluorescence. The use of the detector in the range 0.2-20 keV has the advantage to eliminate most of γ-rays, and avoid high saturation of the SDD detector. As an exam-ple, a low concentration of americium can saturate the detector because of two highly intense gamma peaks at 26.3 keV and 59.5 keV [5]. In the present case, the problem of L X-rays line analysis is mainly limited to the interference between X-rays from internal conversion and X-rays from fluorescence.
Two solutions are possible to correct the interference due to internal conversion and to correlate the peak intensities to the concentration values of elements. The first solu-tion is to use a high powered X-ray source which requires in some cases a collimator in front of the detector [2, 12, 14]. The second solution is to perform a subtraction process between an active spectrum (with the X-ray generator) and a passive background spec-trum where only X-rays from internal conversion and γ-rays due to plutonium isotopes are measured [14]. Since a low power X -ray generator is used, the yield of the irradiation of the plutonium samples is optimized to use as far as possible the low X-ray flux emit-ted by the generator, to increase the intensity of L X-ray fluorescence and to carry out a unique measurement. This is the reason why the X-ray generator is not collimated in this work. If the decay background is significant compared to the intensity of fluorescence X-rays, it is subtracted to the active spectrum.
When the concentration values of elements are higher than several g.L−1, X-rays flu-orescence are self-absorbed, absorbed and enhanced by nearby atoms [5, 15, 16]. These effects must be corrected by rigorous analysis techniques to accurately determine the con-centration of elements (with an uncertainty lower than 10%). Several possible corrections exist [17, 18] to fix the absorption effects:
1. the linear approximation with a thin sample, or a low concentration or a constant matrix,
2. the method which represents the intensity of X-rays as a function of the element concentration,
3. the method with internal element standardisation, 4. the dilution,
5. the Compton peak correction.
Items 1 and 2 are intended for a simple analysis and could lead to large errors. The methods by internal element standardisation or by dilution are not adapted because additional preparations are required in these cases. The Compton correction could be used, because the intensity of the Compton scattered radiation from an X-ray source gives an estimation of the absorption coefficient of the whole sample [18]. The Ag-Kα1 ray emitted by the X-ray generator is higher than 20 keV and is not detected by
our SDD detector. The use of a secondary target, which is a technique to produce quasi-monochromatic secondary X-rays, should enable the measurement of the Compton scattered radiation below 20 keV.
3.2. Choice of the secondary target
The molybdenum was unsuited because the Mo-Kα1 fluorescence energy (17.48 keV,
see Table 1) is lower than the L3-edge of plutonium (L3-edge=18.06 keV). The use of a
secondary technetium target (Tc-Kα1=18.37 keV) was impossible insofar as this element
is radioactive and difficult to manipulate. Electrons from L2 and L1 shells of plutonium
Element 42Mo 43Tc 44Ru 45Rh
Energy of Kα1 (keV) 17.48 18.37 19.28 20.22
Table 1: Parameters for the choice of element for the secondary target.
are not ejected with the Ru-Kα1 line because the absorption edges are equal to 22.26
keV (L2-edge) and 23.11 keV (L1-edge). The strongest plutonium X-ray lines should be
the lines from the L3-shell, namely: Lα1,2, Lβ2, Lβ6, Lβ15 and Ll(Table 2). A secondary
target in ruthenium (purity of 99.9 %) was chosen, because ruthenium is the only natural and non radioactive element with a Kα1fluorescence energy lower than 20 keV and higher
than the L3-edge of plutonium. The ruthenium metal is unfortunately an extremely hard
and brittle material and consequently, difficult to machine for making a circular hole in the centre of secondary target. The diameter of the circular hole was 15 mm.
3.3. Pre-optimization of geometric parameters for the spectrometer
In order to minimize the number of experiments with plutonium samples, a pre-study is first performed with a 10 g.L−1thallium standard solution in 10% HNO3. In this way,
X-ray line Pu-Ll Pu-Lα2 Pu-Lα1 Pu-Lβ15 Pu-Lβ2 Pu-Lβ6
Energy (keV) 12.12 14.08 14.27 17.20 17.25 16.49
Probability 2.2 10−2 3.6 10−2 3.1 10−1 7.3 10−3 6.7 10−2 5.8 10−3 Table 2: Energy of X-ray and probability for radiative transition filling a vacancy in the L3-shell of
plutonium [13, 21, 22].
distances B (sample–secondary target) and A (X-ray generator–sample) are optimised to increase the intensity of the Tl-Lα1,2 and Compton peaks. The detector is aligned with
the sample and the X-ray generator to irradiate at the maximum the secondary target. To optimize these positions, the intensities of peaks of interest are measured according to the region of interest (ROI) showed in figure 3, during 300 s without the double plastic shield. The intensity of theses lines increases when the distance B is smaller and is maximum when the secondary target is closest to the sample (Tables 3 and 4). The maximum intensity is obtained at A = 40 mm and B = 3 mm.
B = Secondary target position 3 mm 5 mm 10 mm 15 mm 20 mm 25 mm 30 mm
Tl-Lα1,2 (counts) 122902 103957 51091 22312 9733 4167 985
Compton (counts) 281823 278283 155832 76433 36094 16013 3532
Table 3: Intensity of X-rays as a function of the secondary target position (mm), with the X-ray generator position at 20 mm.
A = X-ray generator position 12 mm 15 mm 20 mm 25 mm 30 mm 35 mm 40 mm
Tl-Lα1,2 (counts) 6131 28334 122902 229590 300738 328206 351195
Compton (counts) 11817 62825 281823 527287 655876 745867 821088
Table 4: Intensity of X-rays as a function of the X-ray generator position (mm), with the secondary target position at 3 mm.
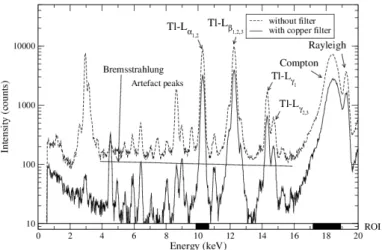
A copper filter of 0.1 mm thick is put in front of the X-ray generator to absorb bremsstrahlung (Fig. 3), which increases the signal-to-noise ratio (SNR) for the sample analysis within the range 0.1-20 g.L−1. Fig. 3 shows the Tl-Lα1,2 peak (10.27 keV),
the Compton peak, the Rayleigh peak (Ru-Kα1 = 19.28 keV) and artefact peaks. The
intensity of bremsstrahlung decreases about 80% whereas the intensity of Tl-Lα1,2 and
Compton peaks decreases respectively of 62% and 57%. The SNR is now acceptable. The detection limit (DL) is calculated according to the following relation using a 50 mg.L−1 thallium sample without a double plastic shield in 10% HNO3:
DL = 3σ
S (1)
where σ is the standard deviation of the signal from thallium obtained after ten analysis of blank solutions and S is the sensitivity of the Tl-Lα1,2peak (cps.L.mg
−1). The calculated
detection limit using a copper filter is acceptable (≈ 7 mg.L−1) in our case. Although the intensity of the Tl-Lα1,2 peak is approximately 30% lower with a double plastic shield
(EVA/EBA), plutonium samples should be quantified above 100 mg.L−1. 6
Figure 3: XRF spectra of a 10 g.L−1thallium sample in 10% HNO
3, analysed during 300 seconds with
a secondary target position at 3 mm and the X-ray generator position at 40 mm. The different ROI are specified on the energy axis with black rectangles.
3.4. Compton correction for matrix effects
The intensity of the Compton scattered radiation from a X-ray source can be used to obtain an estimation of the absorption coefficient of the specimen at the scattered wavelength (λscat). The intensity of the Compton scatter peak (ICompton) is inversely
proportional to the mass attenuation coefficient µsol [18, 19]:
ICompton(λscat) ∝
1 µsol(λscat)
(2) As the enhancement effects can be neglected, the fluorescence intensity Iiof the element
i is equal to :
Ii∝
Ci
µsol
∼ Ci× I(λCompton) (3)
This method is limited to those cases where trace element have their L-edges between their L X-lines and the scattered peaks. Thus the plutonium concentration is determined according to the following relation:
IP u−Lα1,2
ICompton
= a C + b (4)
where IPu−Lα1,2 is the Pu-Lα1,2 peak count rate, ICompton is the Ru Compton Kα peak
count rate, C is the plutonium concentration, a and b are regression coefficients. Results from the Compton correction are shown in section 4.2.
4. Results and discussion 4.1. Internal conversion
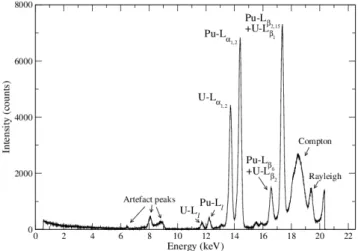
A plutonium sample at the concentration of 19.98 g.L−1 in 10% HNO3 is measured
during 300 s with an X-ray generator position at 48 mm (X-ray generator at 50 kV and 50 7
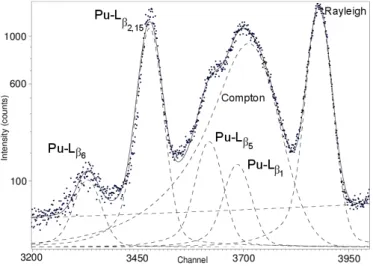
µA) and an secondary target position of 2 mm. As shown with the thallium samples, some artefact peaks and Compton and Rayleigh peaks are measured (Fig. 4). The plutonium fluorescence X-rays are generated from vacancies in the L3-shell, leading to the Pu-Ll,
Pu-Lα1,2 Pu-Lβ6 and Pu-Lβ2,15 lines. However, the intensity of Pu-Lβ2,15 line should not
be equivalent to the intensity of Pu-Lα1,2 line due to a smaller transition probability
(Table 2). The Pu-Lβ2,15 peak is also overlapped with the U-Lβ1 peak, given that the
U-Ll, U-Lα1,2, U-Lβ2 lines are produced. Although the total uranium concentration (4
mg.L−1) is lower than the detection limit, the intensity of the U-Lα1,2peak is about 60%
of the intensity of the Pu-Lα1,2 peak.
Figure 4: Active spectrum of a plutonium sample at 19.98 g.L−1 in 10% HNO3, analysed during 300
seconds.
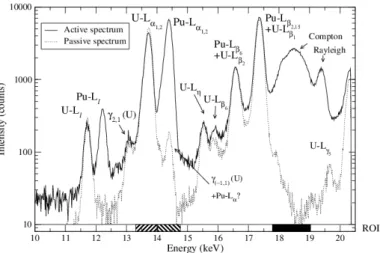
A passive spectrum has been recorded during 300 s to determine the effects from the radioactive decay. Fig. 5 shows the presence of intense U-L peaks due to internal con-version and two γ-ray energies. The intensity of the U-Lα1,2passive peak is nevertheless
higher than the U-Lα1,2 active one. To understand this fact, the repeatability of the
measurement of U-Lα1,2 peaks (ROI in Fig. 5) and the SDD dead time are determined
with:
three passive measurements during 300 s, three active measurements during 300 s.
None of parameters is modified between the different measurements.
The repeatability of the U-Lα1,2passive and active peak measurements is satisfactory,
meaning that for these elements and in this range of concentration, the number of X-rays from internal conversion is constant during 300 s (Table 5). We can conclude that X-rays from internal conversion combined with the fluorescence X-rays increase the SDD dead time for the active spectrum.
In order to reduce the background due to internal conversion, the diameter of the circular aperture at the centre of the secondary target is decreased. It is reduced from 15 mm to 5 mm and then 2 mm (Fig. 6). Fig. 7 shows the decrease in the intensities of the X-ray peaks from internal conversion. The intensity of Pu-L and Compton peaks
Figure 5: Active and passive spectra of plutonium sample at the concentration of 19.98 g.L−1 in 10%
HNO3, analysed during 300 seconds. The different ROI are specified on the energy axis with black and
hatched rectangles.
U-Lα1,2 Spectra
Average intensity Repeatability Average intensity Dead time
(counts) (%) (counts) (%)
Passive 236839 0.54 835135 3.05
Active 196596 0.13 2070948 12.70
Difference (%) -17
Table 5: Repeatability of analysis for the U-Lα1,2peak and dead time of SDD detector, measured for a
plutonium sample at the concentration of 19.98 g.L−1.
decreased in the same proportion. The detector dead time is also reduced at 2.8% for a diameter of 5 mm and 0.7% for a diameter of 2 mm. Moreover, the use of the secondary target with a circular aperture of 2 mm diameter decreases the artefact peaks, allowing the detection of impurities such as iron (Kα1 = 6.40 keV) and copper (Kα1 = 8.04 keV).
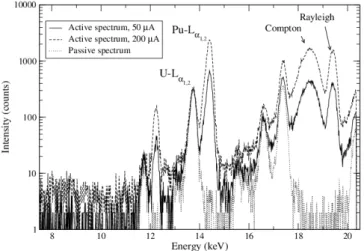
Using this secondary target, the X-ray generator is operated at the maximum power (200 µA) in order to intensify the Pu-L and the Compton peaks (Fig. 8). The SDD dead time is 2.66%. The intensity of U-Lα1,2active peak is now lower compared to the intensity
of Pu-Lα1,2 and is similar to the intensity of U-Lα1,2 passive peak. As the intensity of
X-rays from internal conversion is not negligible after these optimizations, the passive spectrum is subtracted to the active spectrum. The spectrum of the plutonium sample at 19.98 g.L−1 shows the X-rays of plutonium from L3-shell, the Compton and Rayleigh
peaks (Fig. 9). Nevertheless an important noise remains after subtraction for the U-Lα1,2
peak. In these conditions, the quantification of uranium in low concentration together with a high plutonium concentration could be difficult to perform.
Figure 6: Set-up with a smaller diameter for the aperture in the secondary target.
Figure 7: Active spectra of a plutonium sample at 4.995 g.L−1in 10% HNO
3for three aperture diameters
in the secondary target, measured for 300 s.
4.2. Correction of matrix effects
All plutonium samples are analysed during 300 s with the last configuration. After the subtraction of the passive spectrum to the active spectrum, the intensity of the Pu-Lα1,2
peak is determined for each plutonium sample with the MCDWIN software in the region of interest (Fig. 5 and Table 6). The intensity of this peak increases more weakly than the plutonium concentration (Fig. 10): the curve is concave due to the self-absorption of the Pu-Lα1,2 lines by the sample.
As the Compton peak is observed on every XRF spectrum, the method by the Comp-ton peak correction can be used to fix matrix effects. The intensity of the CompComp-ton peak is determined with the MCDWIN software for each plutonium sample in the region of interest (Fig. 5 and Table 6). It is noticed that for the highest values of plutonium
Figure 8: Active and passive spectra of a plutonium sample at 4.995 g.L−1in 10% HNO
3with a hole of
2 mm diameter in the secondary target, analysed during 300 s.
Figure 9: Spectra of a plutonium sample at 19.98 g.L−1in 10% HNO3 with a hole of 2 mm diameter in
the secondary target and a X-ray generator beam at 200 µA, analysed during 300 seconds.
concentration, the Compton peak has not a perfect Gaussian shape, due to a shoulder (Fig. 9 and Fig. 11). This shoulder, which is insignificant in relation to the Compton peak for plutonium concentrations lower than 10 g.L−1, is caused by the interference of the Pu-Lβ5 (at 17.96 keV) and Pu-Lβ1 (at 18.29 keV) X-ray fluorescence.
The MCDWIN software is inappropriate to process and unfold such a complex spec-trum, therefore the peaks in the region of interest are fitted by various mathematical functions with the COLEGRAM software [23, 24], in order to separate accurately the overlapped peaks (Fig. 12). In addition to the Pu-Lβ5 peak, the Pu-Lβ1 peak is also
fitted at 18.29 keV, because the upper part of the X-ray incident spectrum from the secondary target could eject electrons from L2 and L1 shells in plutonium, leading to
the the Pu-Lβ1 line. These plutonium X-ray peaks are fitted by Voigt functions with a
Figure 10: Matrix effects on the Pu-Lα1,2peak.
Figure 11: Peak intensities for various plutonium concentration values.
left-hand tail, as the shape of X-ray peaks is the result of a convolution of a Lorentzian function with a Gaussian function and combined with the incomplete charge collection in the SDD detector. The Compton peak is fitted by a Gaussian function with a left-hand tail. When the Compton peak shows this shoulder, the proportion of the intensity of the Pu-Lβ5 peak and the Pu-Lβ1 peak is then subtracted to the intensity of the Compton
peak according to the relation:
IComptoncorrected= IComptonMCDWIN× 1 −I
COLEGRAM P u−Lβ5 ICOLEGRAM Compton −I COLEGRAM P u−Lβ1 ICOLEGRAM Compton ! (5)
The subtraction of the Pu-Lβ5 and Pu-Lβ1 peaks is useless when the shoulder of the
Compton peak is not identified (CPu< 0.1 g.L−1), and the intensity of the Pu-Lβ5 and
Pu-Lβ1 peaks is lower than the uncertainty of measurement of the Compton peak.
Plutonium concentration (g.L−1) 0.1 1 5 10 20 IMCDWIN
Compton (counts) 260437 225804 192619 155370 138913
IComptoncorrected (counts) 115436 Table 6: Correction of the intensity for the Compton peak.
Figure 12: Fitting Pu-Lβ5, Pu-Lβ1 and Compton peaks for the plutonium sample at the concentration
of 19.98 g.L−1.
After the subtraction of the Pu-Lβ5 and Pu-Lβ1 peaks to the Compton peak, the ratio
IPu−Lα1,2/ICompton is proportional to the plutonium concentration on a more extended
range, between 0.1 g.L−1 and 20 g.L−1 (figure 13). Thus, the sample self-absorption effects are corrected. For the plutonium, the calibration equation is in this configuration:
IPu−Lα1,2
ICompton
= 0.1108 CPu (6)
where IPu−Lα1,2 is the intensity of the Pu-Lα1,2 peak, ICompton is the intensity of the
Compton peak and CPuis the plutonium concentration of the sample.
5. Conclusion
The present study demonstrates that plutonium can be quantified in the range within 0.1 g.L−1 and 20 g.L−1 in 10% HNO3, with an energy dispersive L X-ray fluorescence
compact spectrometer. Based on the measurements of the intensity of the Pu-Lα1,2
peak, it requires to eliminate the background due to internal conversion and to take into account matrix effects. Interferences from internal conversion are minimized with a geometrical optimization of the experimental system and by subtracting the passive spectrum to the active one. The Compton correction is used in order to fix matrix effects, especially from the acid solution. This way requires an unfolding process on the Compton peak, to eliminate the overlapped peaks from Pu-Lβ5and the Pu-Lβ1 lines. Further work
Figure 13: Ratio IPu−Lα1,2/IComptonas a function of the plutonium concentration after the subtraction
of the Pu-Lβ5 and the Pu-Lβ1peaks.
will concern the determination of uranium and americium concentrations in these acid solutions.
References
[1] T. Hoffmann, P. Hoffmann, K.H. Lieser, Journal of Radioanalytical and Nuclear Chemistry 82 (1984) 201.
[2] K.H. Lieser, P. Hoffmann, N. Pilz, Journal of Radioanalytical and Nuclear Chemistry 132 (1989) 121.
[3] T. Hoffmann, P. Hoffmann, Journal of Radioanalytical and Nuclear Chemistry 109 (1987) 419. [4] G. Andrew, B.L. Taylor, The measurement of Pu and U in reprocessing plant solutions by tube
excited K X-ray fluorescence, Journal of Radioanalytical and Nuclear Chemistry 62 (1981) 135. [5] R.S. Day, A.R. Vigil, Journal of Radioanalytical and Nuclear Chemistry 194 (1995) 107.
[6] M.L. Collins, G.J. Havrilla, Detection Limits for Actinides in a Monochromatic, Wavelength-Dispersive X-Ray Fluorescence Instrument, Proceedings of the 49th Annual Meeting of the Institute of Nuclear Materials Management, Tucson, Arizona, USA (2009).
[7] G. Havrilla, M.L. Collins, V. Montoya, Z. Chen, F. Wei, Monochromatic Wavelength Dispersive X-Ray Fluorescence Providing Sensitive and Selective Detection of Uranium Proceedings of the 50th Annual Meeting of the Institute of Nuclear Materials Management, Baltimore, Maryland, USA (2010).
[8] G. Havrilla, M.L. Collins, V. Montoya, H. Boukhalfa, B. Cipiti, hiRX Detection of Plutonium in Surrogate Spent Fuel Matrix, Proceedings of the 53rd Annual Meeting of the Institute of Nuclear Materials Management, Orlando, Florida, USA (2012).
[9] J. Chabert, Contrˆole-commande des usines de retraitement. Instrumentation, Techniques de l’ing´enieur, BN3445 (1997).
[10] A. Hoover, W.S. Charlton, M.L. Fensin, A. Rajasingam, C. Rudy, S. Saavedra A. Stafford, D. Strohmeyer, S. Tobin, Measurement of Plutonium in Spent Nuclear Fuel by Self-Induced X-ray Fluorescence, Proceedings of the 49th Annual Meeting of the Institute of Nuclear Materials Man-agement, Tucson, Arizona, (2009).
[11] H. Yoshii, K. Yanagihara, H. Imaseki, T. Hamano, H. Yamanishi, M. Inagaki, Y. Sakai, N. Sugiura, O. Kurihara, K. Sakai, PLOS one, Volume 9, Issue 7 (2014).
[12] C.G. Worley, Advances in X-ray Analysis 52 (2008) 90.
[13] ENDF/B-VII.1 2011 Nuclear Data Library, OECD Nuclear Agency, 2011. 14
[14] B.L. Taylor, B. Metcalfe, Observations on the choice of the excitation source for X-ray fluorescence determination of plutonium in solution, United Kingdom Atomic Energy Authority, HARWELL Laboratory, Oxfordshire, 1986.
[15] R.A. Dewberry, Nuclear Instruments and Methods A 403 (1998) 383.
[16] Li Wenli, G.D’ Ascenzo, R. Curini, G.M. Gasparini, M. Casarci, B. Mattia, D.M. Traverso, F. Bellisario, Analytica Chemica Acta 362 (1998) 253.
[17] J.-P. Eberhart, Analyse structurale et chimique des mat´eriaux, DUNOD, Paris, 1989.
[18] B. Beckhoff et al., Handbook of Practical X-Ray Fluorescence Analysis, SPRINGER, Berlin, 2006. [19] R. Vi´e le Sage, J.P. Quisefit, R. Dejean de la Bˆatie, J. Faucherre, X-Ray Spectrometry 8 (1979)
121.
[20] R.J.C. Brown, M.J.T. Milton, Trends in Analytical Chemistry 24 (2005) 266.
[21] R.D. Deslattes, E.G. Kessler, P. Indelicato, L. de Billy, E. Lindroth, J. Anton, Review of Modern Physics 75 (2003) 35.
[22] S.T. Perkins, D.E. Cullen et al., Tables and Graphs of Atomic Subshell and Relaxation Data Derived from the LLNL Evaluated Atomic Data Library (EADL), Z=1-100, UCRL-50400, Vol. 30, Lawrence Livermore National Laboratory (1991).
[23] M.C. L´epy, Presentation of the COLEGRAM software, Note Technique LHNB/04/26 (2004). [24] M.C. L´epy, J. Plagnard, L. Ferreux, Applied Radiations and Isotopes 66 (2008) 715.

![Table 2: Energy of X-ray and probability for radiative transition filling a vacancy in the L 3 -shell of plutonium [13, 21, 22].](https://thumb-eu.123doks.com/thumbv2/123doknet/13408334.406905/7.892.167.817.499.556/table-energy-probability-radiative-transition-filling-vacancy-plutonium.webp)