HAL Id: hal-03021507
https://hal.archives-ouvertes.fr/hal-03021507v2
Submitted on 12 Feb 2021
HAL is a multi-disciplinary open access
archive for the deposit and dissemination of
sci-entific research documents, whether they are
pub-lished or not. The documents may come from
teaching and research institutions in France or
abroad, or from public or private research centers.
L’archive ouverte pluridisciplinaire HAL, est
destinée au dépôt et à la diffusion de documents
scientifiques de niveau recherche, publiés ou non,
émanant des établissements d’enseignement et de
recherche français ou étrangers, des laboratoires
publics ou privés.
A model of apoptosis receptor reactions to study cell
fate decision
Luis Gomes-Pereira, Madalena Chaves, Jérémie Roux
To cite this version:
Luis Gomes-Pereira, Madalena Chaves, Jérémie Roux. A model of apoptosis receptor reactions to
study cell fate decision. MED 2020 - 28th Mediterranean Conference on Control and Automation, Sep
2020, Saint Raphaël, France. �hal-03021507v2�
HAL Id: hal-03021507
https://hal.archives-ouvertes.fr/hal-03021507
Submitted on 24 Nov 2020
HAL is a multi-disciplinary open access
archive for the deposit and dissemination of
sci-entific research documents, whether they are
pub-lished or not. The documents may come from
teaching and research institutions in France or
abroad, or from public or private research centers.
L’archive ouverte pluridisciplinaire HAL, est
destinée au dépôt et à la diffusion de documents
scientifiques de niveau recherche, publiés ou non,
émanant des établissements d’enseignement et de
recherche français ou étrangers, des laboratoires
publics ou privés.
To cite this version:
Luis Gomes-Pereira, Madalena Chaves, Jérémie Roux. A model of apoptosis receptor reactions to
study cell fate decision. MED 2020 - 28th Mediterranean Conference on Control and Automation, Sep
2020, Saint Raphael, France. �hal-03021507�
Abstract— The apoptotic signaling pathway designates a set of
biochemical reactions involved in programmed cell death. One of the triggering mechanisms of apoptosis is the binding of death ligands to death receptors on the cell membrane, a known stimulus for the activation of the so-called extrinsic apoptosis signaling pathway. Stimulation by death ligands results in an important variability in cell response dynamics that elicits differing fates: cell survival or cell death. To understand the hallmarks of this cell fate decision and the heterogeneity of cell response, a system of ordinary differential equations based on mass-action rate laws was implemented to represent the reactions at the receptor level and evaluate the cell dynamics in response to anticancer drugs.
I. INTRODUCTION
Apoptosis is a complex network of biochemical reactions eventually leading to programmed cell death, a mechanism to ensure organism homeostasis and the elimination of tumor cells. The disruption of the apoptosis pathways can lead to diseases as diverse as cancer [the cells keep on growing and dividing despite death ligand (DL) stimulus] or infertility (an excess of germ cells death). In the past decades, studies have highlighted the importance of key proteins [such as Caspase-8 (C8) or FLIP (F)] in the correct orchestration of this signaling pathway but the actual mechanisms of cell decision remain unclear, with no accurate prediction for when a given cell commits to apoptosis after exposure to anticancer drugs. Early mathematical models emerged to tackle this problem and aimed for a general view of the apoptosis pathways, combining multiple interactions between pro- and anti-apoptotic molecular agents. These pioneering studies were important to identify the relevance of multiple protein contributors and were able to place the death receptor (R) proteins as important molecular targets in the activation of apoptosis (Fussenegger et al 2000). Posterior models, in the form of ordinary differential equations (ODEs), offered an organized and more rigorous molecular view of the apoptosis system, separating the known network of reactions of the extrinsic apoptosis pathway (EAP) into four groups: membrane, mitochondrial, cytoplasmic and a relevant positive feedback loop (Albeck et al 2008). Each module represented a local group of reactions with dynamics that were connected to the remaining blocks with possible feedbacks and distinct controls. The authors used a data set of HeLa cells treated with TNF-related apoptosis-inducing ligand [TRAIL (T)] and cycloheximide (an inhibitor of protein translation) to study the dynamic properties of the whole network and the heterogeneity on the time of cell death (Albeck et al 2008). This model was later on re-used to evaluate the impact of gene promoter’s ON-OFF switch (noise from the gene layer) on the fluctuations of protein quantities and
Luis C. Gomes-Pereira was supported by a Thèse Inria-Inserm Médecine Numérique (doctoral fellowship).
Luis Gomes-Pereira and Madalena Chaves are with the Université Côte d’Azur, Inria, INRAE, CNRS, Sorbonne Université, Biocore team, Sophia Antipolis, France. luis.pereira@univ-cotedazur.fr; madalena.chaves@inria.fr
apoptotic signal dynamics (Bertaux et al 2014). More recently, an effective molecular determinant was proposed, with cell death propensity in individual cells correlating with the rate and timing of activation of the C8 protein. This study concluded that apoptotic cells (dead cells after treatment) had consistently higher rates of C8 activation and lower delay periods for beginning of C8 activation (Roux et al 2015). The result reinforced the importance of C8 in apoptosis commitment and strengthen the need to understand local dynamics that mediate the effective activation of C8 inside each cell. Following the results in Roux et al 2015, we developed a mass-action kinetics model that focuses on the set of reactions describing EAP at the receptor level and subsequent C8 activation: Apoptosis Receptor Reaction ODE Model (ARROM). This description differs from previous models by centering on a single module of EAP, the receptor compartment, giving it a higher level of detail and exploring new dynamics not yet contemplated in prior studies. The model was calibrated using single cell experimental data and was used to evaluate the role of the anti-apoptotic agent F and the molecular origins of cell-fate decision (CFD).
II. ARROMMODEL
A. Network reactions in extrinsic apoptosis pathway In this work we focused on the role of C8 as a critical regulator of EAP and investigated its impact in CFD. A local network describing the receptor layer reactions of EAP gathers the main chemical interactions interfering in C8 production inside the cell. The cascade of reactions starts with T, a ligand capable of activating the EAP signaling pathway. T interacts with R on the cell membrane, originating a signaling platform named DISC, which grows in complexity as it sequentially forms monomeric, dimeric or trimeric structures, after binding to one, two or three R, respectively. In every form, the assembled structure can allocate a subset of molecules, one per each attached R. Pro-caspase-8 (p), the precursor of C8, and F, a competitor of p and an inhibitor of apoptosis, can both anchor to a free R molecule These two agents attach to the DISC according to a set of stoichiometric rules limited to the availability of R sites. The rules can be written in compact form as T:nR:ip:jF, with n, j ϵ {0, 1, 2, 3}, i ϵ {0, 1, 2}, where both n, i and j represent stoichiometric quantities. The proteins p and F bind to DISC exclusively when at least one R protein is interacting with T (i ≤ n, j ≤ n), and only one molecule can attach per R site (i+j ≤ n). Activation of C8 takes place when two p proteins are introduced into the DISC platform, in the form of three possible complexes T:2R:2p, T:3R:2p or T:3R:2p:F. Once C8 is produced, it cleaves molecular targets, here Bid (B) or a fluorescent probe (L), converting them into a
Jérémie Roux is with Université Côte d’Azur, CNRS UMR 7284, Inserm U 1081, Institut de Recherche sur le Cancer et le Vieillissement de Nice, Centre Antoine Lacassagne, 06107 Nice, France. jeremie.roux@univ-cotedazur.fr
A model of apoptosis receptor reactions to study cell fate decision
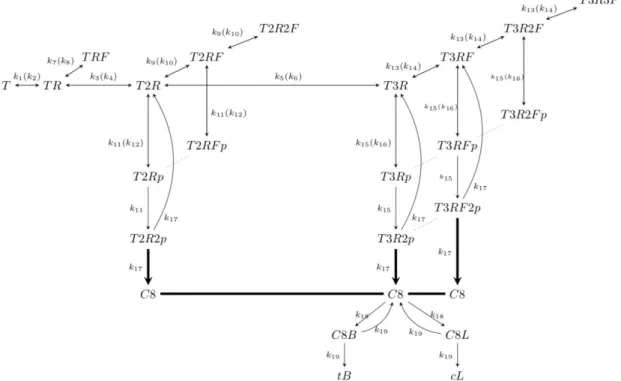
Figure 1. ARROM schematic with the main reactions describing EAP. Reaction rates of the forward and reverse reactions are indicated outside and inside brackets, respectively. T stands for TRAIL, R for death receptors, F for FLIP, p for Pro-caspase-8, C8 for Caspase-8, B for Bid, L for fluorescent probe, tB for
truncated Bid and cL for cleaved fluorescent probe protein. For instance, T3RF2p represents a complex composed of TRAIL bound to three receptors, one FLIP and two Pro-caspase-8 molecules.
truncated Bid (tB) or cleaved fluorescent probe (cL) forms. The representation of the receptor layer ends with the activation of tB and cL, which then propagate the apoptotic signal to downstream reactions not contemplated in this work. The cL protein emits a FRET signal in time that can be used to indirectly measure C8 levels inside a cell. This set of interactions is illustrated in Fig. 1.
B. Mass-action law rates
Mass-action law rates represent a realistic approach to describe the time-course dynamics of proteins in a given network of reactions and its application to every molecular species in Fig. 1 resulted in ARROM, a system of ODE’s with twenty-eight variables and thirty-two parameters. The deduced equations are available in Appendix A where each variable described the concentration of a given protein of the system and each parameter the reaction rate of the underlying chemical reaction. In a first step, ARROM was calibrated using the MATLAB command fminsearch which was used to retrieve the best vector solution minimizing the square-error distance between model output and a reference experimental curve. Among the data set, the FRET-signal of the median_cell was chosen as the reference experimental trajectory. Here, median_cell referred to the cell with the median-maximum derivative value of the whole data set. The maximum derivative is an important metric correlating to the maximum quantity of C8 protein activated inside the cell (Roux et al 2015). The median_cell corresponded then to the median-profile of C8 maximum values across the data set. FRET-signal was first converted into absolute numbers of cleaved cL protein and only then fitted to the ARROM model. Appendix B contains the full list of parameter values and protein initial
concentrations fitting the reference curve to the model equations. The landscape of all the dataset trajectories and the median_cell is displayed in Fig. 2. All model simulations were performed in MatLab 2017 environment using the solver ode15s to compute the numerical solutions of the system of ODE’s. Conversion from FRET-signal to effective number of cL molecules follows the relationship in (1), which is derived elsewhere. Simulated maximum cL derivative values were extracted directly from model equations in Appendix A, according to (2).
cL(t)=L(0) FRET(t)
1+FRET(t) (1)
maxslope=max
(
d cL(t)dt
)
(2) III. VALIDATIONOFARROMThe ARROM model, with the assigned set of parameters in Appendix B, was tested against known biological results to confirm its accuracy in the description of validated phenomena and to extract underlying properties of the chemical system. A. Irreversible binding of FLIP
F has been described as a strong anti-apoptotic protein and its overexpression blocks the formation of p chains, an essential intermediate state crucial for the activation of C8 (Hughes et al., 2016). A proportion of 2:3 in the ratio of F:p proteins was also verified to set the C8 activity levels to nearly insignificant values and reduce the death rate to less than 5% in HeLa cell populations treated with T (Roux et al., 2015). Accordingly, the simulated initial amount of F, for an average
Figure 2. FRET signal trajectories of HeLa cells treated with TRAIL at 50ng/ml. Cells were analyzed for a time span of 600 min. Dead cells after
treatment are represented in green (sensitives) and survivors in red (resistants). The median_cell used as reference to fit ARROM model is
represented in black.
HeLa cell, was augmented in the same established proportions. As explained in the introduction section, a difference in the strength of the apoptotic signal should translate into a variation of the maxslope value of the simulated cL signal. Since F is an anti-apoptotic protein, an increase in its concentration should induce a decrease in maxslope. However, model simulations for increasing levels of F initial quantity, F(0), showed no significant variation in maxslope for the set of parameters in Appendix B. The binding and unbinding rates of p and F to the DISC were initially assumed to be equal based on the structural similarities of these two proteins. In this scenario and given that the mean p and F abundances in an average HeLa cell are around 150,000 and 10,000 molecules, respectively, the pro-apoptotic signal is thus overrepresented. To equilibrate the pro- and anti-apoptotic contributions of the two proteins, a compensation effect could rely on differences in their binding/unbinding rates to the DISC or in their clustering hierarchy. We first hypothesized the unbinding rates to be different. With that, a decrease in the apoptotic signal (decrease in maxslope) for a ratio of 2:3 on F:p levels could be recovered by imposing lower F dissociation rates, pointing to an irreversible-like reaction of this protein after anchoring into the DISC. Simulations confirming these results are shown in Fig. 3, using the fitted median_cell as the control curve. For the above-mentioned ratios between F and p, a lower-threshold trend was nonetheless detected, with the increase in F(0) and/or decrease of the dissociation rates [k8, k10, k14] below one hundred-fold showing no further difference in maxslope (Fig. 3A). This result supports the role of F as a strong anti-apoptotic agent forbidding the attachment of other molecules to the DISC and also identifies a maximum limit for F inhibitory effect (independent of F concentration).
B. High-order DISC clusters are increasingly stable DL with valency up to 8 (capable of binding 8 R) have been experimentally tested, and higher ligand valency has proved to be positively correlated with an increase in the potency of the resulting death signal (Roux et al., 2015; Swers et al., 2013). In this work, T was the DL molecule used to induce an apoptotic
response in a population of treated HeLa cells. This agent forms trimeric clusters with the associating R proteins and no experimental data was available to study the dynamics of a specific DL with valency higher than three. Therefore, we used ARROM to analyze the cL signal produced by a trimeric assembled cluster and compare it against the cL signal of a dimeric assembled cluster. The trimeric cluster configuration relates to the original ARROM with all its elements (the dimeric cluster version corresponds to all reactions leading to the formation of trimeric structures set to zero). The initial assumption, provided in the beginning of this section, is that the maxslope of a cL signal derived from trimeric assembled clusters should be higher when compared to that generated from dimeric assembled clusters. Simulations were performed for both trimeric and dimeric versions of the ARROM model, including the result of section III-A with [k8, k10, k14]/100, but no differences were obtained in the maxslope of the simulated cL trajectories. Further analysis clarified that for a maxslope augmentation in the trimeric configuration, an increase in stability had to be assumed. Here, we refer to “stabi-
Figure 3. F inhibitory effect shows evidence of an irreversible-like reaction: A) Increasing the initial concentration F(0) from 9985 (fitted
median_cell value) to 2p(0)/3 molecules (~140000) causes important
variation on the maxslope of the simulated cL trajectory for decreasing F dissociation rates [k8, k10, k14]. B) Simulated cL trajectories for [k8, k10,
k14]/100 and increasing F(0) levels. The maxslope of the trajectories decreases while gradually increasing F(0).
A)
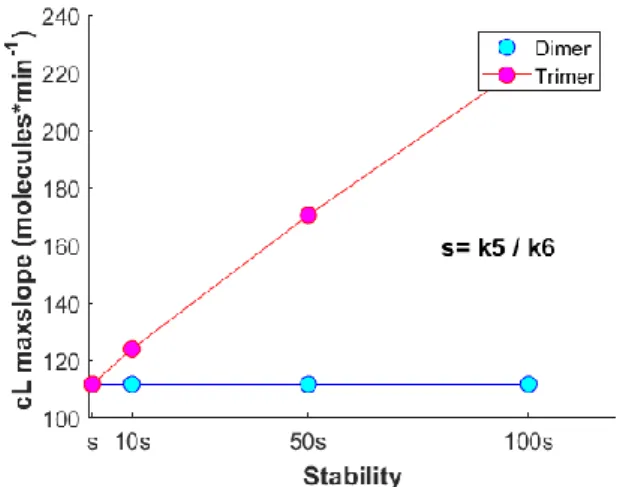
Figure 4. Increase in stability” of the trimeric complexes translate into higher cL maxslope values. The stability values in the trimeric complex are
represented by means of “s” which refers to the ratio k5 / k6. lity” as the difficulty of the trimeric complex to dissociate and change into another molecular form, measured by the ratio k5 / k6 (proportion of production rate compared to dissociation rate). By increasing the “stability” of the trimeric forms, an increase in maxslope of the cL trimeric output was observed. The relationship between “stability” increase of the trimeric structures and consequent amplification of maxslope is represented in Fig. 4. The trend is qualitative but shows a consistent and significant augmentation in the form of a linear correlation. This result lead to new biological hypotheses on the binding/unbinding scheme between R proteins. Once a dimeric complex is formed, the addition of a third R seems to give rise to a more stable structure. In this case, the dissociation of an R from this more stable structure would become less optimal, concomitant with a decrease of the correspondent dissociation rate. A general conclusion can be set relative to a higher-order ligand valency. If C8 activity is to increase for a valency of order n, then the complex of valency n is expected to be more “stable” than the complex of valency order n-1 (with a consistent higher value for the ratio production rate/dissociation rate in the order n). With this finding, a cooperative binding effect among R is proposed and a theoretical explanation is provided for the observed increase in the proportion of dead cells with a DL of higher valency. Increasing number of R interlinked at the DISC may increase the complex stability and contribute to propagate a more efficient apoptotic signal.
IV. THEEFFECTOFSTOCHASTICFLUCTUACTIONS In this section, we study the effect of intrinsic stochastic fluctuations on cell fate decision. Signals in biology are naturally noisy and even when experimental-associated errors are minimized, cells have nonetheless their own inherent stochastic fluctuations. These fluctuations are caused by inter-cellular differences in genetic and non-genetic expression levels that contribute for unique cell signatures in time and that ultimately cause important variability on a population scale (Elowitz, 2002; Newman et al., 2006; Stewart-Ornstein et al., 2012). Intrinsic noise, a stochastic factor related to the uncertainty on the reaction times, is a natural consequence of the thermodynamics of each chemical process and has been
described and analyzed in the context of protein networks. In mathematical terms, given a network of N molecular species, the stochastic time-evolution of the number of molecules of each species can be simulated by means of the Gillespie algorithm, a method which returns an exact solution of the network-associated chemical master equation (Gillespie, 1977). One of the assumptions of this method is that the molecular network is contained in a well-mixed environment, allowing molecules to come into contact and react inside a given volume Ω. The probability of a given reaction A+B→C between two species A and B, is proportional to the amount of molecules of each species, i.e., k*nA*nB. This probability can be directly recovered from an ODE model, using the volume parameter Ω to transform concentrations into numbers of molecules. In this scenario, a large Ω reflects a system with large molecular numbers inside a substantial volume and with dynamics that are closer to the deterministic model behavior. Considering that the cell signal trajectories in Fig. 2 show an important degree of heterogeneity, we tested if the addition of intrinsic noise into the median_cell could reproduce the variability of the data set and justify CFD. For that matter, ARROM was re-written into a stochastic version, with concentrations converted into number of molecules by means of the tuning parameter Ω. For multiple values of Ω three features were defined to evaluate the stochasticity of the Gillespie simulated trajectories and compare the simulated protein fluctuation numbers against that of the data set: delay, maxslope and steady_state values. These metrics characterize three important aspects of the sigmoidal-shaped trajectories and capture multiple effects of intrinsic noise addition into the system. In each feature, the relative deviation between maximum and minimum detected values was determined. The maxslope value was obtained by smoothing the original trajectory with a moving filter. As illustrated in Fig. 5, the variability introduced by intrinsic noise does not exactly match with that observed in the data set, never in the three features simultaneously. For lower Ω values, variation in both delay and maxslope largely surpassed the amplitudes detected in the data set and steady_state values are under-represented in the three simulated scenarios. Simulations for Ω > 0.05 returned a pronounced overall decrease of variability for all three features and values of Ω ≤ 0.01 produced exaggerated ranges of variations in delay and maxslope. Therefore, it appears that the dispersion obtained with the Gillespie algorithm cannot reflect the window of variability observed in the experimental data set, indicating that stochastic fluctuations on reactions times alone is insufficient to generate an adequate degree of variability on protein numbers and can’t justify, alone, the dynamics of the three represented features. As so, the dynamics of CFD, which depend mostly on variation of maxslope among different cells, should derive from other stochastic sources inside the cell. This result agrees with previous studies in the field of apoptosis, where intrinsic noise contribution was shown to be minimal in large scale signaling networks, where protein quantities are commonly high (Iwamoto et al., 2016; Labavić et al., 2019). Heterogeneity on cell-to-cell response is thus the result of more complex phenomena possibly controlled, at least partially, by the cell machinery and not by an entirely random factor as the fluctuation on reaction times.
Figure 5. Relative deviation of the data set and that of Gillespie simulations, quantified in terms of delay, maxslope and steady_state obtained values. Deviation with the Gillespie algorithm was studied for three
Ω values, relating system volume with the generated degree of variability. V. CONCLUSION
In this paper, a model of extrinsic apoptosis reactions at the death receptor layer (ARROM) was proposed to analyze the role of major pro- and anti-apoptotic proteins, such as Caspase-8 and FLIP, in cell fate decision (decision between cellular life or death). Numerical analysis suggests that the anti-apoptotic role of FLIP is irreversible but limited in blocking the death signal. In contrast, death signaling seems to increase when the receptor stability is enhanced in ligands of higher valency. Finally, a stochastic version of ARROM was also implemented to evaluate the role of biochemical fluctuations in cell fate decision. ARROM predicts that intrinsic noise does not play a relevant role in generating the observed cellular signal variability, in agreement with results obtained for heat stress or epidermal signaling pathways.
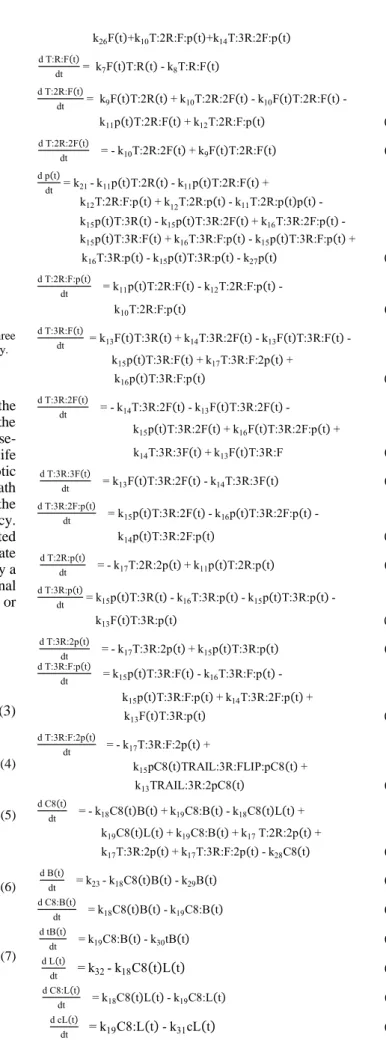
APPENDIX A. ARROM EQUATIONS d T(t) dt = - k1T(t)R(t) + k2T:R(t) - k24T(t) (3) d R(t) dt = k20 + k1T(t)R(t) - k4T:2R(t) - k5R(t)T:2R(t) + k6T:3R(t) + k2T:R(t) - k3R(t)T:R(t) - k25R(t) (4) d T:R(t) dt = k1T(t)R(t) + k4T:2R(t) - k2T:R(t) - k3T:R(t)R(t) - k7T:R(t)F(t) + k8T:R:F(t) (5) d T:2R(t) dt = - k4T:2R(t) - k5T:2R(t)R(t) - k9F(t)T:2R(t) - k11p(t)T:2R(t) + k17T:2R:2p(t) + k10T:2R:F(t) + k12T:2R:p(t) + k6T:3R(t) + k3R(t)T:R(t) (6) d T:3R(t) dt = - k5R(t)T:2R(t) - k6T:3R(t) - k13F(t)T:3R(t) - k15p(t)T:3R(t) - k17T:3R:2p(t) + k14T:3R:F(t) - k16T:3R:p(t) (7) d F(t) dt = k22 - k9F(t)T:2R(t) + k10T:2R:2F(t) + k10T:2R:F(t) - k9F(t)T:2R:F(t) - k13F(t)T:3R(t) + k14T:3R:2F(t) -k13F(t)T:3R:2F(t) + k14T:3R:3F(t) + k14T:3R:F - k13F(t)T:3R:F(t) - k7F(t)T:R(t) + k8T:R:F(t) - k26F(t)+k10T:2R:F:p(t)+k14T:3R:2F:p(t) (8) d T:R:F(t) dt = k7F(t)T:R(t) - k8T:R:F(t) (9) d T:2R:F(t) dt = k9F(t)T:2R(t) + k10T:2R:2F(t) - k10F(t)T:2R:F(t) - k11p(t)T:2R:F(t) + k12T:2R:F:p(t) (10) d T:2R:2F(t) dt = - k10T:2R:2F(t) + k9F(t)T:2R:F(t) (11) d p(t) dt = k21 - k11p(t)T:2R(t) - k11p(t)T:2R:F(t) + k12T:2R:F:p(t) + k12T:2R:p(t) - k11T:2R:p(t)p(t) - k15p(t)T:3R(t) - k15p(t)T:3R:2F(t) + k16T:3R:2F:p(t) - k15p(t)T:3R:F(t) + k16T:3R:F:p(t) - k15p(t)T:3R:F:p(t) + k16T:3R:p(t) - k15p(t)T:3R:p(t) - k27p(t) (12) d T:2R:F:p(t) dt = k11p(t)T:2R:F(t) - k12T:2R:F:p(t) - k10T:2R:F:p(t) (13) d T:3R:F(t) dt = k13F(t)T:3R(t) + k14T:3R:2F(t) - k13F(t)T:3R:F(t) - k15p(t)T:3R:F(t) + k17T:3R:F:2p(t) + k16p(t)T:3R:F:p(t) (14) d T:3R:2F(t) dt = - k14T:3R:2F(t) - k13F(t)T:3R:2F(t) - k15p(t)T:3R:2F(t) + k16F(t)T:3R:2F:p(t) + k14T:3R:3F(t) + k13F(t)T:3R:F (15) d T:3R:3F(t) dt = k13F(t)T:3R:2F(t) - k14T:3R:3F(t) (16) d T:3R:2F:p(t) dt = k15p(t)T:3R:2F(t) - k16p(t)T:3R:2F:p(t) - k14p(t)T:3R:2F:p(t) (17) d T:2R:p(t) dt = - k17T:2R:2p(t) + k11p(t)T:2R:p(t) (18) d T:3R:p(t) dt = k15p(t)T:3R(t) - k16T:3R:p(t) - k15p(t)T:3R:p(t) - k13F(t)T:3R:p(t) (19) d T:3R:2p(t) dt = - k17T:3R:2p(t) + k15p(t)T:3R:p(t) (20) d T:3R:F:p(t) dt = k15p(t)T:3R:F(t) - k16T:3R:F:p(t) - k15p(t)T:3R:F:p(t) + k14T:3R:2F:p(t) + k13F(t)T:3R:p(t) (21) d T:3R:F:2p(t) dt = - k17T:3R:F:2p(t) + k15pC8(t)TRAIL:3R:FLIP:pC8(t) + k13TRAIL:3R:2pC8(t) (22) d C8(t) dt = - k18C8(t)B(t) + k19C8:B(t) - k18C8(t)L(t) + k19C8(t)L(t) + k19C8:B(t) + k17 T:2R:2p(t) + k17T:3R:2p(t) + k17T:3R:F:2p(t) - k28C8(t) (23) d B(t) dt = k23 - k18C8(t)B(t) - k29B(t) (24) d C8:B(t) dt = k18C8(t)B(t) - k19C8:B(t) (25) d tB(t) dt = k19C8:B(t) - k30tB(t) (26) d L(t) dt = k32 - k18C8(t)L(t) (27) d C8:L(t) dt = k18C8(t)L(t) - k19C8:L(t) (28) d cL(t) dt = k19C8:L(t) - k31cL(t) (29)
B. ARROM FIT TO MEDIAN_CELL
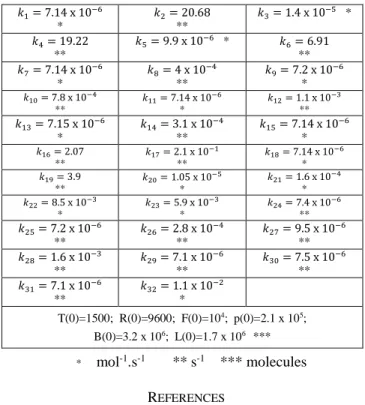
TABLE I. REACTION RATE VALUES AND NON-ZERO PROTEIN INITIAL CONDITIONS 𝑘1= 7.14 x 10⁻⁶ * 𝑘2= 20.68 ** 𝑘3= 1.4 x 10⁻⁵ * 𝑘4= 19.22 ** 𝑘5= 9.9 x 10⁻⁶ * 𝑘6= 6.91 ** 𝑘7= 7.14 x 10⁻⁶ * 𝑘8= 4 x 10⁻⁴ ** 𝑘9= 7.2 x 10⁻⁶ * 𝑘10= 7.8 x 10⁻⁴ ** 𝑘11= 7.14 x 10⁻⁶ * 𝑘12= 1.1 x 10⁻³ ** 𝑘13= 7.15 x 10⁻⁶ * 𝑘14= 3.1 x 10⁻⁴ ** 𝑘15= 7.14 x 10⁻⁶ * 𝑘16= 2.07 ** 𝑘17= 2.1 x 10⁻¹ ** 𝑘18= 7.14 x 10⁻⁶ * 𝑘19= 3.9 ** 𝑘20= 1.05 x 10⁻⁵ * 𝑘21= 1.6 x 10⁻⁴ * 𝑘22= 8.5 x 10⁻³ * 𝑘23= 5.9 x 10⁻³ * 𝑘24= 7.4 x 10⁻⁶ ** 𝑘25= 7.2 x 10⁻⁶ ** 𝑘26= 2.8 x 10⁻⁴ ** 𝑘27= 9.5 x 10⁻⁶ ** 𝑘28= 1.6 x 10⁻³ ** 𝑘29= 7.1 x 10⁻⁶ ** 𝑘30= 7.5 x 10⁻⁶ ** 𝑘31= 7.1 x 10⁻⁶ ** 𝑘32= 1.1 x 10⁻² * T(0)=1500; R(0)=9600; F(0)=104; p(0)=2.1 x 10⁵; B(0)=3.2 x 10⁶; L(0)=1.7 x 10⁶ *** * mol-1.s-1 ** s-1 *** molecules REFERENCES
[1] Albeck, J.G., Burke, J.M., Spencer, S.L., Lauffenburger, D.A., Sorger, P.K., (2008). Modeling a Snap-Action, Variable-Delay Switch Controlling Extrinsic Cell Death, PLoS Biol., 6, e299
[2] Bertaux, F., Stoma, S., Drasdo, D., Batt, G., (2014). Modeling Dynamics of Cell-to-Cell Variability in TRAIL-Induced Apoptosis Explains Fractional Killing and Predicts Reversible Resistance. PLoS Comput.
Biol., 10, e1003893
[3] Elowitz, M.B., (2002). Stochastic Gene Expression in a Single Cell.
Science, 297, 1183–1186.
[4] Fussenegger, M., Bailey, J.E., Varner, J., (2000). A mathematical model of caspase function in apoptosis. Nat. Biotechnol. 18, 768–774. [5] Gillespie, D.T., (1977). Exact stochastic simulation of coupled chemical
reactions. J. Phys. Chem., 81, 2340–2361.
[6] Hughes, M.A., Powley, I.R., Jukes-Jones, R., Horn, S., Feoktistova, M., Fairall, L., Schwabe, J.W.R., Leverkus, M., Cain, K., MacFarlane, M., (2016). Co-operative and Hierarchical Binding of c-FLIP and Caspase-8: A Unified Model Defines How c-FLIP Isoforms Differentially Control Cell Fate. Mol. Cell., 61, 834–849
[7] Iwamoto, K., Shindo, Y., Takahashi, K., (2016). Modeling Cellular Noise Underlying Heterogeneous Cell Responses in the Epidermal Growth Factor Signaling Pathway. PLOS Comput. Biol., 12, e1005222. [8] Labavić, D., Ladjimi, M.T., Thommen, Q., Pfeuty, B., (2019). Scaling laws of cell-fate responses to transient stress. J. Theor. Biol., 478, 14– 25.
[9] Newman, J.R.S., Ghaemmaghami, S., Ihmels, J., Breslow, D.K., Noble, M., DeRisi, J.L., Weissman, J.S., (2006). Single-cell proteomic analysis of S. cerevisiae reveals the architecture of biological noise. Nature., 441, 840–846.
[10] Roux, J., Hafner, M., Bandara, S., Sims, J.J., Hudson, H., Chai, D., Sorger, P.K., (2015). Fractional killing arises from cell‐to‐cell variability in overcoming a caspase activity threshold. Mol. Syst. Biol., 11, 803
[11] Schleich, K., Buchbinder, J.H., Pietkiewicz, S., Kähne, T., Warnken, U., Öztürk, S., Schnölzer, M., Naumann, M., Krammer, P.H., Lavrik, I.N., (2016). Molecular architecture of the DED chains at the DISC: regulation of procaspase-8 activation by short DED proteins c-FLIP and procaspase-8 prodomain. Cell Death Differ., 23, 681–694
[12] Spencer, S.L., Gaudet, S., Albeck, J.G., Burke, J.M., Sorger, P.K., (2009). Non-genetic origins of cell-to-cell variability in TRAIL-induced apoptosis. Nature. , 459, 428–432.
[13] Stewart-Ornstein, J., Weissman, J.S., El-Samad, H., (2012). Cellular Noise Regulons Underlie Fluctuations in Saccharomyces cerevisiae.
Mol. Cell. , 45, 483–493.
[14] Swers, J.S., Grinberg, L., Wang, L., Feng, H., Lekstrom, K., Carrasco, R., Xiao, Z., Inigo, I., Leow, C.C., Wu, H., Tice, D.A., Baca, M., (2013). Multivalent Scaffold Proteins as Superagonists of TRAIL Receptor 2-Induced Apoptosis. Mol. Cancer Ther. 12, 1235–1244.