Plant Molecular Biology (2005) 58:247-267 © Springer 2005 DOI 10.1007/sl 1103-005-3099-9
Analysis of epidermis- and mesophyll-specific transcript accumulation
in powdery mildew-inoculated wheat leaves
R S m y B r u g g m a n n 1, O l a f A b d e r h a l d e n 1, P h i l i p p e R e y m o n d 2 a n d R o b e r t D u d l e r I'*
1Institute o f Plant Biology, University of Zurich, Zollikerstrasse 107, CH-8000, Zu'rich, Switzerland (*author for correspondence; e-mail [email protected]) ; 2Department o f Plant Molecular Biology, University o f
Lausanne, Biology Building, CH-IO15, Lausanne, Switzerland
Received 12 January 2005; accepted in revised form 3 March 2005
Key words: acquired resistance, cDNA-AFLP, microarray, powdery mildew, tissue-specific gene expression,
wheat
Abstract
Powdery mildew is an important disease of wheat caused by the obligate biotrophic fungus Blumeria graminis f. sp. tritici. This pathogen invades exclusively epidermal cells after penetrating directly through
the cell wall. Because powdery mildew colonizes exclusively epidermal cells, it is of importance not only to identify genes which are activated, but also to monitor tissue specificity of gene activation. Acquired resistance of wheat to powdery mildew can be induced by a previous inoculation with the non-host pathogen B. graminis f. sp. hordei, the causal agent of barley powdery mildew. The establishment of the
resistant state is accompanied by the activation of genes. Here we report the tissue-specific c D N A - A F L P analysis and cloning of transcripts accumulating 6 and 24 h after the resistance-inducing inoculation with
B. graminis f. sp. hordei. A total of 25 000 fragments estimated to represent about 17 000 transcripts were
displayed. Out of these, 141 transcripts, were found to accumulate after Bgh inoculation using microarray
hybridization analysis. Forty-four accumulated predominantly in the epidermis whereas 76 transcripts accumulated mostly in mesophyll tissue.
Introduction
Powdery mildew is an important disease of wheat
(Triticum aestivum L.). It is caused by the obligate
biotrophic fungus Blumeria graminis f. sp. tritici (Bgt) which colonizes exclusively epidermal cells of
the host by penetrating directly through the cell wall and forming haustoria inside by invagination of the plasmalemma. Resistance to powdery mildew dis- ease can be conferred by race-specific resistance genes, and the first one in wheat has recently been cloned (Yahiaoui et al., 2004). Although such genes
have been widely used in breeding programs, they are usually not durable because new virulent pathogen races emerge quickly. A more durable form of resistance observed in many plants is acquired resistance, which is a form of physiological
resistance effective against a broad spectrum of pathogens. It is induced by a trigger event such as an attack by an incompatible pathogen. In many plant species, a local triggering event leads to the induc- tion of resistance of the whole plant (systemic acquired resistance, SAR; Ryals et al., 1996; Sticher et al., 1997; Durrant and Dong, 2004). In wheat,
local acquired resistance against powdery mildew can be triggered by inoculation with spores of
B. graminis f. sp. hordei (Bgh), the powdery mildew
of barley for which wheat is not a host.
Acquired resistance is accompanied by the activation of genes, including the well-known pathogenesis-related (PR) genes (Hunt and Ryals, 1996; Maleck et al., 2000). It is thought and has
been experimentally demonstrated in a number of host-pathogen systems that the products of
248
activated genes can be causally related to the physiologically resistant state (e.g. Broglie et al., 1991; Alexander et al., 1993; Liu et al., 1994; Jach et al., 1995; Grison et al., 1996). In wheat, some of these defense-related genes were demonstrated to reduce the penetration efficiency of Bgt when transiently overexpressed in wheat epidermal cells (Schweizer et al., 1999a,b), and one was recently constitutively and specifically expressed in the epidermis of transgenic wheat plants, resulting in elevated resistance against powdery mildew (Alt- peter et al., in press). Thus, the knowledge of genes activated, particularly in the epidermis, upon induction of acquired resistance is important and may lead to a better understanding of the molec- ular resistance mechanism and the biotechnolog- ical development of increased and durable resistance against powdery mildew in wheat.
The aim of the study presented here was to identify host genes induced in the epidermis of Bgh- treated wheat leaves because the corresponding gene products may be directly responsible for resistance induction. Therefore, an RNA finger- printing method, c D N A - A F L P (amplified frag- ment length polymorphism; Vos et al., 1995; Bachem et al., 1996), was applied using epidermis preparation as the starting material for the identi- fication of transcripts accumulating in the epidermis upon Bgh inoculation, c D N A - A F L P displayed a total of 363 differentially expressed cDNA frag- ments 6-9 and 23 26 h post-inoculation (hpi). To analyse the expression of the corresponding genes in more detail, the fragments were subcloned and arrayed on glass slides. Microarrays were hybri- dised to cDNA probes derived from epidermal and mesophyll preparations as well as from whole leaves o f Bgh-inoculated and un-inoculated control plants. The experiments identified 44 genes predominantly activated in the epidermis, many of which were novel or not known to be activated by pathogen inoculation, as well as 80 genes whose transcripts accumulated predominantly in mesophyll tissue.
Results
c D N A - A F L P analysis and cloning o f transcripts f r o m Bgh-inoculated epidermis preparations
Seven-day-old wheat seedlings (Triticum aestivum cv. Fidel) were inoculated with Blumeria graminis f.
sp. hordei (Bgh) at a density of approximately 200 conidia/mm 2. The abaxial epidermis of primary leaves of Bgh-inoculated and uninoculated control plants was harvested 6-9 and 23-26 h post-inocu- lation (hpi), respectively. Since the isolation of epidermal tissue was time-consuming, material was collected during 3 h. For simplicity, the time range 6-9 and 23-26 hpi are referred to as 6 and 24 hpi, respectively. The first collection period coincides approximately with appressorium formation, the second one with haustorium establishment. RNA was extracted from the collected plant material and used for c D N A - A F L P analysis according to (Vos et al., 1995; Bachem et al., 1996). The cDNA frag- ments were amplified using all possible 256 selective primer combinations. The size of the A F L P frag- ments ranged from 50 to 700 bp; for each primer combination, 80-120 bands were observed. The majority of the bands showed no change in the intensity between different lanes. In total, ~25 000 fragments were displayed, representing ~ 17 000 m R N A as estimated on the basis of the analysis of 80 random wheat cDNA sequences from nucleotide sequence databases which showed an average of one to two fragments generated with the enzyme com- bination employed (NcoI/Sau3AI; see Methods). Altered expression patterns were observed for 363 fragments. Of these, 354 (97.5%) were induced by Bgh and only 9 (2.5%) were repressed by Bgh.
The 363 differentially expressed fragments were excised from the gel, reamplified by PCR with the non-selective primers and purified. For confirma- tion of the c D N A - A F L P screening results, probes of the reamplified fragments were generated and hybridised to gel blots containing RNA from Bgh- treated and untreated whole leaves 6 and 24 hpi.
In these experiments, 92 cDNA-AFLP
bands (approximately 25%) resulted in pathogen- induced hybridization signals. These positive frag- ments were subcloned and 1-8 subclones per fragment were sequenced. The subclones of indi- vidual c D N A - A F L P fragments represented in most cases more than one sequence, indicating that a band contained mixed P C R products (Durrant et al., 2000; Zhang et al., 2003).
The sequences of all subclones were compared with each other and assembled into contiguous sequence fragments (contigs) if they exhibited an overlap of > 20 bp with > 85% sequence identity. Surprisingly, some contigs comprised sequences of subclones from c D N A - A F L P fragments derived
from up to 12 different selective primer combina-
tions (data not shown). However, overlap
sequence identity among clones of a contig was not always complete, indicating that such contigs likely represented more than one closely related gene. Nevertheless, cDNA-AFLP clones repre- sented by a contig were not evaluated individually but treated as one contig in further analyses.
Expression analysis of genes corresponding
to cDNA-AFLP clones by microarray hybridization
Because the analysis described above showed that many excised c D N A - A F L P bands contained more than one sequence, a cDNA microarray containing 1-8 subclones of all 363 cDNA-AFLP bands was produced using previously described methods (Eisen and Brown, 1999; Reymond et al., 2000) in order to analyse the expression of the corresponding genes (see Materials and methods). The total number of subcloned cDNA-AFLP fragments spot- ted on the microarray was 1088. In addition, the microarray contained 160 cDNA fragments ob- tained from a suppression subtractive hybridization (SSH; Diatchenko et aL, 1996) screen for genes activated in powdery mildew attacked leaves after syringolin A treatment, which induces hypersensitive cell death of colonized cells (W~ispi et al., 1998; W~spi et al., 2001). Furthermore, the microarrays contained control genes and 23 artificial genes (supplementary material, table). The positive control genes com- prised 10 genes previously known to be powdery mildew-inducible, two syringolin A-inducible genes, and three BTH (benzo [1,2,3] thiadiazole-7-carbo- thioic acid S-methyl ester)-inducible genes (Grrlach et al., t996). Thirty potential housekeeping wheat and barley genes as well as two human genes were included for normalization.
cDNA microarray hybridizations were carried out with probes derived from RNA of whole leaves of Bgh-inoculated wheat 6 and 24 hpi and of corresponding uninoculated control plants, respectively. In addition, hybridization probes were prepared from the abaxial epidermis which was stripped from inoculated and control leaves, respectively, 24 hpi. These preparations were con- taminated to a certain degree by adhering meso- phyll cells. For simplicity, we refer to the remainder of the stripped leaves as mesophyll preparations in the following, although the adaxial epidermis was still present.
249
RNA from whole leaves was subjected to the indirect labelling procedure. Due to low yields of R N A from epidermal preparations, m R N A was amplified prior to the indirect labelling (Poirier and Erlander, 1998; Pfibon et al., 2001). For consistency, both epidermis and mesophyll R N A was amplified, although sufficient total RNA from mesophyll preparations for the indirect labelling procedure was available. Hybridization signals were normalized using the control genes (see Materials and methods).
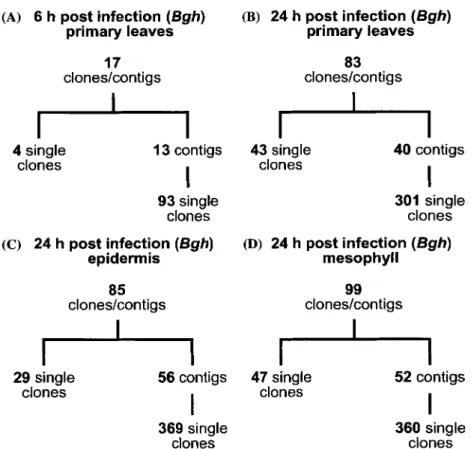
Four and six biologically independent experi- ments with probes of RNA derived from Bgh-treated whole leaves were performed for the 6- and the 24-h timepoint, respectively. Experi- ments with probes from epidermis and mesophyll samples at the 24-hpi timepoint were performed in three biologically independent repetitions. Genes were considered significantly induced if the aver- age hybridization signal ratio (treatment/control) was >2 with an error probability P < 0.05 (Stu- dent's t test; see Methods). This average was taken over all individual clones represented in a contig. An overview of the number of clones/contigs that showed signal ratios of >2 in these hybridization experiments is presented in Figure 1. In order to assess epidermis specificity of gene expression, the mesophyll contamination in epidermis prepa- rations was estimated by using the ribulose- 1,5-bisphosphate carboxylase (rubisco) gene, which is exclusively expressed in cells possessing chloroplasts, as a mesophyll marker. The ratio Qm of the mesophyll signal Xm of a gene X and the mesophyll signal Rm of the rubisco gene was calculated and compared to the ratio Qe of the corresponding epidermis signal Xe and the epider- mis (contamination) signal R e of rubisco tran- scripts. An epidermis specificity factor ES = Oe/ Qm was calculated which describes the allocation of the signal to the epidermis and the mesophyll. An ES value clearly greater than one (Qe > Qm) indicates that gene X was (at least also) activated in the epidermis. Thus, ES values >2 were taken as evidence that the corresponding transcripts accu- mulated (also) in the epidermis.
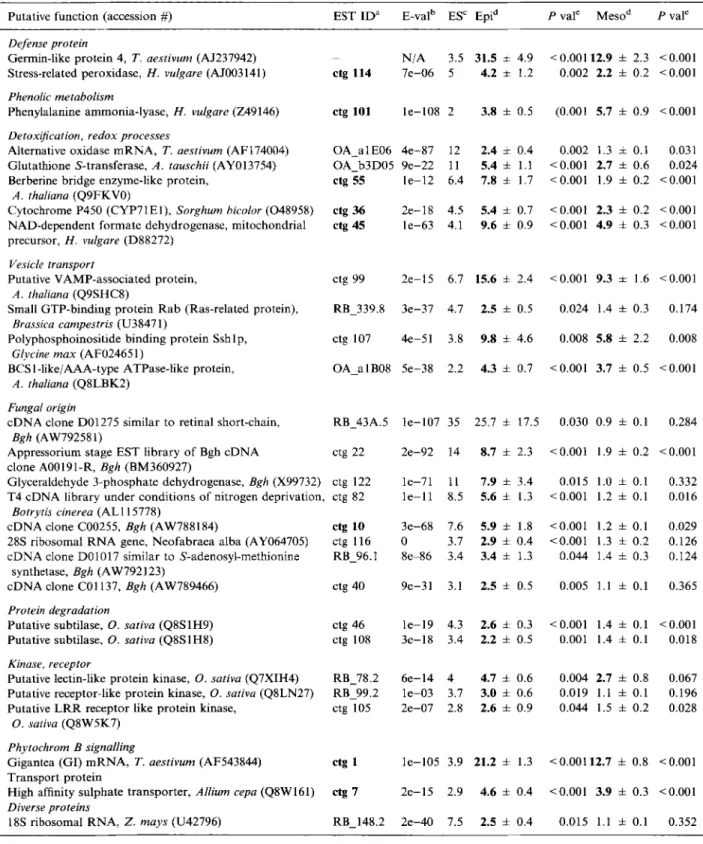
Table 1 lists the 44 clones/contigs resulting in signal ratios (inoculated/control) >2 (P < 0.05) and ES values >2, i.e. corresponding to genes whose transcripts accumulated in the epidermis 24 h after Bgh inoculation. The sequences of eight of these clones/contigs were most similar to fungal
250
(A) 6 h post infection
(Bgh)
primary leaves (B) 24 h post infection
(Bgh)
primary leaves17
clones/contigs
I
I
I
4 single
13 contigs
clones
[93 single
clones
(C) 24 h post infection(Bgh)
epidermis 83clones/contigs
I
I
I
43 single
40 contigs
clones
I
301 single
clones
(D) 24 h post infection(Bgh)
mesophyll 85clones/contigs
I
I
I
I
29 single
56 contigs
47 single
clones
I c l o n e s369 single
clones
99
clones/contigs
I
I
52 contigsI
360 singleclones
Figure 1. Overview over clones/contigs corresponding to genes induced more than twofold. The number of cDNA-AFLP and SSH clones and contigs, respectively is given corresponding to transcripts that accumulated statistically significantly at least twofold after Bhg inoculation as revealed by microarray hybridization experiments. The hybridization probes were derived from whole leaves at 6 hpi (A) and 24 hpi (B), respectively, or from epidermis (C) and mesophyll (D) preparations at 24 hpi.
sequences a n d therefore likely are derived f r o m Bgh. All o f these have a transcript signal ratio <2 in hybridization experiments with mesophyll-derived probes. A p p a r e n t l y , the adaxial epidermis, which was also inoculated with Bgh was too m i n o r a c o m p o n e n t in the mesophyll samples for the fungal transcripts to be reliably detected. The two clones/ contigs with n o significant sequence similarity (Table 1, category, ' u n k n o w n ' ) and with signal ratios and ES values similar to the fungal clones m a y therefore also be o f fungal origin. All other clones/contigs either exhibit greatest sequence sim- ilarity to plant genes a n d / o r are also expressed in the mesophyll and therefore likely represent wheat genes (Table 1). T a b l e 2 lists the 72 clones/contigs with signal ratios >2 ( P < 0.05) and ES values <2, i.e. genes whose transcripts likely accumulate pre- d o m i n a n t l y or exclusively in the mesophyll.
In the h y b r i d i z a t i o n experiments with probes derived f r o m whole leaves 6 and 24 hpi, 76 clones/contigs gave signal ratios >2 ( P < 0.05).
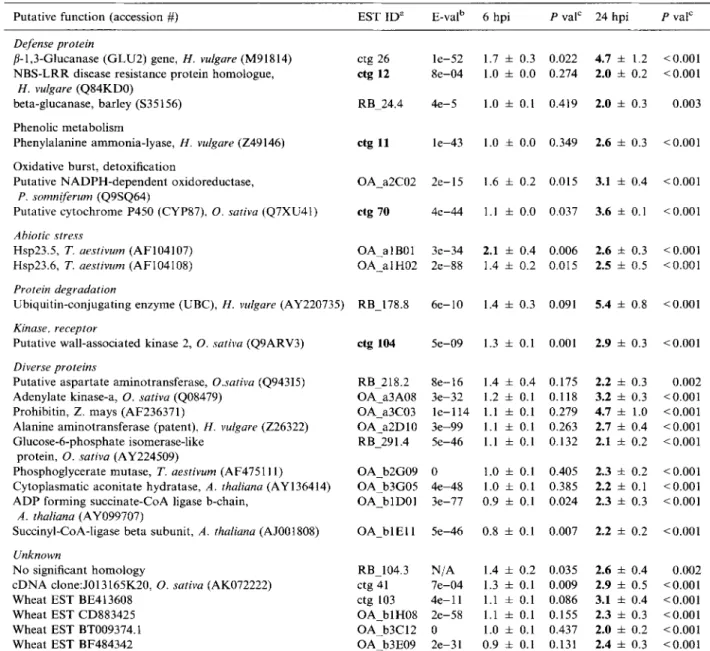
O f these, 51 are also listed in Table 1 or Table 2, i.e. were also detected with amplified probes derived from epidermis or mesophyll preparations. The remaining 25 clones/contigs, which are listed in Table 3, were detected only with probes obtained from whole leaves. T h e complete data for the 76 clones/contigs are available online as supplemen- tary material (Table $2). A list with the accession numbers o f all clones giving hybridization signal ratios >2 as well as their association with contigs is presented in Table $3 (supplementary material). In addition, this table contains also the gene bank accession n u m b e r s o f w h e a t ESTs exhibiting >95% sequence identity in the overlap region and their Affymetrix gene chip accession numbers if they are included on the chip.
Verification of microarray data
The names o f clones/contigs printed in boldface in Tables 1-3 originated f r o m c D N A - A F L P bands
Table 1. M i c r o a r r a y d a t a for genes induced by Bgh p r e d o m i n a n t l y in the epidermis (ES > 2).
Putative f u n c t i o n (accession #) EST I D a E-val b ES ~ Epi a P valc M e s o d P val e
Defense protein
Germ±n-like protein 4, T. aestivum (AJ237942)
Stress-related peroxidase, H. vulgare (AJ003141) ctg 114 Phenolic metabolism
Phenylalanine a m m o n i a - l y a s e , H. vulgare (Z49146) Detoxification, redox processes
Alternative oxidase m R N A , T. aestivum (AF174004) G l u t a t h i o n e S-transferase, A. tauschii (AY013754) Berberine bridge enzyme-like protein,
A. thaliana ( Q 9 F K V 0 )
C y t o c h r o m e P450 (CYP71E1), Sorghum bicolor (048958) ctg 36 N A D - d e p e n d e n t f o r m a t e d e h y d r o g e n a s e , m i t o c h o n d r i a l etg 45 precursor, H. vulgate (D88272)
Vesicle transport
Putative V A M P - a s s o c i a t e d protein, ctg 99 A. thai±aria (Q9SHC8)
Small G T P - b i n d i n g p r o t e i n R a b (Ras-related protein), RB_339.8 Brass±ca campestris (U38471)
P o l y p h o s p h o i n o s i t i d e b i n d i n g p r o t e i n S s h l p , ctg 107 Glycine max (A F024651)
BCS 1-1ike/AAA-type A T P a s e - l i k e protein, O A _ a 1B08 A. thaliana ( Q 8 L B K 2 )
Fungal origin
e D N A clone D01275 similar to retinal short-chain, RB_43A.5 Bgh (AW792581)
A p p r e s s o r i u m stage EST library o f Bgh c D N A ctg 22 clone A00191-R, Bgh (BM360927)
Glyceraldehyde 3 - p h o s p h a t e d e h y d r o g e n a s e , Bgh (X99732) ctg 122 T4 c D N A library u n d e r c o n d i t i o n s o f nitrogen deprivation, ctg 82
Botrytis cinerea ( A L 1 15778)
e D N A clone C00255, Bgh (AW788184) ctg 10 28S ribosomal R N A gene, N e o f a b r a e a alba (AY064705) ctg 116 e D N A clone DO 1017 similar to S - a d e n o s y t - m e t h i o n i n e RB_96.1
synthetase, Bgh (AW792123)
e D N A clone C01137, Bgh (AW789466) ctg 40 Protein degradation
Putative subtilase, O. sativa (Q8S1H9) ctg 46 Putative subtilase, O. sativa (Q8S1HS) ctg 108 Kinase, receptor
Putative lectin-like protein kinase, O. sativa (Q7XIH4) RB_78.2 Putative receptor-like p r o t e i n kinase, O. sativa (Q8LN27) RB_99.2 Putative L R R receptor like p r o t e i n kinase, ctg 105
O. sativa ( Q 8 W 5 K 7 ) Phytochrom B signalling
Gigantea (GI) m R N A , T. aestivum (AF543844) etg 1 T r a n s p o r t protein
H i g h affinity s u l p h a t e t r a n s p o r t e r , All±urn cepa (Q8W161) etg 7 Diverse proteins
18S ribosomal R N A , Z. mays (U42796) RB_148.2
N / A 3.5 31.5 ± 4.9 7 e - 0 6 5 4.2 :t: 1.2 etg 101 l e - 1 0 8 2 3.8 ± 0.5 O A _ a 1E06 4 e - 8 7 O A b 3 D 0 5 9 e - 2 2 etg 55 l e - 1 2 < 0 . 0 0 1 1 2 . 9 ± 2.3 <0.001 0.002 2.2 ± 0.2 <0.001 (0.00l 5.7 ± 0.9 <0.001 12 2.4 ± 0.4 0.002 1.3 ± 0.1 0.031 11 5.4 ± 1.1 <0.001 2.7 ± 0.6 0.024 6.4 7.8 ± 1.7 <0.001 1.9 ± 0.2 <0.001 2 e - 1 8 4.5 5.4 ± 0.7 l e - 6 3 4.1 9.6 ± 0.9 <0.001 2.3 ± 0.2 <0.001 <0.001 4.9 ± 0.3 <0.001 2 e - 1 5 6.7 15.6 ± 2.4 <0.001 9.3 ± 1.6 <0.001 3 e - 3 7 4.7 2.5 ± 0.5 0.024 1.4 ± 0.3 0.174 4 e - 5 1 3.8 9.8 ± 4.6 0.008 5.8 ± 2.2 0.008 5 e - 3 8 2.2 4.3 ± 0.7 <0.001 3.7 ± 0.5 <0.001 l e - 1 0 7 35 25.7 ± 17.5 0.030 0.9 ± 0.1 0.284 2 e - 9 2 14 8.7 ± 2.3 <0.001 1.9 ± 0.2 <0.001 6 e - 1 4 4 4.7 ± 0.6 0.004 2.7 ± 0.8 0.067 l e - 0 3 3.7 3.0 ± 0.6 0.019 1.1 ± 0.1 0.196 2 e - 0 7 2.8 2.6 ± 0.9 0.044 1.5 ± 0.2 0.028 l e - 1 0 5 3.9 21.2 ± 1.3 < 0 . 0 0 1 1 2 . 7 ± 0.8 <0.001 2 e - 1 5 2.9 4.6 i 0.4 <0.001 3.9 ± 0.3 <0.001 2 e - 4 0 7.5 2.5 ± 0.4 0.015 1.1 ± 0.1 0.352 l e - 1 9 4.3 2.6 ± 0.3 <0.001 1.4 ± 0.1 <0.001 3 e - 1 8 3.4 2.2 ± 0.5 0.001 1.4 ± 0.1 0.018 9 e - 3 1 3.1 2.5 ± 0.5 0.005 1.1 ± 0.1 0.365 3 e - 6 8 7.6 5.9 ± 1.8 <0.001 1.2 + 0.1 0.029 0 3.7 2.9 ± 0.4 <0.001 1.3 i 0.2 0.126 8 e - 8 6 3.4 3.4 ± 1.3 0.044 1.4 ± 0.3 0 . i 2 4 l e - 7 1 11 7.9 ± 3.4 0.015 1.0 ± 0.1 0.332 l e - l l 8.5 5.6 ± 1.3 <0.001 1.2 + 0.1 0.016
252
Table 1. C o n t i n u e d .
P u t a t i v e f u n c t i o n (accession #) EST ID a E-val b ES c Epi d P val e M e s o a P val e
Unknown
c D N A clone w l m k l . p k 0 0 1 9 . g 2 , T. aestivum (CA662411) RB_74.2 c D N A clone:J023102L09, O. sativa (AK100543) ctg 9 W h e a t E S T BQ162027 a3A04 EST, clone 11815R, Triticum turgidum (AJ615560) RB_96.2 W h e a t E S T CA668159 RB 78.3 C h r o m o s o m e 10, section 37 o f 77, O. sativa (AE017083) ctg 59 N o significant h o m o l o g y RB_12.1 W h e a t E S T CA669769 W h e a t E S T CD883151 W h e a t E S T CA705231 W h e a t E S T CA686488 B A C clone: O S J N B a 0 0 0 7 H 1 2 , g e n o m i c D N A , O. sativa (AP004990) N o significant h o m o l o g y W h e a t E S T C D 9 3 3 9 0 N o significant h o m o l o g y N o significant h o m o l o g y ctg 37 RB 255.8 RB 153,2 ctg 13 ctg 16 4 e - l l 8 6.7 4- 1.4 0.007 4.3 4- 1.4 0.022 8 e - 1 7 6.7 3.7 4- 0.6 <0.001 1.2 4- 0.1 0.004 2 e - 8 6 5.7 28.5 4- 5.9 <0.001 7.4 4- 1.3 <0.001 2 e - 1 5 3.7 6.0 + 0.9 0.004 4.2 4- 0.9 0.011 3 e - 3 4 3,7 4.2 4- 1.2 0.032 1.9 4- 0.5 0.125 l e - 0 4 3.7 3.0 ± 0.4 <0.001 1.7 + 0.1 <0.001 N / A 3,6 3.0 4- 0.6 0.022 2.0 4- 0.2 0.015 l e - 1 0 2 2.8 5.8 4- 0.8 <0.001 2.7 4- 0.3 <0,001 1e-43 2.8 2.0 4- 0.4 0.046 0.9 4- 0.0 0.094 8 e - 3 7 2.7 2.3 4. 0.8 0.079 2.0 4- 0.4 0.032 2 e - 3 7 2.5 8.3 4- 1.7 <0.001 4.8 4- 0.9 <0.001 4 e - 1 0 2.3 2.9 4- 0.5 <0.001 1.6 + 0.1 <0.001 OA_b2E03 N / A 2.2 2.9 ± 0.3 <0.001 2.9 ± 0.2 <0.001 RB 164.4 3 e - 3 4 2.2 2.2 4- 0.9 0,120 2.1 ± 0.3 0.021 ctg 62 N / A 2.1 2.1 4- 0.4 0.002 1.6 4- 0.3 0.029 O A _ b l A 0 6 N / A 2.1 2.0 ± 0.3 0.021 0.9 4- 0.0 0.144
a C l o n e s / c o n t i g s in boldface revealed transcript a c c u m u l a t i o n in R N A gel blot hybridizations. A c c e s s i o n n u m b e r s of clones are listed in
table $3 ( s u p p l e m e n t a r y material). b Blast hit E-value.
c E p i d e r m i s specificity factor.
a H y b r i d i z a t i o n signal ratio o b t a i n e d with probes f r o m Bgh inoculated and control epidermis (Epi) a n d mesophyll (Meso) p r e p a r a - tions, respectively. R a t i o s >2 are in boldface.
e p values indicate t h e significant difference o f the m e a n logz-transformed ratios o f c h a l l e n g e d plants over ratio one in three inde- p e n d e n t experiments.
which resulted in hybridization signals accumulat- ing after powdery mildew inoculation when used as probes in R N A gel blot hybridizations (see above; data not shown). Although a cDNA-AFLP band may have contained more than one sequence, the fact that subclones from these bands also detected accumulating transcripts in the micro- array hybridization experiments is consistent with the R N A gel blot hybridization results and cor- roborates the microarray data.
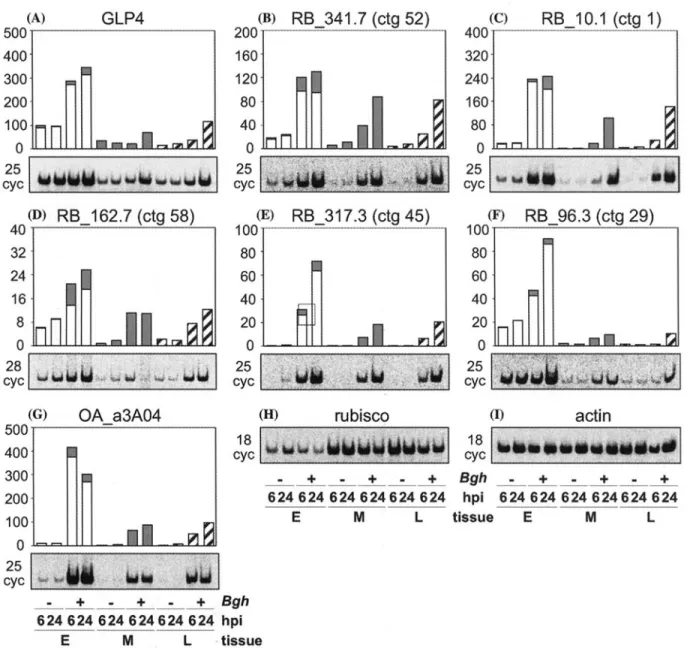
In addition, the microarray hybridization data were verified by quantitative RT-PCR for seven transcripts accumulating strongly in the epidermis after
Bgh
inoculation. PCR was performed in the presence of 33p-c~-dCTP and aliquots were taken after 19, 22, 25, 28, and 31 cycles using actin as a standard. These products were separated on non- denaturing polyacrylamide gels, exposed to phos- phor screens and signals were quantified using OptiQuant software (Perkin-Elmer). The values were normalized using a calibration curve calcu- lated from the actin standard (see Methods). Since a contamination of epidermis preparations with mesophyll cells was not avoidable, the signal of themesophyll marker rubisco was used to calculate the epidermal and mesophyll portion of the signal of a probe, as described above. The results obtained (Figure 2) were very similar to the microarray data obtained for these clones, con- firming the reliability of the microarray hybridiza- tion results.
Discussion
Microarray hybridization analysis
Two different labelling methods were used to generate fluorescent probes. If enough total R N A was available, i.e. if RNA was extracted from total leaves, m R N A was isolated and subjected to the standard, indirect labelling method. If only limited amounts of total R N A were available, i.e. if RNA was extracted from the epidermis and the mesophyll, the R N A was amplified using T7-RNA polymerase prior to standard labelling. This amplification step may distort the relative abun- dance of individual R N A species, although there
Table 2. M i c r o a r r a y d a t a for genes induced by Bgh predominantly in the m e s o p h y l l (ES < 2).
Putative f u n c t i o n (accession #) EST I D a E-val b ES c Epi d P val e M e s o d P valc
Defense protein
fl-l,3-Endoglucanase, T. aestivum (Y18212) /~-l,3-Endoglucanase, T. aestivum (Y18212) ]~-l,3-Endoglucanase, T. aestivum (Y18212)
T h a u m a t i n - l i k e protein T L P 4 , H. vulgare (AF355455) /¢-l,3-glucanase, T. aestivum (AF112965)
P a t h o g e n e s i s related protein 1.1, T. aestivum (AJ007348) T h a u m a t i n - l i k e protein, T. aestivum (X58394)
P a t h o g e n i c related protein in r e s p o n s e to Bgh, H. vulgare (Y10813)
T h a u m a t i n - l i k e protein T L P 8 , H. vulgate (AF355458) ]%l,3-Endoglucanase, T. aestivum (Y18212)
WCI-5, T. aestivum (U32431)
G e r m i n 9f-2.8 gene, T. aestivum (M63223) N B S - L R R disease resistance p r o t e i n h o m o l o g u e ,
H. vulgate (AJ507096)
Superoxide d i s m u t a s e - 4 A , Z. mays (Xt7564) Chitinase II (PR-3), H. vulgare (AJ276226) Phenolie metabolism
C i n n a m y l alcohol d e h y d r o g e n a s e , Lolium multifiorum Detoxifieation, redox processes
Put. g l u t a t h i o n e S-transferase, 71 aestivum (BT009348) N A D H d e h y d r o g e n a s e , S. tuberosum (AJ245862) Abiotic stress
C h a p e r o n i n hsp60, Z. mays (L21006) HSP70, P. Sativum (X54739) Vesicle t r a n s p o r t
Put. M e m b r a n e associated protein, A. thaliana (AY096741) Protein degradation
Subtilisin-chymotrypsin inhibitor 2, H. vulgare (Y08625) L o n protease h o m o l o g 1, Z. mays (Q8GV57)
A l p h a s u b u n i t o f 20S p r o t e a s o m e , O. sativa (Q9LSU1) Kinase, receptor
Similar to w a k 4 (wall-associated kinase), A. thaliana ( Q 9 L W G 6 )
Putative histidine kinase, O. sativa (Q852H8) Leucine-rich-like protein, Aegilops tausehii ( Q 8 L K V 9 ) Transcription factor
M y b - r e l a t e d protein, O. sativa (Q7XBH4) Transport
Sec61 a l p h a subunit, H. vulgare (AY044237) U D P - g a l a c t o s e / U D P - g l u c o s e t r a n s p o r t e r ,
A. thaliana (AY115566)
Put. peptide t r a n s p o r t e r protein, H. vulgare (AJ495773) Glyeosylation
Putative immediate-early salicylate-induced glucosyltransferase, O. sativa (Q84M46)
Cis-zeatin O-glucosyltransferase, Z. mays (Q8S465)
ctg 15 l e - 1 4 0 0.9 8.5 ± 0.7 ctg 69 l e - 8 3 0.8 7.5 -4- 0.7 ctg 91 l e - 1 0 0 0.9 6.0 ± 0.5 ctg 83 7 e - 4 6 1 4.4 -4- 1.1 ctg 79 l e - l l l 0.5 4.2 -4- 1.5 ctg 72 l e - 7 3 0.5 3.2 ± 0.8 ctg 85 2 e - 6 6 0.6 3.0 ± 0.5 etg 39 6 e - 0 8 1.3 2.5 -4- 0.2 <0.001 21.0 ± 1.4 <0.001 <0.001 25.2 • 1.0 <0.001 < 0 . 0 0 1 12.0 ± 0.9 < 0 . 0 0 1 <0.001 12.1 + 3.4 <0.001 0.009 18.1 ± 6.3 0.010 <0.001 8.9 =t= 1.6 <0.001 <0.001 7.6 ± 0.7 <0.001 <0.001 2.8 -4- 0.3 <0.001 ctg 18 4 e - 0 8 1.1 2.3 -4- 0.4 <0.001 3.4 + 0.4 <0.001 c t g 6 3 e - 2 8 0.5 2.0 + 0.4 0.009 6.5 + 0.7 <0.001 RB_360.4 l e - 1 0 9 1.3 1.8 ± 0.4 0.064 3.5 ± 0.3 0.003 c t g 5 7 3 e - 7 3 0.5 1.7 + 0.2 0.039 5.4 ± 0.8 <0.001 O A a l E 0 8 4 e - 5 1 1 1.7 i 0.4 0.035 2.2 ± 0.7 0.012 c t g 6 4 3 e - 2 2 0.8 1.3 -4- 0.1 0.059 3.3 • 0.3 <0.001 etg 28 6 e - 2 2 0.8 1.3 + 0.1 <0.001 2.5 -4- 0.1 <0.001 ctg 98 l e - 5 7 1.5 2.6 -4- 0.1 <0.001 2.2 -4- 0.4 <0.001 ctg 17 2 e - 2 5 1.6 4.2 ± 0.4 <0.001 5.0 -4- 0.6 <0.001 OA a 2 B l l 5 e - 6 2 1.1 2.7 -4- 0.3 <0.001 3.3 + 0.6 0.010 OA b l C 0 9 8 e - 4 0 1.1 1.4 -4- 0.3 0.261 5.2 -4- 1.6 0.006 O A a3B09 8 e - 4 8 0.9 0.8 i 0.1 <0.001 2.9 + 0.6 < 0 . 0 0 1 e t g 4 l e - 0 7 1.7 2.2 -4- 0.2 < 0 . 0 0 1 1.9 ± 0.1 < 0 . 0 0 1 etg 29 3 e - 2 4 1.8 6.7 + 0.4 <0.001 15.5 ± 0.9 <0.001 RB 216A.4 8 e - 1 9 1.2 2.7 ± 0.9 0.090 2.2 J: 0.5 0.044 O A _ b l G 0 5 2 e - 4 2 0.3 0.9 -4- 0.2 0.224 3.0 + 0.5 <0.001 ctg 52 l e - 0 8 1.5 9.1 • 1.4 <0.001 6.1 -4- 0.5 < 0 . 0 0 1 ctg 33 7 e - 2 1 0.9 1.7 -4- 0.2 <0.001 3.3 -4- 0.7 <0.001 RB_286.2 l e - 1 4 1 1.4 -4- 0.3 0.162 2.4 -4- 0.3 0.010 RB 226.2 7 e - 0 9 1.3 1.6 + 0.6 0.227 2.0 -4- 0.3 0.014 ctg 121 3 e - 3 4 0.8 4.9 -4- 1.1 0.003 9.8 ± 2.1 <0.001 ctg 53 5 e - 8 8 0.5 2.6 ± 0.1 <0.001 4.0 :t: 0.2 < 0 . 0 0 1 c t g 2 1 l e - 3 3 1.9 2.1 -4- 0.3 <0.001 1.6 ± 0.2 < 0 . 0 0 1 c t g 4 8 2 e - 2 9 1.1 35.3 -4- 5.6 <0.001 34.2 :t: 4.2 < 0 . 0 0 1 ctg 27 3 e - 1 0 1.7 2.8 ± 0.4 <0.001 3.3 + 0.5 <0.001
2 5 4
Table 2. C o n t i n u e d .
P u t a t i v e f u n c t i o n (accession #) EST I D a E-val b ES c Epi d P val e M e s o d P val e
Diverse processes
P I R 7 a a n d P I R 7 b genes, O. sativa (Z34271) ctg 58 3 e - 2 3 1.4 3.9 ± 1.0 < 0.001 3.6 Putative myosin-like protein, A. thaliana ( A K l 1 8 7 2 1 ) RB_226.3 6 e - 1 7 0.9 3.8 ± 0.5 0.005 9.7 K a u r e n e synthase, Z. m a y s (AF105149) etg 47 l e - 2 0 1.8 2.7 4- 0.5 <0.001 2.8 3 - p h o s p h o s h i k i m a t e 1-carboxyvinyltransferase, etg 119 7e-21 0.8 2.3 ± 0.3 <0.001 4.2
Z . m a y s (Q946U9)
2 - o x o g l u t a r a t e d e h y d r o g e n a s e , A. thaliana (AJ223802) OA_a3B02 l e - 1 0 3 1.7 2.1 + 0.2 <0.001 1.3 Calreticulin ( C R H 2 ) , H. vulgate (L27349) ctg 44 l e - 4 0 0.6 2.0 ± 0.2 <0.001 5.9 Calreticulin (CRH2), H. vulgare (L27349) etg 14 1e-169 1.1 2.0 ± 0.2 <0.001 3.9 Calreticulin ( C R H 2 ) , H. vulgare (L27349) O A _ b 2 C 0 3 l e - 1 0 5 1.4 1.9 ± 0.4 0.010 4.8 d - T D P - g l u c o s e d e h y d r a t a s e , Phragmites australis O A _ a 2 H 0 2 l e - 1 0 9 0.6 1.5 ± 0.2 0.003 4.0
(AJ295156)
Pir7b, O. sativa (Z34270) O A _ b 2 A 0 7 l e - 7 1 0.6 1.4 ± 0.2 0.105 3.5 Cyclophilin, T. aestivum (AY290733) RB_244.2 6 e - 4 9 0.8 1.4 ± 0.2 0.082 3.3 E l o n g a t i o n factor 1 a l p h a - s u b u n i t , T. aestivum (M90077) ctg 66 2 e - 6 7 1.3 1.4 ± 0.1 0.006 2.6 Citrate synthase, O. sativa (AF302906) O A _ b l H l l l e - 9 0 1.4 1.4 ± 0.2 0.029 2.0 Put. G D P - m a n n o s e p y r o p h o s p h o r y l a s e , O. sativa RB_327.3 7 e - 5 6 1.2 1.3 ± 0.3 0.286 2.2
(AP004705)
60S r i b o s o m a l protein L10-2 (putative t u m o r s u p p r e s s o r ctg 117 9 e - 1 4 1.2 1.2 ± 0.1 <0.001 2.6 SG12), O. sativa (P45636)
Cytosolic G A P D H , T. aestivum (AF251217) O A _ b 3 C 1 0 4 e - 8 9 1 1.2 ± 0.1 0.154 2.2 60S ribosomal protein L12, A. thaliana (T45883) R B 50.4 6 e - 3 6 1.3 1.1 ± 0.1 0.302 2.0 Pir7b, O. sativa (Z34271) O A _ b l B 0 1 5 e - 8 0 0.6 1.0 4- 0.1 0.448 3.0
Unknown
Osr40g3 protein, O. sativa (Y08988) RB_282.5 3 e - 0 4 0.7 12.8 ± 3.2 0.004 27.0 W h e a t EST CD873563 ctg 25 l e - l 1 4 1.8 6.0 ± 0.5 <0.001 11.3 B A C clone:OJ1513_F02, g e n o m i c D N A , RB_I90.3 4 e - 0 3 1.6 3.8 ± 0.2 <0.001 5.2 O. sativa (AP005244) N o significant h o m o l o g y RB_107.2 N / A 1.9 3.7 ± 1.5 0.048 3.6 N o significant h o m o l o g y ctg 115 N / A 1 3.2 ± 0.3 < 0.001 4.9 W h e a t E S T BQ902295 ctg 123 2 e - 2 4 0.9 2.6 ± 0.4 0.003 3.9 c D N A clone:001-109-C01, O. sativa (AK062944) ctg 118 2 e - 0 3 1.2 2.5 ± 0.5 0.002 6.1 N o significant h o m o l o g y ctg 120 N / A 0.7 2.5 ± 0.5 0.010 5.6 N o significant h o m o l o g y RB_182.5 N / A 0.4 Z.1 -4- 0.0 <0.001 4.8 C D N A clone:J013161106, O. sativa (AK072199) etg 94 5e-21 1.2 2.0 ± 0.3 <0.001 3.6 N o significant h o m o l o g y ctg 80 N / A 1.2 1.7 ± 0.3 0.004 2.4 N o significant h o m o l o g y RB_151.1 N / A 0.8 1.5 ± 0.5 0.211 2.4 B A C clone: O S J N B b 0 0 9 1 E l l , g e n o m i c D N A , etg 42 l e - 1 0 1 1.5 ± 0.2 0.007 2.1 O. sativa (AL606629) N o significant h o m o l o g y RB_182.1 N / A 0.6 1.5 ± 0.2 0.069 2.0 W h e a t E S T CA642908 etg 88 4 e - 6 8 0.5 1.4 ± 0.1 0.011 2.0 H y p o t h e t i c a l protein, A. thaliana ( Q 8 R X U 1 ) O A _ b 2 F 0 9 2 e - 2 6 1.5 1.3 ± 0.2 0.016 2.1 P A C clone:P0684C01, g e n o m i c D N A , O. sativa etg 100 6 e - 2 3 1.1 1.2 ± 0.1 0.193 3.1
(AP002487)
N o significant h o m o l o g y RB_164.1 N / A 1.5 1.2 ± 0.4 0.348 2.3 c D N A clone H R O 4 4 5 3 F10 L19, O. sativa (CN817762) ctg 77 1e-22 0.8 1.2 ± 0.3 0.360 2.0 W h e a t E S T BE517301 RB_38B.3 3 e - 2 3 0.5 1.0 ± 0.2 0.084 2.5 G D S L - m o t i f lipase/hydrolase-like, clone etg 49 l e - 1 9 0.9 0.6 ± 0.0 <0.001 2.0 wlm24.pk0027.a6:fis, T. aestivum (BT009331)- ± 0.6 <0.001 ± 1.7 0.004 ± 0.3 <0.001 ± 0.6 <0.001 ± 0.1 0.065 ± 1.0 <0.001 + 0.6 <0.001 ± 1.6 0.033 ± 0.9 0.003 ± 0.6 <0.001 ± 0.7 0.023 ± 0.4 <0.001 ± 0.2 <0.001 ± 0.4 0.023 ± 0.4 <0.001 ± 0.5 0.046 ± 0.3 0.026 ± 0.5 <0.001 -4- 4.8 0.002 ± 1.2 <0.001 ± 0.4 <0.001 4- 0.9 0.018 + 0.4 <0.001 4- 0.7 0.002 ± 2.2 0.003 + 0.9 <0.001 ± 0.9 0.007 -4- 0.8 <0.001 ± 0.4 <0.001 -4- 0.7 0.044 -4- 0.3 <0.001 -4- 0.4 0.038 -4- 0.5 0.031 -4- 0.4 0.020 -4- 0.4 <0.001 4- 0.1 0.002 ± 0.2 <0.001 4- 0.5 0.006 -4- 0.1 <0.001
a C l o n e s / c o n t i g s in boldface revealed t r a n s c r i p t a c c u m u l a t i o n in R N A gel blot hybridizations. b Blast hit E-value.
c E p i d e r m i s specificity factor.
d H y b r i d i z a t i o n signal ratio o b t a i n e d w i t h probes f r o m Bgh inoculated a n d control epidermis (Epi) a n d m e s o p h y l l ( M e s o ) prepara- tions, respectively. R a t i o s >2 are in boldface.
e p values indicate the significant difference o f the m e a n log2-transformed ratios o f challenged plants over ratio one in three inde-
Table 3. M i c r o a r r a y d a t a for induced genes exclusively detected in whole leaves 6 a n d 24 h after i n o c u l a t i o n with Bgh.
Putative f u n c t i o n (accession #) E S T I D a E-val b 6 hpi P val e 24 hpi P vat e
255
Defense protein
/ M , 3 - G l u c a n a s e ( G L U 2 ) gene, H. vulgare (M91814) ctg 26 l e - 5 2 N B S - L R R disease resistance protein h o m o l o g u e , etg 12 8 e - 0 4
H. vulgare ( Q 8 4 K D 0 )
beta-glucanase, barley ($35156) RB 24.4 4 e - 5
Phenolic m e t a b o l i s m
Phenylalanine a m m o n i a - l y a s e , H. vulgare (Z49146) etg 11 l e - 4 3
Oxidative burst, detoxification
Putative N A D P H - d e p e n d e n t oxidoreductase, O A _ a 2 C 0 2 2 e - 1 5 P. somniferum (Q9SQ64)
Putative c y t o c h r o m e P450 (CYP87), O. sativa (Q7XU41) etg 70 4 e - 4 4
Abiotic stress
Hsp23.5, T. aestivum (AF104107) O A a l B 0 1 3 e - 3 4 Hsp23.6, T. aestivum (AF104108) O A _ a l H 0 2 2 e - 8 8
Protein degradation
U b i q u i t i n - c o n j u g a t i n g e n z y m e (UBC), H. vulgare (AY220735) RB_178.8 6 e - 1 0
Kinase, receptor
Putative wall-associated kinase 2, O. sativa ( Q 9 A R V 3 ) ctg 104 5 e - 0 9
Diverse proteins
Putative a s p a r t a t e a m i n o t r a n s f e r a s e , O.sativa (Q94315) R B 218.2 8 e - 1 6 Adenylate kinase-a, O. sativa (Q08479) O A a3A08 3 e - 3 2 Prohibitin, Z. m a y s (AF236371) O A _ a 3 C 0 3 l e - 1 1 4 Alanine a m i n o t r a n s f e r a s e (patent), H. vulgate (Z26322) O A a2D10 3 e - 9 9 G l u c o s e - 6 - p h o s p h a t e isomerase-like RB_291.4 5 e - 4 6
protein, O. sativa (AY224509)
P h o s p h o g l y c e r a t e m u t a s e , T. aestivum (AF475111) O A _ b 2 G 0 9 0 C y t o p l a s m a t i c a c o n i t a t e h y d r a t a s e , A. thaliana (AY136414) O A b3G05 4 e - 4 8 A D P f o r m i n g s u c c i n a t e - C o A ligase b-chain, O A _ b l D 0 1 3 e - 7 7
A. thaliana (AY099707)
Succinyl-CoA-ligase b e t a s u b u n i t , A. thaliana (AJ001808) O A _ b l E I 1 5 e - 4 6
Unknown
N o significant h o m o l o g y RB_104.3 N / A c D N A clone:J013165K20, O. sativa (AK072222) ctg 41 7 e - 0 4 W h e a t EST BE413608 ctg 103 4 e - l l W h e a t E S T C D 8 8 3 4 2 5 O A _ b l H 0 8 2 e - 5 8 W h e a t E S T BT009374.1 O A b3C12 0 W h e a t EST BF484342 O A b3E09 2 e - 3 1 1.7 4- 0.3 0.022 4.7 + 1.2 <0.001 1.0 4- 0.0 0.274 2.0 4- 0.2 <0.001 1.0 4- 0.1 0.419 2.0 4- 0.3 0.003 1.0 4- 0.0 0.349 2.6 4- 0.3 <0.001 1.6 t 0.2 0.015 3.1 4- 0.4 <0.001 1.1 4- 0.0 0.037 3.6 + 0.1 <0.001 2.1 4- 0.4 0.006 2.6 ~: 0.3 <0.001 1.4 4- 0.2 0.015 2.5 4- 0.5 <0.001 1.4 4- 0.3 0.091 5.4 4- 0.8 <0.001 1.3 + 0.1 0.001 2.9 4- 0.3 < 0 . 0 0 1 1.4 ± 0.4 0.175 2.2 4- 0.3 0.002 1.2 4- 0.1 0.118 3.2 4- 0.3 <0.001 1.1 4- 0.1 0.279 4.7 4- 1.0 <0.001 1.1 4- 0.1 0.263 2.7 4- 0.4 <0.001 1.1 4- 0.1 0.132 2.1 4- 0.2 <0.001 1.0 4- 0.1 0.405 2.3 4- 0.2 <0.001 1.0 ± 0.1 0.385 2.2 4- 0.1 <0.001 0.9 4- 0.1 0.024 2.3 4- 0.3 <0.001 0.8 4- 0.1 0.007 2.2 4- 0.2 <0.001 1.4 + 0.2 0.035 2.6 4- 0.4 0.002 1.3 4- 0.1 0.009 2.9 4- 0.5 <0.001 1.1 4- 0.1 0.086 3.1 4- 0.4 <0.001 1.1 4- 0.1 0.155 2.3 4- 0.3 <0.001 1.0 :t_ 0.1 0.437 2.0 4- 0.2 <0.001 0.9 ± 0.1 0.131 2.4 4- 0.3 <0.001
a Clones/contigs in boldface revealed transcript a c c u m u l a t i o n in R N A gel blot hybridizations. A c c e s s i o n n u m b e r s o f clones are listed in table $3 ( s u p p l e m e n t a r y material).
b Blast hit E-value.
c p values indicate the significant difference o f the m e a n log2-transforrned ratios o f challenged p l a n t s over ratio one in f o u r a n d six i n d e p e n d e n t e x p e r i m e n t s for the 6-and 24-h timepoint, respectively.
are many reports showing that this method is to be preferred over other amplification methods (Poirier and Erlander, 1998; Pfibon et al., 2001). However, comparing the results obtained from microarrays hybridised with probes labelled with different methods revealed that firstly, the sets of genes detected as being up-regulated were not
identical, and secondly, that the ratios between control and treatment signals o f transcripts detected with both methods showed differences. Nevertheless, the positive and the negative control genes showed the expected up-regulation and ratios around one, respectively, and thus, both methods delivered reliable results.
256 (A) 500' 400" 300" 2 0 0 100' 0
GLP4
cyc(I))
40 32 24 16 8 0 28 cycRB_162.7 (ctg 58)
20C 16C 12£ 80 40 0 25 ~ c y c (E) 10C 80 60 40 20 0 c y c(B)
RB_341.7 (ctg 52)
RB_317.3 (ctg 45)
- |
(c)
4 0 0 3 2 0 2 4 0 160 8 0 0 c y c 100 80 60 4 0 20 0 c y cRB_10.1 (ctg 1)
RB_96.3 (ctg 29)
__--11___51
(G) 5 0 0 4 0 0 3 0 0 2 0 0 100 0 25 cycOA_a3A04
(n)
rubisco
(I)
actin
18 cyc . + . + . + B g h 6 2 4 6 2 4 6 2 4 6 2 4 6 2 4 6 2 4 hpi E M L tissue . ÷ ÷ - ÷ 6 2 4 6 2 4 6 2 4 6 2 4 6 2 4 6 2 4 E M L 18 cyc B g h + + - + hpi 6 2 4 6 2 4 6 2 4 6 2 4 6 2 4 6 2 4 tissue E M L
Figure 2. RT-PCR quantification of selected epidermis-specific transcripts, mRNA levels were determined by RT-PCR using labelled 33p-e-dCTP. The relative quantity of amplified DNA was detected using a phosphor imager instrument and was expressed in relative digital light units (DLU). The data were normalised using actin transcripts as a standard. A-G. Average levels in two independent experiments of selected transcripts in Bgh-treated and non-treated wheat tissues (E, epidermis; M, mesophyll; L, whole leaves) at 6 and 24 hpi, respectively. Below each graph, an example of an autoradiogram of a polyacrylamide gel with the reaction products is shown. The PCR cycle (cyc) number is indicated for every sample. An autoradiogram of a polyacrylamide gel with RT-PCR products obtained with rubisco specific primers and actin specific primers is shown in (H) and ([), respectively.
M a n y d i f f e r e n t m e t h o d s exist to n o r m a l i s e d a t a , e.g. t o t a l i n t e n s i t y n o r m a l i s a t i o n ( Q u a c k e n b u s h , 2002) a n d L O W E S S n o r m a l i s a t i o n (Cleveland, 1979, 1981). B o t h m e t h o d s require as prerequisite t h a t the e l e m e n t s s p o t t e d o n the a r r a y represent a r a n d o m c o l l e c t i o n o f genes o f a n o r g a n i s m . T h e m i c r o a r r a y s u s e d in this w o r k , h o w e v e r , r e p r e s e n t e d
a selection o f genes f r o m screenings. M o s t o f these genes were likely to be i n d u c e d by Bgh a n d syringolin A, respectively, a n d thus, neither o f these n o r m a l i s a t i o n m e t h o d s o r o t h e r g l o b a l m e t h o d s c a n be used. T h e r e f o r e , a n o r m a l i s a t i o n m e t h o d w a s d e v e l o p e d t h a t relies o n a small f r a c t i o n o f genes t h a t likely d o n o t c h a n g e their e x p r e s s i o n levels after
treatment with diverse agents (Reymond et al., 2000). Several putative housekeeping genes and genes which showed no change in expression with several treatments obtained from preliminary experiments were used to calculate a factor that allows the correction of the signal intensities of one channel. Analysis of the normalisation factors of many experiments revealed that the signals of the red channel usually were lower than the signals of the green channel, which confirms the findings of others (Dudoit et al., 2002). Nevertheless, the differences in signal intensities of the control spots between the two channels were relatively small, because the two channels were equalised before acquiring the image with the help of the ScoreCard calibration control spots. Moreover, since the Cy5 signals tended to be weaker than the Cy3 signals, the induction ratio is likely an underestimation since usually the treatment sample was labelled with Cy5.
Powdery mildew interacts exclusively with the epidermis of the host, and it is therefore of interest to identify the genes which are expressed in epidermis cells. However, epidermis specificity of gene expression difficult to asses when the hybrid- ization probes are derived from epidermis prepa- rations contaminated with an sizable amount of mesoderm tissue, as was the case in our experi- ments. We tried to correct for the mesophyll contamination by calculating the epidermis spec- ificity value ES from the ratios of test gene signal to rubisco gene signal observed with epidermal and mesophyll probes, respectively. The calculated ES values underestimate the epidermis specificity because the signal of a gene originating from the adaxial epidermis still present in our mesophyU samples attributed to the mesophyll. The epider- mal fraction in the mesophyll preparations was estimated by measuring the portion of epidermis and mesophyll areas in cross-sections of primary wheat leaves, which were determined to be approximately 25% and 75%, respectively (data not shown). Therefore, the remaining adaxial epidermis in mesophyll samples accounted for approximately 12% of the volume. Moreover, the epidermis consists of different cell types with the majority lacking chloroplasts. However, the guard cells possess chloroplasts and are photosyntheti- cally active. This cell type constitutes about 10-15% of the number of total cells, and, there- fore, contributed in addition to the mesophyll
257
contamination of epidermis samples as estimated from the rubisco gene signal observed with hybrid- ization probes derived from epidermis samples. This may in part also explain that the ES value of several genes was below the value of one, as e.g. thaumatin-like protein (WIR2), which exhibited an ES of 0.5 (Table 2). Another reason for values smaller than one may be that in mesophyll samples, the hybridization of rubisco cDNA with D N A of the rubisco spots reached saturation due to the high concentration of probe representing rubisco transcripts, and, thus, the acquired signal was not proportional to the rubisco cDNA in the hybridization solution. Hence, the rubisco gene expression was likely to be underestimated in experiments with mesophyll probes. In conclusion, on the one hand, overestimation of rubisco expression in epidermis samples and on the other hand, underestimation of rubisco signal in meso- phyll samples may have contributed to generally too low ES values. Thus, an ES value of >2 as evidence for transcript accumulation in the epidermis certainly is conservative.
Transcripts accumulating in the epidermis upon Bgh-inoculation
In the cDNA microarray hybridization analysis, transcripts corresponding to many different con- tigs/clones were shown to exhibit an ES value of (ES _> 2) and therefore to accumulate in the epidermis after inoculation with Bgh.
Several genes were identified which likely are involved in detoxification and redox processes. An alternative oxidase transcript (clone OA_alE06, Table 1) showed an exceptionally high ES value of 12. Alternative oxidase (AOX) is a mitochondrial enzyme encoded in the nucleus that may help to reduce reactive oxygen species (ROS) production in mitochondria. A O X antisense tobacco plants show an enhanced hypersensitive response (Vanlerberghe
et al., 2002), and, conversely, overexpression pro-
tected cells from H R (Maxwell et al., 1999). This may seem paradoxical in the wheat-Bgh interaction analysed here, where about 50-70% of the cells interacting with the fungal spores undergo H R (unpublished observation). Thus, one may specu- late that AOX accumulates in mitochondria of cells neighbouring an attacked cell and acts to restrict the size of lesions caused by H R (Ordog et al.,
258
2002). Two other genes involved in ROS metabo- lism were induced in the epidermis: G L P 4 (AJ237942; Table 1), whose product has recently been shown to exhibit superoxide dismutase activ- ity and to contribute to quantitative powdery mildew resistance in wheat and barley (Schweizer
et al., 1999; Christensen et al., 2004), and a peroxidase gene (ctg 114; Table 1). Epidermally induced genes likely involved in detoxification encode a gluthatione-S-transferase (OA_b3D05; Table 1), a berberine bridge enzyme-like enzyme, a cytochrome P450, and mitochondrial NAD-depen- dent formate dehydrogenase (FDH). In potato,
F D H was found to be strongly induced by stresses and by spraying with formate and methanol (Hourton-Cabassa et al., 1998). In plants, a likely source of methanol in leaves is from pectin deme- thylation of cell walls (Obendorf et al., 1990). An enzyme capable of this reaction is the pectin methyl esterase, which is induced after wounding in Ara-
bidopsis leaves (Reymond et al., 2000). Pectin (e.g. galacturonan) is produced during cell wall synthe- sis, e.g. cell expansion and pathogen defense (Levy and Staehelin, 1992; Fall and Benson, 1996) and constitutes up to 35% of the cell wall mass of dicotyledonous plants, but is less abundant in cell walls of grasses. However, the production of methanol may lead to accumulation of formate in epidermal cells, since they produce cell wall com- ponents in order to withstand penetration of pathogens. In this regard, the induction of the formate dehydrogenase may be viewed rather as a secondary response to infection than a primary one. Two epidermally induced genes encode pro- teins likely involved in vesicle docking. Ctg 99 (Table 1) codes for a protein with similarity to VAP27, a VAP33-1ike tomato protein found to bind to Cf-9, the product o f the Cf-9 resistance gene, in a yeast two-hybrid screen (Laurent et al., 2000). V A P 3 3 was described initially in Aplysia
californica as a member of the SNARE complex involved in vesicular docking and neurotransmit- ter exocytosis (Skehel et al., 1995). VAP33 is a presynaptic membrane protein that interacts spe-
cifically with VAMP. This interaction is
responsible for the docking and fusion of the synaptic vesicle to the plasma membrane. Thus, transcripts corresponding to ctg 99 encode a protein likely involved in vesicle docking. Clone RB_339.8 (Table 1) encodes a protein with sim- ilarity to the Rab family of small G-proteins,
members of which are involved in SNARE complex formation during vesicle docking (St~d- hof, 1997; Sato and Wickner, 1998; Jahn et al., 2003). VEsicle docking has recently been shown to be important in the defense against pathogens in Arabidopsis and barley. The Arabidopsis P E N 1 gene and the barley R O R 2 gene, which both are involved in penetration resistance, encode func- tional syntaxins. Syntaxins are members of the SNARE superfamily that mediate membrane fusion events. Arabidopsis p e n l mutant plants exhibit an impaired non-host penetration resis- tance against barley powdery mildew, whereas the barley R O R 2 gene is required for mlo-mediated as well as for basal penetration resistance to Bgh (Freialdenhoven et al., 1996). ROR2 interacts with HvSNAP34, a SNAP-25 SNARE homolog in the yeast two-hybrid protein interaction assay and it is required for full resistance (Collins et al., 2003). Since SNARE proteins are required for resistance, it implies a role for membrane fusion in pathogen defense. Indeed, recent observations showed that large vesicles (2-3/~m) containing H202 were detected in the host cells beneath appressoria (Collins et al., 2003). Consistently, the accumulation of vesicles at the site of penetration was negatively influenced by ror mutants and the extent of resistance coincided positively with the amount of vesicles.
Several induced genes were identified that encode proteins involved in signal transduction processes. A lectin-like kinase (clone RB_78.2; Table 1) and two leucine-rich repeat (LRR) recep- tor-like kinases (RLK; ctg 105 and ctg 99.2; Table 1) were specifically expressed in the epider- mis. Such proteins may be involved in the recog- nition of fungus-associated molecular patterns like the one recently described by Schweizer et al. (2000). Recently, Eckey et al. (2004) reported the cloning of a lectin domain-containing receptor-like
kinase from powdery mildew-infected bar-
ley (accession (AJ427599). The biolistic dsRNA- mediated knock-down of the AJ427599-encoded protein resulted in a 26% reduction of the pene- tration efficiency of a compatible powdery mildew isolate, suggesting that the corresponding gene was expressed in epidermal cells, because only these cells can be biolistically transformed. However, the protein encoded by RB_78.2 is not closely related in sequence to the AJ427599-encoded protein and thus is not the ortholog.
One of the most strongly expressed genes in both epidermal and mesophyll tissues was the gene corresponding to ctg 1 (Table 1) which shows similarity to the G I G A N T E A ( G I ) gene. Muta- tions in the GI gene of Arabidopsis cause a pleiotropic phenotype with effects on flowering time in response to photoperiod, phytochrome B signalling, the circadian clock and carbohydrate metabolism (Eimert et al., 1995; Fowler et al., 1999; Park et al., 1999; Huq et al., 2000). The GI ortholog of rice was also shown to regulate flowering time in rice (Hayama et al., 2003). Recently, GI was found to be induced 10-fold after cold acclimation in Arabidopsis (Fowler and Thomashow, 2002) and to be localised in the nucleus (Huq et al., 2000). Interestingly, GI was among the proteins found in a yeast two-hybrid screen for proteins that interact with SPINDLY (SPY), and it was shown to interact with the tetratricopeptide repeat (TPR)-domain of SPY. SPY was initially identified as a negative regulator of gibberellin signalling in Arabidopsis, but also functions in previously undefined pathways (Tseng
et al., 2004). TPRs can act as scaffolds for the
assembly of multiprotein complexes (Blatch and Lassie, 1999), e.g. in the assembly of Hsp70-Hsp90 multichaperone complexes (Scheufler et al., 2000). To our knowledge, no association with responses to pathogen-attack has been reported for GI, and the function of this gene with respect to pathogen- defense, if any, remains presently unknown.
Genes induced in the mesophytl ( E S value <2)
Genes induced by Bgh that exhibited an ES value <2 and therefore were mostly expressed in the meso- phyll are listed in Table 2. In addition to defense- related genes encoding homologs of the rice Pir7 esterases (clone OA_b2A07, OA_b 1 B01, and ctg 58; W/ispi et al., 1998), superoxide dismutase (ctg 64), and some other proteins, a prominent group of induced genes encode well known PR proteins (Table 2). For the PR-2 (/3-1,3-glucanases) and PR- 5 (thaumatin-like proteins; TLPs) classes, several homologous transcripts were found to accumulate following Bgh inoculation.
Three calreticulin transcripts (ctg 44, ctg 14, clone OA_b2C03; Table 2) were also shown to accumulate. Plant calreticulin genes were previously shown to be pathogen-induced and are thought to have a role as chaperones in the
259
endoplasmatic reticulum (ER) necessary for the secretion of PR and other secreted proteins (Denecke et al., 1995; Nelson et al., 1997; Jelitto- Van Dooren et al., 1999). Apparently, the ER translocation capacity is also increased as tran- scripts encoding a protein similar to the Sec61 alpha subunit of this translocation apparatus (ctg 121; Table 2) were found to strongly accumulate in response to Bgh inoculation. Also induced is a gene encoding a putative UDP-galactose/UDP- glucose transporter (ctg 53) which may provide the substrates for protein glycosylation of secreted proteins or polysaccharide biosynthesis in the compartments along the secretory pathways.
Ctg 48 and ctg 27 show similarity to glucos- yltransferases. The gene corresponding to ctg 48 was the most strongly induced in the mesophyll (Table 2). The substrates of GTs are quite diverse, including plant hormones, secondary metabolites involved in stress and defense responses, and xenobiotics such as herbicides. These compounds can be activated or inactivated by glucosylation. Glucosides play also a role in the accumulation of phenylpropanoids that would be toxic in their free form and generally, they are stored as glucosides in plants. GTs were identified to be induced after wounding and pathogen-attack (Lee and Raskin, 1999). One of these genes encoding a GT of tomato ( T w i l ) is involved in the conjugation of small molecular weight substrates such as phen- olics and flavonoids (O'Donnell et al., 1998). In tobacco, two GTs, which act on phenylpropa- noids and benzoic acid derivates, including sali- cylic acid, were found to be induced by infection, treatment with elicitors and salicylic acid (Fraissinet-Tachet et al., 1998). Recently, tobacco plants depleted of UDP-Glc:phenylpropanoid glucosyltransferase by antisense expression were shown to be more susceptible to virus infection and to accumulate less scopoletin glucosides (Chong et al., 2002). These results suggest that glucosyltransferases are important in the response to pathogens, however, the substrate of GTs found in this work is presently not known.
Induced genes involved in signal transduction
and gene regulation encode a Myb-related
transcription factor (clone RB_226.2), a putative histidine kinase (ctg 33), an L R R - R L K (clone RB_286.2), and a protein similar to wall-associated kinases (WAK; ctg 52). The latter proteins contain a cytoplasmatic Ser/Thr kinase (STK) domain and
260
an extracellutar region with similarity to vertebrate epidermal growth factor (EGF)-like domains. W A K s are considered to physically link the extra- cellular matrix and the cytoplasm and to be involved in signalling (He et al., 1996; Kohorn, 2000; Anderson et al., 2001). Expression of WAK1
in Arabidopsis is stimulated by the resistance activators INA (2,6-dichloroisonicotinic acid) and SA (salicylic acid) as well as by Pseudomonas syringae (He et al., 1998). It has been demonstrated that the induction of W A K 1 is required for plants to withstand Pseudomonas syringae infection (He et al., 1998). Recently, (Park et al., 2001) demon- strated that a glycine-rich secreted protein of
Arabidopsis (AtGRP-3) specifically bound to the extracellular domain of WAK1. Moreover, A t G R P - 3 induced PR-1 and triggered a positive feedback loop that up-regulated the expression of
W A K 1 and A t G R P - 3 . In contrast, W A K 4 of
A. thaliana is implicated in cell expansion since silencing of W A K 4 resulted in inhibition of cell elongation and an altered morphology (Lally et al.,
2001).
In contrast to the epidermis, no induction of subtilisin proteases was detected, but a subtilisin- chymotrypsin inhibitor-2-1ike genes was strongly induced (Table 2).
Induced genes revealed by probes f r o m whole leaves 6 and 24 hpi
As evident from Figure 1, the set of induced genes as revealed by hybridization probes derived from epidermal and mesophyll preparations is not completely congruent with the one obtained with probes from whole leaves. This is probably mainly due to the fact that the latter probe was labelled with a different procedure (indirect labelling) than the former two, which where amplified before the indirect labelling (see Methods). Thus, the distor- tions in the representation of the true transcript abundances may not have been identical. From the 25 genes uniquely revealed with probes from whole leaves, the two most strongly induced genes seem noteworthy: Clone RB_178.8 corresponds to a protein homologous to a ubiquitin-conjugating enzyme and clone OA_a3C03 to a prohibitin.
Ubiquitin-conjugating enzymes (ubiquitin-car- rier proteins) are involved in ubiquitin-proteasome proteolytic pathways the importance of which with respect to plant defense regulation is increasingly
recognised (Devoto et al., 2003). Briefly, the target protein is bound to a specific ubiquitin-protein ligase (E3). The ubiquitin-activating enzyme (El) together with the ubiquitin carrier protein (E2) activate ubiquitin. The activated E2-ubiquitin- complex is bound to a E3-substrate-complex where the ubiquitin is transferred from E2 to the substrate. This step is repeated several times and afterwards, the ubiquitin-tagged substrate is de- graded by the 26S proteasome complex (Glickman and Ciechanover, 2002). This pathway was shown to regulate hypersensitive cell death mediated by race-specific resistance genes in barley and Ara- bidopsis, and several genes required for this process encode proteins interacting with E3 com- plexes (Austin et al., 2002; Azevedo et al., 2002). Several other E3-ubiquitin-ligases have been iden- tified as candidates for involvement in defense signalling pathways (Salinas-Mondrag6n et al.,
1999; Durrant et al., 2000). However, to date, there are not many reports on ubiquitin-carrier proteins that are up-regulated after fungal treat- ment, as is the one corresponding to clone RB 178.8.
In barley, the identification of powdery mildew- induced genes by c D N A - A F L P at the 4 and 12 hpi timepoints has recently been reported (Eckey et al.,
2004). In these experiments, whole leave material was used. For 29 ESTs, Bgh-induced transcript accumulation was shown using RT-PCR. In addi- tion to the lectin domain-containing receptor like kinase mentioned above, a number of proteins are encoded by these clones that are similar to peptides encoded by clones identified in this study: A putative peptide transporter (AJ495773/ctg 21; Table 2), phenylalanin ammonia-lyase (AJ427587 and BE415189/ctg 101 and ctg 11; Tables 1 and 3, respectively), a cytochrome P450 (AJ495774/ctg 36; Table 3), and a 3-phosphoshikimate 1-carb- oxyvinyltransferase (AJ495777/ctg 119; Table 2). Differences in the nature of c D N A - A F L P clones obtained in our work and the one of Eckey et al.
(2004) may be due to a number of causes, including different experimental setup (epidermis preparation vs. whole leaf tissue), different time points, and the use of different plant species.
Contig 119 (Table 2) encodes a putative 3-phos- phoshikimate 1-carboxyvinyltransferase, an en- zyme involved in chorismate synthesis. Transcripts encoding several enzymes in the shik- imate pathway were also shown to be members of