Regular paper
Effects of anaerobiosis as probed by the polyphasic chlorophyll a
fluorescence rise kinetic in pea (Pisum sativum L.)
Pierre Haldimann
∗& Reto J. Strasser
Bioenergetics Laboratory, University of Geneva, ch. Embrouchis 10, CH-1254 Jussy, Geneva, Switzerland∗Author for correspondence (fax: +41 22-759-19-45; e-mail: Haldiman@sc2a.unige.ch)
Received 13 April 1999; accepted in revised form 18 August 1999
Key words: anaerobiosis, chlorophyll fluorescence, chlororespiration, fluorescence induction, Photosystem II, Pisum sativum
Abstract
We analysed the changes of the chlorophyll (Chl) a fluorescence rise kinetic (from 50 µs to 1 s) that occur when leaves or chloroplasts of pea (Pisum sativum L.) are incubated under anaerobic conditions in the dark. In control leaves, Chl a fluorescence followed a typical O-J-I-P polyphasic rise [Strasser et al. (1995) Photochem Photobiol 61: 32–42]. Anaerobiosis modified the shape of the transient with the main effect being a time-dependent increase in the fluorescence yield at the J-step (2 ms). Upon prolongation of the anaerobic treatment (> 60 min), the O-J-I-P fluorescence rise was eventually transformed to an O-J (J = P) rise. A similar transformation was observed when pea leaves were treated with DCMU or sodium dithionite. Anaerobiosis resulted in a 10–20% reduction in the maximum quantum yield of the primary photochemistry of Photosystem II, as measured by the ratio of the maximal values of variable and total fluorescence (FV/FM). When the leaves were returned to the air in the dark, the
shape of the fluorescence transient showed a time-dependent recovery from the anaerobiosis-induced change. The original O-J-I-P shape could also be restored by illuminating the anaerobically treated samples with far-red light but not with blue or white light. Osmotically broken chloroplasts displayed under anaerobic conditions fluorescence transients similar to those observed in anaerobically treated leaves, but only when they were incubated in a medium comprising reduced pyridine nucleotides (NADPH or NADH). As in intact leaves, illumination of the anaerobically treated chloroplasts by far-red light restored the original O-J-I-P transient, although only in the presence of methyl viologen. The results provide additional evidence for the existence of a chlororespiratory pathway in higher plant cells. Furthermore, they suggest that the J-level of the fluorescence transient is strongly determined by the redox state of the electron carriers at the PS II acceptor side.
Abbreviations: Chl a – chlorophyll a; DCMU – 3-(3,4-dichlorophenyl)-1,1-dimethylurea; EDTA – ethylendediaminetetraacetic acid; FM– maximal fluorescence yield; F0– minimal fluorescence yield; FV– maximal
variable fluorescence yield, equal to FM-F0; FR – far-red light; HEPES –
4-(2-hydroxyethyl)piperazine-1-ethanesulfonic acid; I and J – intermediate steps in the Chl a fluorescence transient appearing between F0 and
FM; methyl viologen – 1,10-dimethyl-4,40-bipyridylium dichloride; MOPS – 3-morpholinopropanesulfonic acid;
PS I – Photosystem I; PS II – Photosystem II; PQ – plastoquinone; PQH2– plastoquinol; QA– primary quinone
electron acceptor of PS II; QB– secondary quinone electron acceptor of PS II; RC – reaction centre
Introduction
The interaction between photosynthetic and respirat-ory electron transport chains is well documented in
bacteria exhibiting oxygenic respiration where the two redox chains are located on the same membrane and share some components (Scherer 1990; Büchel and Garab 1997). In eukaryotic organisms, photosynthetic
68
activity is located in the chloroplasts and respira-tion was thought to be restricted to the mitochondria. This long-standing view was challenged by Bennoun (1982) who reported on the existence of a respiratory electron transport chain in the chloroplasts of green algae. Since then there were several studies reporting on the activity of this so-called chlororespiratory path-way in the chloroplasts of algae (Peltier et al. 1987; Ravenel and Peltier 1992) and higher plants (Garab et al. 1989; Singh et al. 1992; Harris and Heber 1993; Endo et al. 1997; Corneille et al. 1998; Feild et al. 1998). Chlororespiration is thought to consist of the non-photochemical reduction of plastoquinone (PQ) by an NAD(P)H–PQ oxidoreductase with the sub-sequent dark reoxidation of reduced PQ by a putative terminal oxidase leading ultimately to the reduction of molecular oxygen.
In leaves of higher plants, non-photochemical PQ reduction has been observed upon a light-to-dark transition (Asada et al. 1993; Groom et al. 1993; Feild et al. 1998), as well as after an incubation under anaer-obic conditions in the dark (Harris and Heber 1993). The main evidence for the existence of a respiratory electron transport chain in the chloroplasts of higher plants comes from the analysis of the genome. In-deed, chloroplastic DNA of several plant species have been shown to contain 11 genes (ndhA–ndhK), the sequences of which show homologies to sequences coding for subunits of the mitochondrial and eubac-terial NADH-ubiquinone oxidoreductase (Shinozaki et al. 1986; Sugiura 1992; Burrows et al. 1998; Kofer et al. 1998; Sazanov et al. 1998a,b). Concerning the reoxidation of reduced PQ in the dark, indirect evid-ence is given in the literature that it could be mediated by an oxidase located in the thylakoid membranes, but molecular proof remains to be shown (see Scherer 1990; Büchel and Garab 1997; Feild et al. 1998).
With the advancement of instrumentation, the tran-sient of chlorophyll (Chl) a fluorescence induction, also denoted as Kautsky effect (Kautsky and Hirsch 1931), has become one of the most important tools in basic and applied photosynthesis research (for recent reviews see Karukstis 1991; Krause and Weis 1991; Schreiber and Bilger 1993; Dau 1994; Govindjee 1995). The transient consists of light intensity depend-ent changes in Chl a fluorescence emission when a dark-adapted leaf or chloroplast suspension is illumin-ated with continuous light. It is generally accepted that Chl a fluorescence rise kinetics reflects the closure of the reaction centres (RCs) of Photosystem II (PS II), related to the reduction of QAto QA−, and can
there-fore provide information on the photochemical activity of PS II and the associated filling up of the PQ pool (Krause and Weis 1991; Dau 1994; Govindjee 1995). At room temperature, the Chl a fluorescence transient induced by the illumination of a sample with a high-intensity actinic light (about 600 W m−2) displays a polyphasic rise with two intermediate steps appearing between the minimum yield F0(O) and the maximum
yield FM(P) (Neubauer and Schreiber 1987; Schreiber
and Neubauer 1987; Strasser and Govindjee 1991, 1992; Strasser et al. 1995). The two intermediate steps, called I1 and I2 (Neubauer and Schreiber 1987), or
J and I (Strasser et al. 1995), are more clearly re-vealed when the fluorescence kinetics are plotted on a logarithmic time scale (Strasser and Govindjee 1991, 1992). They appear at about 2 ms and 30 ms, respect-ively, though the precise times depend on the intensity of excitation light. This so-called O-J-I-P transient (Strasser et al. 1995) has been attributed to the dy-namic variation of the concentrations of the various redox states of the PS II units, with QA−QBand QA−
QB−predominating at J- and QA−QBH2at I- and
P-step (Stirbet et al. 1998). The I to P phase has been proposed to arise from the elimination of PQ quench-ing due to the reduction of PQ (Vernotte et al. 1979; Strasser et al. 1995; Stirbet et al. 1998).
In this study, we have used the technique of meas-uring the fast Chl a fluorescence rise kinetic (from 50 µs to 1 s) in order to follow and characterise the effect of anaerobiosis in the dark on the photosynthetic ap-paratus in pea (Pisum sativum L.) leaves, a treatment known to enhance the non-photochemical reduction of the PQ pool (Harris and Heber 1993; Corneille et al. 1998). It will be shown that the shape of the polyphasic Chl a fluorescence rise curve changes dramatically when pea leaves are incubated under an-aerobic conditions. Moreover, it will be demonstrated that anaerobiosis-induced changes of the fluorescence transient are reversible and that they can be simulated by the infiltration of the leaves with the strong reduct-ant sodium dithionite. In addition, it will be shown that there are conditions under which isolated chloroplasts display fluorescence transients with a shape compar-able to that observed in anaerobically treated leaves.
Materials and methods Plant material
were grown in a greenhouse with additional light provided by metal halogen lamps (Philips HQI 400 W) in 1-dm3pots with commercial soil (Belflor, universal
potting soil, Bachmann Co., Chevroux, Switzerland) at a temperature of 22 ◦C/16 ◦C (day/night). The plants were regularly watered and fertilised twice a week with a solution of Algoflash (Algochimie Co., Z.I. Nord, Chateau-Renault, France). All the experi-ments were carried out using fully mature leaves of 3–4-week-old plants.
Chloroplast isolation
Chloroplasts were isolated at 4 ◦C from pea plants that had been dark-adapted overnight. Sliced leaves were homogenised for 10 s in a Waring Blender in a grinding medium containing 330 mM sorbitol, 30 mM MOPS-KOH (pH 7.8), 2 mM EDTA and 0.15% BSA. The slurry was filtered through two layers of Nylon (36 µm) plus two layers of muslin cloth. The pellet obtained after centrifugation at 2000× g for 5 min and 4◦C was suspended in 2 ml of the same medium and layered on 40% Percoll (v/v) in the same medium without BSA. The pellet with intact chloroplasts, ob-tained after centrifugation of the Percoll-containing tubes at 4000 × g for 10 min and 4 ◦C, was re-suspended in a suspension medium containing 330 mM sorbitol, 5 mM MgCl2, 1 mM MnCl2, 2 mM
EDTA and 50 mM HEPES-KOH (pH 7.5) and cent-rifuged to remove the Percoll. The obtained pellet was resuspended in 1–2 ml of the same medium. The chloroplasts were osmotically lysed by resuspension in 30 mM MgCl2for 5 min followed by the addition
of an equal volume of double strength suspension me-dium. Measurements were made at a chlorophyll (Chl) concentration of 40–45 µg Chl ml−1. The chlorophyll concentration was measured according to the method of Arnon (1949).
Chlorophyll fluorescence measurements
Chlorophyll a fluorescence transients were measured at room temperature using a PEA-fluorometer (PEA, Hansatech, King’s Lynn, Norfolk, UK) as described elsewhere (Strasser et al. 1995; Srivastava et al. 1995). The excitation light, of an intensity of 600 W m−2 where not otherwise specified, was provided by an array of six light-emitting diodes (peak at 650 nm) and focused on the surface of the sample in order to form a homogenous illumination light spot of about 4 mm in diameter. The Chl a fluorescence signal was detected using a PIN photocell after passing through
a long pass filter (50% transmission at 720 nm). In the experiments with chloroplasts the measurements were performed on 500 µl aliquots of chloroplast sus-pension (40–45 µg Chl ml−1) in 1 cm diameter vials. The optical thickness of the sample was 5 mm and the diameter of the irradiated sample area was 4 mm. The Chl a fluorescence signals were recorded in a time span from 10 µs to 4 min at a 12 bit resolution with a data acquisition rate of 10 µs for the first 2 ms, 1 ms between 2 ms and 1 s, and 100 ms thereafter. The fluorescence signal at 50 µs, being the earliest measurement free of artefacts related to the electronics of the instrument, was considered as F0. The
fluores-cence transients are plotted both on logarithmic and linear time scales. When applied, the illumination of the samples with white, blue or far-red light (3 W m−2) was provided by a Schott lamp (KL 1500; Schott Glasswerke, Mainz, Germany) equipped with a fiber optic and far-red or blue light filters (RG 730 and BG 37, Schott, Mainz, Germany). All irradiances were measured with a YSI-Kettering 65A light-meter (Yellow Springs Instrument Co.).
Anaerobiosis treatment
For the anaerobic treatment, dark-adapted intact pea leaves were placed on wet filter paper in a laborat-ory built chamber that was continually flushed with N2 gas in complete darkness. When the fluorescence
measurements were performed under anaerobic condi-tions, dark-adapted intact leaves were directly attached to the head of the PEA-fluorometer with the help of a leaf clip with the whole setup being enclosed in the chamber. The N2 gas was bubbled through
wa-ter before enwa-tering the chamber, in order to avoid desiccation of the sample. In the experiments with chloroplasts, anaerobic conditions were induced by flushing the chloroplast suspension with N2gas
fol-lowed by the addition of 10 mM glucose, 50 units ml−1glucose-oxidase and 1000 units ml−1catalase.
Results
Effect of anaerobiosis on the Chl a fluorescence transient
The changes of the shape of the Chl a fluorescence transient (from 50 µs to 240 s) induced by a 60 min incubation of a pea leaf under anaerobic conditions in the dark are depicted in Figure 1. When plotted
70
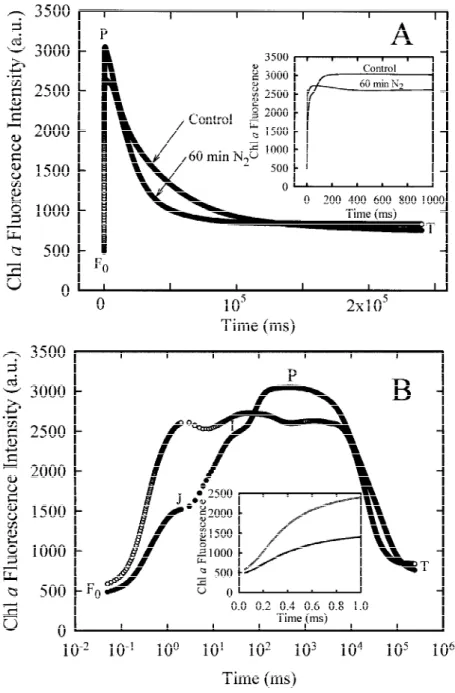
Figure 1. The Chl a fluorescence transients of pea leaves that were either kept in the air in the dark ( ), or incubated for 60 min in N2gas in the dark (#). The curves are presented on a linear (A) and a logarithmic (B) time scale. The insert in (A) shows the transient during the first second of illumination. The insert in (B) shows the initial Chl a fluorescence rise (from 50 µs to 1 ms) on a linear time scale.
on a linear time scale, the Chl a fluorescence transi-ent started from an initial level F0 and increased up
to a maximum FP (peak P), which can be considered
as representing the maximum fluorescence yield FM
since the light applied (600 W m−2, peak at 650 nm) is high enough to ensure the closure of all the reac-tion centres. The fast rise was followed by a slower
decay to a terminal steady-state T (Figure 1A). The anaerobically treated leaf displayed a lower FMand a
faster decay than the control leaf. The insert in Fig-ure 1A shows the fluorescence transient during the first second of illumination. When plotted on a logar-ithmic time scale (Figure 1B), the Chl a fluorescence induction kinetic of the control leaf showed a
typ-ical polyphasic rise (Neubauer and Schreiber 1987; Schreiber and Neubauer 1987; Strasser et al. 1995; Srivastava et al. 1995) with two intermediate steps between F0 and FM, labelled as J (FJ) and I (FI)
ac-cording to the terminology of Strasser et al. (1995). The plot on a logarithmic time scale revealed that there are large differences between the control and the an-aerobically treated sample within the first second of the fluorescence rise. Incubation under anaerobic con-ditions in the dark resulted in an increased F0-level,
but the main effect was a dramatic increase in the fluorescence yield at the J-step with the result that the maximum fluorescence yield was almost achieved within 2 ms of illumination (Figure 1B). The insert in Figure 1B shows the initial fluorescence rise (from 50 µs to 1 ms) on a linear time scale. The anaerobic-ally treated leaf showed a more pronounced dip after the J-step and a lower FM than the control leaf
(Fig-ure 1A,B); however, the magnitude of these changes varied considerably from one experiment to the other when different sets of plants were used. It is important to note that the anaerobiosis-dependent changes of the fluorescence transient above described cannot be at-tributed to a lack of CO2, since we obtained the same
results when the anaerobic conditions were induced by flushing the leaves with N2 gas containing 300 ppm
CO2.
Anaerobiosis-induced changes of the Chl a fluorescence rise kinetic are time-dependent
The relative variable fluorescence at any time t is defined as:
Vt= (Ft− F0)/(FM− F0).
This experimental expression is taken as a measure of the fraction of the primary quinone electron acceptor of Photosystem II (PS II) being in its reduced state [QA−] / [QA(total)] or, equivalently, of the fraction Bt
of closed RCs: Assuming no connectivity (grouping) between the PS II units, Vtis equal to Bt, while in the case of connected PS II units the relation is hyperbolic:
Vt= Bt/[1 + C(1 − Bt)]
where the hyperbola constant C is related to the overall probability for connectivity pG(C = pG.(FM− F0)/F0,
see Strasser 1978). The plot of the transients as V-curves facilitates the comparison between samples as only the dynamic accumulation of QA in its reduced
form QA− is considered. The time dependency of
the anaerobiosis-induced changes of the shape of the
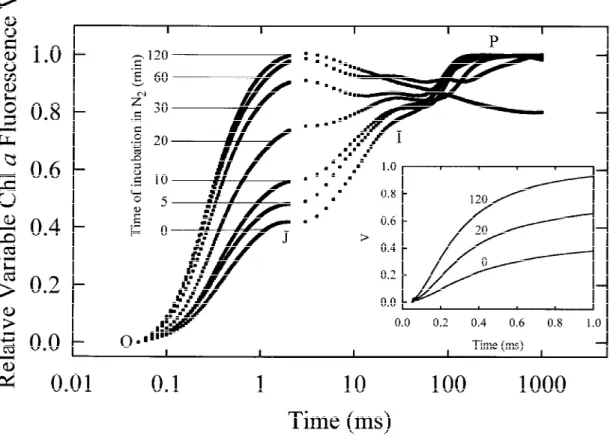
fluorescence transients, plotted as V-curves on a logar-ithmic time scale, is depicted in Figure 2. It clearly appears that, by increasing the incubation time, the rise of V was speeded up and the prominent in the control leaf I-step gradually disappeared. When the incubation time exceeded 60 min, the maximum V (=1) was generally achieved already at the J-step, with a subsequent decay. The insert in Figure 2 shows the initial fluorescence rise (from 50 µs to 1 ms) of se-lected curves on a linear time scale. Incubation under anaerobic conditions in the dark resulted in a time-dependent reduction in the maximum quantum yield of the primary photochemistry of PS II as measured by the decrease in the FV/FMratio (about 0.80 in
con-trol leaves), however with an extent which did not generally exceed the 10–20%.
Recovery from the anaerobiosis-induced changes of the Chl a fluorescence rise kinetic is time-dependent
Figure 3 shows the fluorescence transients of pea leaves that were returned to the air after having been incubated under anaerobic conditions. The transients, plotted as V-curves on a logarithmic time scale, were obtained from leaves that were incubated under anaer-obic conditions in the dark for 120 min and thereafter returned to the air in the dark for 0, 5, 15, 30, 60 and 120 min. The insert in Figure 3 shows the initial fluorescence rise (from 50 µs to 1 ms) of se-lected curves on a linear time scale. As demonstrated, the Chl a fluorescence rise kinetic recovered from the anaerobiosis-induced changes in a time-dependent fashion. Full recovery was usually achieved within 120 min in the air. However, it has to be emphas-ised that the time needed to achieve full recovery can vary tremendously; in some experiments, recov-ery was completed within a few minutes. It is most probable that these variations are due to the fact that the experiments were carried out over several months including different seasons and, therefore, the plants were grown under different climatic conditions in the greenhouse. The FV/FM ratio recovered almost
fully from the anerobiosis-induced reduction when the leaves were returned to the air in the dark (data not shown), following the recovery of the shape of the O-J-I-P transient.
Effect of sodium dithionite and DCMU on the Chl a fluorescence rise kinetic
When pea leaves were treated with 25 mM of the strong reductant sodium dithionite in the dark, the
72
Figure 2. The rise kinetic of the relative variable Chl a fluorescence Vt= (Ft− F0)/(FM− F0) in pea leaves incubated under anaerobic conditions in the dark for different times. The insert shows the initial rise of Vt(from 50 µs to 1 ms) of selected curves on a linear time scale.
shape of the Chl a fluorescence rise kinetics changed with the prolongation of the incubation time in a fash-ion comparable to that observed in leaves incubated under anaerobic conditions, with the main effect being again a dramatic increase in the fluorescence yield at the J-step associated with a speeding up of the initial fluorescence rise (Figure 4). Furthermore, the treat-ment with sodium dithionite resulted in an increased F0-level (data not shown). It is well established that
DCMU blocks the electron transport beyond QA by
displacing QBat the binding site of the D1 protein of
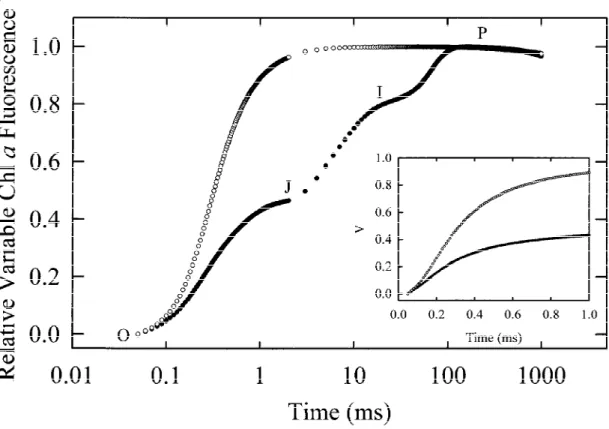
the reaction centre of PS II (Trebst 1991; Oettmeier 1992). We took advantage of this fact to show how the shape of the fluorescence transient looks like when the PS II acceptor side is totally blocked. As found in an earlier study (Strasser et al. 1995), a treatment with DCMU results in a fast rise of the Chl a fluorescence yield from F0to FP(= FM), where J = I = P (Figure 5).
The insert in Figure 5 shows the initial fluorescence rise (from 50 µs to 1 ms) on a linear time scale.
The Chl a fluorescence rise transients recorded during two consecutive illuminations
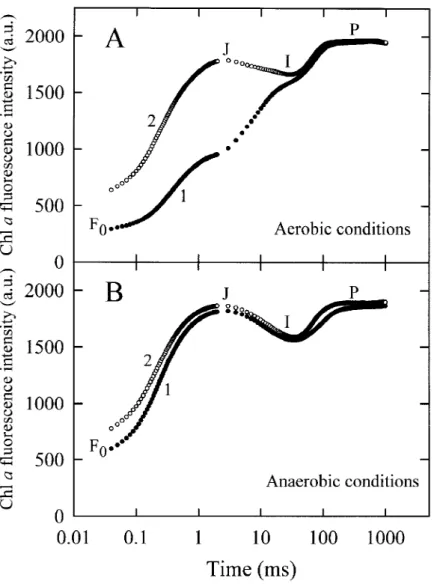
The Chl a fluorescence rise transients were recorded during two consecutive illuminations of a 1 s duration, with a dark interval of 10 s between them. The two transients (denoted as 1st and 2nd hit, see Strasser and Tsimilli-Michael 1998) are depicted in Figure 6, both for a leaf kept in the air in the dark (control) and an anaerobically treated leaf (60 min in N2). In
the control leaf (Figure 6A), the 2nd hit is almost identical with the 1st hit of the anaerobically treated leaf (Figure 6B), with the same dramatic increase of the fluorescence yield at the J-step. Moreover, they are both characterised by an increased F0-level compared
to the 1st hit of the control leaf and the appearance of a significant dip after the J-step. In the anaerobically treated sample the 2nd hit exhibits the same shape as the 1st hit, however with a further increased F0-level
and a somewhat increased fluorescence yield in the F0
Figure 3. The rise kinetic of the relative variable Chl a fluorescence Vt= (Ft− F0)/(FM− F0) in pea leaves that were returned to the air in the dark for different times after having been incubated under anaerobic conditions in the dark for 120 min. The first transient from the bottom was obtained from a leaf kept in the air in the dark. The insert shows the initial rise of Vt(from 50 µs to 1 ms) of selected curves on a linear time scale.
The Chl a fluorescence rise transients recorded at different excitation light intensities
The appearance of the intermediate steps J and I, as well as the time at which they appear in the O-J-I-P fluorescence rise, have been reported to be dependent on the intensity of excitation light, the two steps being barely visible at low light intensities, if at all (Strasser et al. 1995). We made the same observation in pea leaves kept in the air in the dark (data not shown). On the contrary, in anaerobically treated leaves (60 min in N2), the fluorescence transients retained the
same shape at all light intensities selected in the range between 60 and 600 Wm−2, with the fluorescence yield at the J-step being dramatically increased and close to the maximum fluorescence yield FP(data not
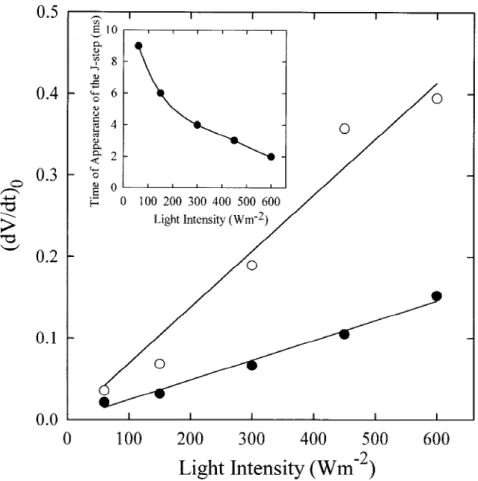
shown). However, as shown in the insert of Figure 7, the time of appearance of the J-step, determined by the point of the curve where the slope becomes min-imal (here equal to zero), was found to depend on the intensity of excitation light.
The initial slope of the relative variable fluor-escence, denoted as (dV/dt)0 and approximated by
1V/1t between 50 and 300 µs, has been proposed as a
measure of the corresponding initial rate (1B/1t)0of
the accumulation of closed RCs (see e.g. Strasser et al. 1995). In the case of connected units, (dV/dt)0is not
equal but only proportional to (1B/1t)0, the
propor-tionality factor depending on the hyperbola constant C (see above). However, since we deal here with meas-urements conducted on the same biological material and after treatments that are not expected to alter the C constant, (dV/dt)0can be reasonably used to compare
the samples in respect to the net QA−initial increase
(difference between the QA reduction rate and the
QA− reoxidation rate). Figure 7 demonstrates that in
control leaves, (dV/dt)0 is proportional to the
excita-tion light intensity, as it has already been reported and proposed as an evidence for the photochemical charac-ter of the O-J phase (Strasser et al. 1995). Moreover, we show here (Figure 7) that the proportionality is also valid for anaerobically treated leaves, however with
74
Figure 4. The rise kinetic of the relative variable Chl a fluorescence Vt= (Ft− F0)/(FM− F0) in pea leaves infiltrated with sodium dithionite for different times. Infiltration was achieved by the incubation of intact leaves between filter paper in the dark in a buffer containing 25 mM sodium dithionite, 100 mM sorbitol, 50 mM HEPES, 0.5 mM CaCl2and 0.5 mM MnSO4(pH 7.5). The insert shows the initial rise of Vt(from 50 µs to 1 ms) of selected curves on a linear time scale.
a much higher (more than 2.5 times) proportionality factor.
Effect of illumination with far-red light following the anaerobic treatment
The Chl a fluorescence rise curve can be character-ised quantitatively by the following expressions: 1. FV/FM, the maximum quantum yield of the primary
photochemistry of PS II; 2. VI, the relative variable
fluorescence at the I-step; 3. VJ, the relative variable
fluorescence at the J-step, and 4. (dV/dt)0, the initial
slope of the relative variable fluorescence. In Figure 8, we use these expressions to compare the fluorescence transients after illumination of anaerobically treated leaves with 2 min of white, blue and far-red light (3 W m−2). Figure 8 demonstrates that the decrease in the FV/FMratio and the increases in VI, VJ, and (dV/dt)0
induced by a 60 min incubation under anaerobic con-ditions in the dark were reversed by illuminating the sample with far-red light, but not with blue or white
light, even if the illumination was further prolonged. The illumination with far-red light of a control pea leaf kept in the air in the dark had only minor effects on the FV/FMratio and VI, but induced a decrease in
VJ and (dV/dt)0. It is noteworthy that, in a leaf
in-cubated under anaerobic conditions for 60 min, a 5 – 10 s illumination with far-red light was sufficient to induce full recovery, whereas in a leaf that had been exposed to anaerobiosis for 120 min, an illumination with far-red light of more than 2 min was necessary to obtain the same effect (data not shown). Furthermore, when after the illumination with far-red light a leaf was maintained under anaerobic conditions in the dark for an additional period of about 10 minutes, the fluor-escence transient showed again the typical shape of an anaerobically treated leaf (data not shown). These findings support the proposition by Harris and Heber (1993) that the incubation under anaerobic conditions leads to the accumulation of some reductant(s) that can interact with PQ, indicating also that the pool of
Figure 5. The rise kinetic of the relative variable Chl a fluorescence Vt= (Ft− F0)/(FM− F0) in control ( ) and DCMU treated pea leaves (#). Infiltration with DCMU was achieved by the incubation of leaves between filter paper in the dark in a buffer containing 200 µM DCMU, 100 mM sorbitol, 50 mM HEPES, 0.5 mM CaCl2and 0.5 mM MnSO4(pH 7.5). Control leaves were incubated in the same buffer without DCMU. The incubation time was 4 h. The insert shows the initial rise of Vt(from 50 µs to 1 ms) on a linear time scale.
the reductant could not be depleted by the short-term far-red light treatment. There are still some doubts concerning the nature of the electron donors respons-ible for the non-photochemical PQ reduction, though it has been demonstrated that the reduced pyridine nuc-leotides NADH and NADPH can reduce PQ in vitro (Mills et al. 1979; Endo et al. 1997; Corneille et al. 1998).
Effect of anaerobiosis in broken chloroplasts
The Chl a fluorescence transients of osmotically broken pea chloroplasts incubated under different con-ditions in the dark are depicted in Figure 9. The control samples showed a Chl a fluorescence rise kinetic with an O-J-I-P pattern, but very often the I-step was not clearly apparent, if at all. Virtually the same fluorescence transient was obtained when the chloroplast suspension was made anaerobic us-ing the glucose/glucose-oxidase/catalase system even
after an incubation time of 60 min. It thus appears that anaerobiosis is not sufficient to maintain PQ in a re-duced state if a pool of reductants cannot be formed or is not available, as it is indeed the case in broken chloroplasts. We therefore supplied the chloroplast suspension by such a pool, choosing NADPH and NADH which, as above mentioned, were reported to reduce PQ in vitro. However, under aerobic condi-tions, the addition of 250 µM NADPH or NADH to the medium did usually not change the characteristics of the fluorescence transient (Figures 9 and 10). In-creasing the concentrations of NADPH or NADH up to 4 mM did usually not further modify the fluores-cence transient (data not shown). However, the shape of the Chl a fluorescence rise kinetic changed dramat-ically when the chloroplast suspension was incubated under anaerobic conditions in a medium to which 250 µM NADPH (Figure 9) or NADH (data not shown) had been added. Here, the fluorescence transient of the chloroplasts displayed a shape similar to that observed
76
Figure 6. The Chl a fluorescence rise kinetics of dark-adapted pea leaves recorded during two consecutive illuminations of a 1 s duration with
a 10 s dark interval between the first (1) and second illumination (2). The measurements were carried out (A) under aerobic conditions (on a leaf that had been kept in the air in the dark) and (B) under anaerobic conditions (on a leaf that had been incubation for 60 min in N2gas in the dark).
in intact pea leaves that had been incubated under anaerobic conditions for a longer time, exhibiting an increase of both the F0and the FJfluorescence yields.
In general, the F0increase was more pronounced than
in intact leaves. The insert in Figure 9 shows the initial fluorescence rise (from 50 µs to 1 ms) on a linear time scale.
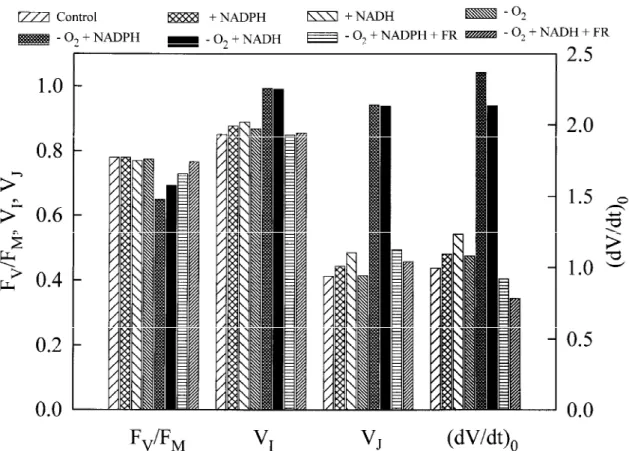
The full comparison of the several expressions quantifying the fluorescence transients under aerobic and anaerobic conditions, with and without NADPH or NADH, is presented in Figure 10. It is clearly demonstrated that the incubation under anaerobic
con-ditions without the addition of reduced pyridine nuc-leotides had only minor, if any, effects on the fluor-escence transient. Likewise, the addition of reduced pyridine nucleotides under aerobic conditions barely changed the FV/FM ratio and VI, but induced some
increase in VJand (dV/dt)0particularly when reduced
pyridine nucleotide was added to the medium in the form of NADH. On the other hand, Figure 10 shows that the incubation under anaerobic conditions in the dark of a chloroplast suspension to which either 250 µM NADPH or NADH had been added resulted in a 17% reduction in the FV/FM ratio, an increase in
Figure 7. The effect of different intensities of excitation light on the initial slope of the relative variable Chl a fluorescence, approximated
as (dV/dt)0= (F300µs− F50µs)/(FM − F0). The measurements were carried out both under aerobic ( ) and anaerobic conditions (#), as described in the legend of Figure 6. The insert shows the time of appearance of the J-step in the fluorescence curve as a function of the intensity of excitation light, in leaves that had been incubated for 60 min under anaerobic conditions in the dark.
VI, but especially in a significant increase in VJ and
(dV/dt)0. As in the case of intact leaves, these effects
of anaerobiosis on the fluorescence transient were can-celled when, prior to the fluorescence measurements, the samples were illuminated for 5 s with far-red light, but only in presence of the electron acceptor methyl viologen (Figure 10). In the absence of methyl violo-gen, pre-illumination with far-red light was much less effective, if at all, in reversing the above described changes of the fluorescence curve (data not shown).
Discussion
The incubation of pea leaves under anaerobic con-ditions in the dark dramatically modified the Chl a fluorescence rise kinetic with the changes becoming especially apparent when the fluorescence curves were plotted on a logarithmic time scale (Figure 1). In pea
leaves, differences between the control and the an-aerobically treated sample already appeared in the µs time range of the fluorescence transient (Figure 1B), whereas in spinach leaves, as reported by Harris and Heber (1993), the fast recording of the fluorescence rise in the ms time range did not reveal any kinetic differences between the control and the anaerobically treated sample. It is possible that different plant spe-cies respond differentially to an anaerobic treatment in the dark.
The result that the shape of the Chl a fluorescence transient changed in time when the leaves were incub-ated under anaerobic conditions, the main effect being a gradual increase of the fluorescence yield at the J-step (Figure 2), shows that the accumulation of QA−
is strongly enhanced and thus suggests that anaero-biosis results in a gradual reduction of the electron transport rate after QA. It is most probable that this
78
Figure 8. The effect of the illumination of anaerobically treated in the dark pea leaves with blue, white or far-red light on the following
expressions characterising the fluorescence transients: the FV/FMratio which is a measure of the maximum quantum yield of the primary photochemistry of PS II; the relative variable fluorescence at the intermediate steps I (at 30 ms) and J (at 2ms), denoted as VI and VJ, respectively; the initial slope of the relative variable fluorescence (dV/dt)0. The fluorescence curves were obtained from leaves that were: (1) kept in the air in the dark (control); (2) as in (1) but with a 2 min illumination with far-red light (3 W m−2) with a subsequent 1 min dark period (control + FR) prior to the measurement; (3) incubated under anaerobic conditions in the dark for 60 min (60 min N2); (4) as in (3) but with a 2 min illumination with blue light (3 W m−2) with a subsequent 1 min dark period (60 min N2+ BL) prior to the measurement; (5) as in (4) but with an illumination with white light (60 min N2+ WL); (6) as in (4) but with an illumination with far-red light (60 min N2+ FR).
occurs because under anaerobic conditions the redox components of the photosynthetic electron transport chain progressively accumulate in their reduced form already in the dark. This view is supported by the fact that leaves infiltrated with the strong reductant sodium dithionite exhibited a fluorescence rise kinetic (Fig-ure 4) comparable to that observed in anaerobically treated leaves (Figures 1 and 2). Additional evidence for this hypothesis is provided by the finding that the 2nd hit in the control leaves (Figure 6A), i.e. the transient recorded when the electron carriers in the in-tersystem chain had accumulated in their reduced form due to the 1st hit, behaves in the same way as the 1st hit in the anaerobically treated leaves (Figure 6B).
Normally, the secondary quinone electron acceptor QB is reduced by QA− twice and leaves the
reac-tion centre complex of PS II as PQH2. Thereafter,
PQH2is reoxidised by the cytochrome b6/f complex
and oxidised PQ re-enters the intact reaction centre complex on the electron acceptor side reforming QB.
As it will be analysed below, our results strongly sug-gest that incubation under anaerobic conditions in the dark results in a time-dependent accumulation of re-duced PQ. The finding that the fluorescence yield at F0was increased under anaerobic conditions (Figures
1, 6 and 9) support this view, as an equilibrium is known to exist between the redox states of PQ and QA
(Diner 1977; Joliot et al. 1992). Remarkably, in intact leaves, the anaerobiosis-induced increase in F0 was
often more pronounced than that shown in Figure 1; in some cases (see for example Figure 6) it even reached the extent observed in broken chloroplats incubated under anaerobic conditions in a medium containing NADPH (Figure 9). The finding that after about 60
Figure 9. The Chl a fluorescence rise kinetics of osmotically broken pea chloroplasts that were incubated for 60 min at room temperature in
the dark: (a) in the normal suspension medium containing 10 mM glucose and 1000 units ml−1catalase, (b) in the same medium that was made anaerobic by the addition of 50 units ml−1glucose-oxidase, (c) in the same medium but with the addition of 250 µM NADPH, and (d) in the same medium to which 250 µM NADPH were added and that was made anaerobic by the addition of 50 units ml−1glucose-oxidase. The chlorophyll concentration was 40–45 µg Chl ml−1. The insert shows the initial Chl a fluorescence rise of F/FM(from 50 µs to 1 ms) on a linear time scale.
min of the anaerobic treatment, the fluorescence tran-sient attained a shape (Figure 2) comparable to that displayed by DCMU-poisoned leaves, where the max-imum fluorescence yield is achieved at the J-step due to a blockage of the electron transport beyond QA
(Figure 5), provides additional evidence that incuba-tion under anaerobic condiincuba-tions results in a reducincuba-tion of the electron transport rate at the PS II acceptor side. However, it has to be emphasised that, contrary to the case of anaerobic conditions, the fluorescence rise curve in presence of DCMU is characterised by the ab-sence of the J-I-P phase, due to the complete blockage of electron transport after QA(Figure 5).
The finding that the proportionality factor between the initial slope of the relative variable fluorescence (dV/dt)0 and the excitation light intensity is much
higher after the anaerobiosis treatment (Figure 7) provides a strong evidence that anaerobiosis results in a reduction in the rate of QA−reoxidation. Moreover,
the result that the typical anaerobiosis-induced in-crease of the fluorescence yield at J-step appears at all light intensities, while the time of appearance of the J-step depends on the light intensity (see insert of Figure 7) is again in agreement with an anaerobiosis-dependent reduction of the QA−reoxidation rate.
It has been proposed that the I to P rise reflects the reduction of PQ which results to the elimination of a static fluorescence quenching originating from oxidised PQ (Vernotte et al. 1979; Strasser et al. 1995). If so, one would expect that in an anaerobic-ally treated leaf comprising reduced PQ, the maximum fluorescence yield FM, achieved at the J-step, would
correspond to the FMof the control leaf which, under
saturating light, levels off in about 200 ms (Strasser et al. 1995). It was, therefore, rather surprising to observe that the maximum fluorescence yield FMwas
lower in the anaerobically treated sample than in the control sample (Figure 1).
80
Figure 10. The selected expressions characterising the fluorescence rise kinetic (see legend of Figure 6), calculated from the fluorescence
transients obtained from osmotically broken pea chloroplasts that were incubated for 60 min in the dark: (1) in the normal suspension medium containing 10 mM glucose and 1000 units ml−1catalase (control); (2) and (3) in the same medium to which 250 µM NADPH (+ NADPH) or NADH (+ NADH) had been added; (4) in the same medium that was made anaerobic by the addition of 50 units ml−1glucose-oxidase (-O2); (5) and (6) in the same medium that was made anaerobic by the addition of 50 units ml−1glucose-oxidase and to which 250 µM NADPH (-O2 + NADPH) or NADH (-O2+ NADH) had been added, and (7) and (8) as in (5) and (6) but in the presence of 100 µM methyl viologen and with a 5 s illumination with far-red light (3 W m−2) followed by a 5 – 10 s dark period prior to the measurement [(-O2+ NADPH + FR) and (-O2+ NADH + FR)]. The chlorophyll concentration was 40–45 µg Chl ml−1.
The Chl a fluorescence rise kinetic recovered from the anaerobiosis-induced changes in a time-dependent fashion when, following the anaerobic treatment, the leaves were returned to the air in the dark (Fig-ure 3). This result shows that upon return to the air, the reactions that led to the observed anaerobiosis-dependent changes were eventually reversed. Harris and Heber (1993) have also reported on O2-dependent
fluorescence relaxation in anaerobically treated spin-ach leaves and considered them as indicating that O2
is an obligatory component of PQ reoxidation in the dark. The anaerobiosis-induced changes of the fluores-cence transient could also be reversed by a short-term illumination with far-red light, which excites prefer-entially PS I and thereby reoxidises the intersystem electron transport chain (Figure 8). The illumination with blue light, preferentially exciting PS II, or with
white light exciting both Photosystems was ineffective in restoring the original O-J-I-P pattern of the fluores-cence rise in anaerobically treated leaves (Figure 8). These results provide additional evidence that the ob-served changes of the fluorescence transient are related with the accumulation of reduced PQ in the dark.
The accumulation of reduced PQ under anaerobic conditions can be caused by an enhancement of the non-photochemical PQ reduction and/or by a limita-tion of the capacity to reoxidise reduced PQ due to the absence of O2. Our results, as it will be discussed
below, provide strong evidence for the participation of both mechanisms.
In the absence of O2, mitochondrial respiration is
blocked and it is likely that under such conditions, the redox components of the cytosol accumulate in their reduced form. As the chloroplasts stroma and
the cytosol are linked by metabolite shuttles (Flügge and Heldt 1991), it is most probable that there ex-ists an influx of reducing equivalents from the cytosol to the chloroplast stroma, as proposed in an earlier study (Garab et al. 1989). The finding that intact spinach chloroplasts incubated under anaerobic con-ditions in the dark did not show non-photochemical PQ reduction (Harris and Heber 1993) supports this view. Evidence for the accumulation of a reductant that can interact with PQ is given by our finding that a leaf maintained under anaerobic conditions in the dark after being illuminated with far-red light displayed again a fluorescence transient with a shape typical of an anaerobically treated leaf (data not shown).
In broken pea chloroplasts anaerobiosis did not in-duce any modifications of the fluorescence rise kinetic (Figures 9 and 10), indicating that the lack of O2is not
sufficient to maintain PQ in a reduced state if it is not associated with a delivery of reductants to the chloro-plasts, probably from the cytosol as above speculated. Indeed, when this delivery was substituted by adding reduced pyridine nucleotides (NADH or NADPH) in the suspension medium, the chloroplasts displayed upon the anaerobic treatment a Chl a fluorescence rise kinetic comparable to that observed in anaerobically treated leaves (Figures 9 and 10). On the other hand, our results show clearly that the addition of NADH and NADPH is not enough to maintain the PQ pool in its reduced form in the presence of O2, as their
presence under aerobic conditions did not modify the typical O-J-I-P pattern of the fluorescence rise kin-etic (Figures 9 and 10). Similarly to the case of intact leaves (Figure 8), the reoxidation of PQ was succeeded by the illumination of the anaerobically (plus NADH or NADPH) treated chloroplasts with far-red light, as revealed by the recovery of the fluorescence transient characteristics (Figure 10).
From the above analysis it seems very likely that under normal conditions, the redox state of PQ in the dark is regulated by the PQ reduction via a NAD(P)H– PQ-oxidoreductase and the PQ reoxidation by an O2-dependent pathway, perhaps a chloroplast oxidase
as proposed in the model of chlororespiration (see ‘Introduction’ section).
Seemingly, contradictory observations have been reported concerning the polyphasic rise kinetic of Chl
a fluorescence. On the one hand, the fluorescence
yield at the I1(J) step showed a saturation behaviour
with increasing light intensity and decreasing temper-ature (Neubauer and Schreiber 1987), suggesting that QAreduction is maximal at this step of the transient.
On the other hand, DCMU-type inhibitors raised the fluorescence yield at the I1(J) step to that normally
observed at the I2 (I) step (Neubauer and Schreiber
1987; Strasser et al. 1995), which is indicative of a rapid, DCMU-sensitive pathway for QA−reoxidation.
The fluorescence yield at the I1 (J) step and/or the
suppression of the fluorescence rise from I1(J) to I2(I)
have been shown to be influenced by treatments affect-ing components of the donor side of PS II (Schreiber and Neubauer 1987; Guissé et al. 1995; Srivastava et al. 1997). The common feature of different pro-posed mechanisms is that the quenching at the first intermediate step (I1 or J) is caused by a limitation
of the electron donation rate to P680+(Schreiber and Neubauer 1987).
In the present study, we observed that the fluor-escence yield at the J-step increased dramatically in response to an incubation of the leaves under anaer-obic conditions (Figures 1 and 2), to a treatment of the leaves with dithionite (Figure 4), to a preillumin-ation flash (Figure 6) and to an incubpreillumin-ation of broken chloroplasts under anaerobic conditions in a medium containing reduced pyridine nucleotides (Figures 9 and 10). Our results do not exclude the possibility that the J-level might be affected by the donor side, as it can be assumed that the different used reducing conditions increase the fluorescence yield at the J-step by preventing the P680+accumulation. However, as discussed above, our results provide strong arguments that the fluorescence yield at the J-step is predomin-antly, controlled by the rate of QA− reoxidation at
the PS II acceptor side. Moreover, the finding that the anaerobiosis-induced increase in the fluorescence yield at the J-step can be cancelled by the illumina-tion of the samples with far-red light (Figures 8 and 10), together with the observation that in dark-adapted control leaves the fluorescence yield at the J-step is reduced following an illumination with far-red light (Figure 8), suggests that the fluorescence yield at the J-step is strongly determined by the redox state of the electron carriers in the intersystem chain.
The obtained results provide additional evidence for the existence of a chlororespiratory pathway in higher plant cells and suggest that the fluorescence yield at the J-step of the transient previously proposed to be controlled by the PS II donor side (Schreiber and Neubauer 1987), is also, if not predominantly determ-ined, by the redox state of the electron carriers at the PS II acceptor side. They also show that the polyphasic Chl a fluorescence rise can provide information con-cerning the redox state of the photosynthetic electron
82
transport chain and can, therefore, be used to monitor changes of this state caused by various treatments of the photosynthetic samples.
Acknowledgement
We thank Dr M. Tsimilli-Michael for stimulating dis-cussion and helpful comments and suggestions during the preparation of the manuscript.
References
Arnon DI (1949) Copper enzymes in isolated chloroplasts. Poly-phenoloxidase in Beta vulgaris. Plant Physiol 24: 1–15 Asada K, Heber U and Schreiber U (1993) Electron flow to the
inter-system chain from stromal components and cyclic electron flow in maize chloroplasts, as detected in intact leaves by monitoring redox change of P700 and chlorophyll fluorescence. Plant Cell Physiol 34: 39–50
Bennoun P (1982) Evidence for a respiratory chain in the chloro-plast. Proc Natl Acad Sci USA 79: 4352–4356
Büchel C and Garab G (1997) Respiratory regulation of electron transport in chloroplasts: chlororespiration. In Pessarakli M (ed) Handbook of Photosynthesis, pp 83–93. Marcel Dekker, New York
Burrows PA, Sazanov LA, Svab Z, Maliga P and Nixon PJ (1998) Identification of a functional respiratory complex in chloroplasts through analysis of tobacco mutants containing disrupted plastid
ndh genes. EMBO J 17: 868–76
Corneille S, Cournac L, Guedeney G, Havaux M and Peltier G (1998) Reduction of the plastoquinone pool by exogenous NADH and NADPH in higher plant chloroplasts. Character-ization of a NAD(P)H–plastoquinone oxidoreductase activity. Biochim Biophys Acta 1363: 59–69
Dau H (1994) Molecular mechanism and quantitative models of variable Photosystem II fluorescence. Photochem Photobiol 60: 1–23
Diner B (1977) Dependence of the deactivation reactions of Pho-tosystem II on the redox state of plastoquinone pool A varied under anaerobic conditions. Equilibrium on the acceptor side of Photosystem II. Biochim Biophys Acta 466: 247–258
Endo T, Mi H, Shikanai T and Asada K (1997) Donation of electrons to plastoquinone by NAD(P)H dehydrogenase and ferredoxin-quinone reductase in spinach chloroplasts. Pant Cell Physiol 38: 1272–1277
Feild TS, Nedbal L and Ort D (1998) Nonphotochemical reduction of the plastoquinone pool in sunflower leaves originates from chlororespiration. Plant Physiol 116: 1209–1218
Flügge U-I and Heldt HW (1991) Metabolite translocators of the chloroplast envelope. Ann Rev Plant Physiol Plant Mol Biol 42: 129–144
Garab G, Lajkó F, Mustárdy L and Márton L (1989) Respiratory control over photosynthetic electron transport in chloroplasts of higher-plant cells: Evidence for chlororespiration. Planta 179: 349–358
Govindjee (1995) Sixty-three years since Kautsky: chlorophyll a fluorescence. Aust J Plant Physiol 22: 131–160
Groom QJ, Kramer DM, Crofts A and Ort D (1993) The non-photochemical reduction of plastoquinone in leaves. Photosynth Res 36: 205–215
Guissé B, Srivastava A and Strasser RJ (1995) Effect of high temperature and water stress on the polyphasic chlorophyll a fluorescence transient of potato leaves. In: Mathis P (ed) Pho-tosynthesis: From Light to the Biosphere, Vol IV, pp 913–916. Kluwer Academic Publishers, Dordrecht, The Netherlands Harris GC and Heber U (1993) Effects of anaerobiosis on
chloro-phyll fluorescence yield in spinach (Spinacia oleracea) leaf discs. Plant Physiol 101: 1169–1173
Joliot P, Lavergne J and Béal D (1992) Plastoquinone compartment-ation in chloroplasts. I. Evidence for domains with different rates of photo-reduction. Biochim Biophys Acta 1101: 1–12 Kaulsky H and Hirsch A (1931) Neue Versuche zur
Kohlensäuere-assimilation. Naturwissenshaften 48: 964
Karukstis KK (1991) Cholorophyll fluorescence as a physiolo-gical probe of the photosynthetic apparatus. In: Scheer H (ed) Chlorophyll, pp 769–795. CRC Press, Boca Raton, FL Kofer W, Koop HU, Wanner G and Steinmuller K (1998)
Muta-genesis of the genes encoding subunits A, C, H, I, J and K of the plastid NAD(P)H–plastoquinone-oxidoreductase in tobacco by polyethylene glycol-mediated plastome transformation. Mol Gen Genet 258: 166–173
Krause GH and Weis E (1991) Chlorophyll fluorescence and photo-synthesis: the basics. Ann Rev Plant Physiol Plant Mol Biol 42: 313–349
Mills JD, Crowther D, Slovacek RE, Hind G and McCarty RE (1979) Electron transport pathways in spinach chloroplasts. Reduction of the primary acceptor of Photosystem II by re-duced nicotinamide adenine dinucleotide phosphate in the dark. Biochim Biophys Acta 547: 127–137
Neubauer C and Schreiber U (1987) The polyphasic rise of chloro-phyll fluorescence upon onset of strong continuous illumination: I. Saturation characteristics and partial control by Photosystem II acceptor side. Z Naturforsch 42c: 1246–1254
Oettmeier W (1992) Herbicides of Photosystem II. Topics in Photo-synthesis 11: 349–408
Peltier G, Ravenel J and Verméglio A (1987) Inhibition of a res-piratory activity by short saturating flashes in Chlamydomonas: evidence for a chlororespiration. Biochim Biophys Acta 893: 83–90
Ravenel J and Peltier G (1992) Stimulation of the chlororespirat-ory electron flow by photosystem II activity in Chlamydomonas
reinhardtii. Biochim Biophys Acta 1101: 57–63
Sazanov LA, Burrows PA and Nixon PJ (1998a) The chloroplast Ndh complex mediates the dark reduction of the plastoquinone pool in response to heat stress in tobacco leaves. FEBS Lett 429: 115–118
Sazanov LA, Burrows PA and Nixon PJ (1998b) The plastid ndh genes code for an NADH-specific dehydrogenase: isolation of a complex I analogue from pea thylakoid membranes. Proc Natl Acad Sci USA 95: 1319–1324
Scherer S (1990) Do photosynthetic and respiratory electron trans-port chains share redox proteins? TIBS 15: 458–462
Schreiber U and Bilger W (1993) Progress in chlorophyll fluor-escence research: major developments during the past years in retrospect. Progress in Botany 54: 151–173
Schreiber U and Neubauer C (1987) The polyphasic rise of chloro-phyll fluorescence upon onset of strong continuous illumination: II Partial control by Photosystem II donor side and possible ways of interpretation. Z Naturforsch 42c: 1255–1264
Singh KK, Chen C and Gibbs M (1992) Characterization of an elec-tron transport pathway associated with glucose and fructose res-piration in the intact chloroplasts of Chlamydomonas reinhardtii and spinach. Plant Physiol 100: 327–333
Shinozaki K, Ohme M, Tanaka M, Wakasugi T, Hayashida N, Matsubayashi T, Zaita N, Chunwongse J, Obokata J, Yamaguchi-Shinozaki K, Ohto C, Torozawa K, Meng BY, Sugita M, Deno H, Kamogashira T, Yamada K, Kusuda J, Takaiwa F, Kata A, Tohdoh N, Shimada H and Sugiura M (1986) The complete nuc-leotide sequence of the tobacco chloroplast genome: its gene organization and expression. EMBO J 5: 2043–2049
Srivastava A, Strasser RJ and Govindjee (1995) Polyphasic rise of chlorophyll a fluorescence in herbicide-resistant D1 mutants of
Chlamydomonas reinhardtii. Photosynth Res 43: 131–141
Srivastava A, Guissé B, Greppin H and Strasser RJ (1997) Regula-tion of antenna structure and electron transport in Photosystem II of Pisum sativum under elevated temperature probed by the fast polyphasic chlorophyll a fluorescence transient: OKJIP. Biochim Biophys Acta 1320: 95–106
Stirbet A, Govindjee, Strasser BJ and Strasser RJ (1998) Chloro-phyll a fluorescence induction in higher plants: Modelling and numerical simulation. J Theor Biol 193: 131–151
Strasser RJ (1978) The grouping model of plant photosynthesis. In: Akoyunoglou G et al. (eds) Chloroplast Development, pp 513– 524. Elsevier, Amsterdam
Strasser RJ and Govindjee (1991) The Fo and the O-J-I-P fluorescence rise in higher plants and algae. In: Argyroudi-Akoyunoglou JH (ed) Regulation of Chloroplast Biogenesis, pp 423–426. Plenum Press, New York
Strasser RJ and Govindjee (1992) On the O-J-I-P fluorescence tran-sients in leaves and D1 mutants of Chlamydomonas reinhardtii. In: Murata N (ed) Research in Photosynthesis, Vol II, pp 29–32. Kluwer Academic Publishers, Dordrecht, The Netherlands Strasser RJ, Srivastava A and Govindjee (1995) Polyphasic
chloro-phyll a fluorescence transient in plants and cyanobacteria. Pho-tochem Photobiol 61: 32–42
Strasser RJ and Tsimilli-Michael M (1998) Activity and heterogen-eity of PS II probed in vivo by the chlorophyll a fluorescence rise O-(K)-J-I-P. In: Garab G (ed) Photosynthesis: Mechanisms and Effects, Vol V, pp 4321–4324. Kluwer Academic Publishers, Dordrecht, The Netherlands
Sugiura M (1992) The chloroplast genome. Plant Mol Biol 19: 149– 168
Trebst A (1991) The molecular basis of resistance of Photosys-tem II herbicides: In: Caseley JC Cussans GW and Aktins RK (eds) Herbicides Resistance in Weeds and Crop, pp 145–164. Butterworth-Heinemann, Oxford