Francis R. Verdun Daniel Gutierrez John Paul Vader Abbas Aroua
Leonor Trinidad Alamo-Maestre François Bochud
François Gudinchet
Received: 20 July 2007 Revised: 27 February 2008 Accepted: 2 March 2008 Published online: 4 April 2008
# European Society of Radiology 2008
CT radiation dose in children: a survey
to establish age-based diagnostic reference
levels in Switzerland
Abstract This work aimed at asses-sing the doses delivered in Switzer-land to paediatric patients during computed tomography (CT) exami-nations of the brain, chest and abdo-men, and at establishing diagnostic reference levels (DRLs) for various age groups. Forms were sent to the ten centres performing CT on children, addressing the demographics, the in-dication and the scanning parameters: number of series, kilovoltage, tube
current, rotation time, reconstruction slice thickness and pitch, volume CT dose index (CTDIvol) and dose length
product (DLP). Per age group, the proposed DRLs for brain, chest and abdomen are, respectively, in terms of CTDIvol: 20, 30, 40, 60 mGy; 5, 8, 10,
12 mGy; 7, 9, 13, 16 mGy; and in terms of DLP: 270, 420, 560, 1,000 mGy cm; 110, 200, 220, 460 mGy cm; 130, 300, 380, 500 mGy cm. An optimisation process should be initiated to reduce the spread in dose recorded in this study. A major element of this process should be the use of DRLs.
Keywords Computed tomography . Paediatrics . Radiation dosimetry . Radiation protection .
Diagnostic reference levels
Introduction
Since its first applications in the early 1970s the use of computed tomography (CT) has been continuously growing. According to the 2000 report [1] of the United Nations Scientific Committee on the Effects of Atomic Radiation (UNSCEAR), the frequency of CT examina-tions in countries of high healthcare level increased on average from 6.1 per year per 1,000 population in the 1970s to 48 per year per 1,000 population in the period 1991-1996, while the average effective dose per CT examination increased from 1.3 mSv in the 1970s to 8.8 mSv in the period 1991-1996. This increase went on steadily during the last decade. In Switzerland, the results of the 2003 survey on the exposure of the population by
medical X-ray imaging [2] indicated a 70% increase of CT examinations in a 5-year period (1998-2003), which, combined with a 20% increase in the average effective dose per CT procedure, led to an increase by a factor of two in the CT contribution to the collective dose due to medical X-rays reaching 47%. The same trend was registered in other European countries. In Norway, the frequency of CT examinations increased by a factor of 2.2 in a decade and CT contribution to collective effective dose was estimated to account for 59% of the total, as opposed to 30% in the previous survey [3]. In Germany, the increase in the collective dose due to CT rose by about 50% between 1996 and 2002, and in the UK the frequency of CT examinations increased by 39% between 1998 and 2002.
F. R. Verdun (*) . D. Gutierrez . A. Aroua . F. Bochud
University Institute for Radiation Physics (IRA–DUMSC),
CHUV and University of Lausanne, Grand-Pré 1, 1007 Lausanne, Switzerland e-mail: Francis.Verdun@chuv.ch Tel.: +41-21-6233434 Fax: +41-21-6233435 J. P. Vader
University Institute of Social and Preventive Medicine (IUMSP–DUMSC),
CHUV and University of Lausanne, Bugnon 17,
1005 Lausanne, Switzerland
L. T. Alamo-Maestre . F. Gudinchet University Hospital of Lausanne (CHUV), Department of Radiodiagnostic
and Interventional Radiology, CHUV and University of Lausanne, 1011 Lausanne, Switzerland
The proportion of all CT examinations which are performed in children does not exceed a few per cent. In Switzerland, the most recent nationwide survey on the exposure of the population by diagnostic and interventional radiology that provided patient age data indicated a CT paediatric fraction of 1% in 1998 [4,5]. The same figure was reported in Germany for the period 2005-2006 [6]. Other countries reported higher values. Recent surveys covering the year 2000 revealed a paediatric fraction of 2.7% in Japan [7], and of 6.5% in the USA [8]. The latter figure is comparable with that given by UNSCEAR for the period 1991-1996 [1]. Only general guidelines are available for the use of CT in the paediatric population [9-13] and the need for size-based CT protocols has only recently been emphasised [6, 14-18]. Given the recent attention to radiation risks and CT in children [19-24] there is an urgent need for optimisation of the present practice by means of the introduction of the Diagnostic Reference Level (DRL) by the International Commission on Radio-logical Protection (ICRP) in 1997 [25]. For these reasons, we sought to assess the practice of paediatric CT in Switzerland using forms sent to the ten main centres (including regional and university hospitals) that perform CT examinations in children. The results of this survey allow the development of a set of DRL values for the most common paediatric CT examinations.
Materials and method
The survey conducted between January and December 2005 consisted of a questionnaire addressed to the ten centres dealing with paediatric CT in Switzerland (Aarau, Bellinzona, Bern, Fribourg, Geneva, Lausanne, St Gallen, Sion, Winterthur, and Zurich). The data were treated in an anonymous way, with the ten centres being coded by alphabetical letters from A to J.
In this survey, the paediatric population was separated into four age/weight groups (<1 year or <10 kg; 1-5 years or 10-20 kg; 5-10 years or 20-35 kg; 10-15 years or >35 kg). Each centre was asked to give the total number per age group of children undergoing CT of the brain, chest and abdomen during the year 2005. The generic indications of the examinations were chosen to be compatible with a previous survey conducted in the UK in 2003 [26]: trauma for brain and detection of malignancy for chest. The indication for the CT of the abdomen, which was not considered in the UK survey, was detection of malignancy. For each type of examination and each age group, the type of CT machine and the CT parameters—including the number of series, the use of a contrast medium, the tube kilovoltage and current, the rotation time, the reconstruc-tion slice thickness, the pitch, the displayed volume CT dose index (CTDIvol) and the dose length product (DLP) as
defined according to [27]—were requested. No dose measurements were carried out in the participating centres, but the readings of all the CT systems operating in Switzerland are periodically checked by the inspectors of the Federal Office of Public Health and the tolerated uncertainty according to the law is ±30%. A consistency check of the CTDIvoland DLPs collected was performed
using the dosimetric characteristics of the CT machines used by means of the data published on the Impact Scan website [28]. At the end of the survey each centre received a final report to verify if the data recorded was correct and if some comment needed to be added.
Since no data related to CT examination performed on specific patients was collected, the DRL for a type of examination (and the associated indication) and for an age group is not established directly by taking the 75-percentile of a dose distribution, but indirectly based on the mean value of the dosimetric quantity (CTDIvolor DLP). In this
alternative method, already used in the past in situations where no dose distributions were available [29, 30], the
Table 1 Characteristics of the CT units used
Centre Manufacturer Model Type
Aa Siemens Sensation 16 (Body examinations) MSCT (16-slice system)
GE LightSpeed 16 (Brain examinations) MSCT (16-slice system)
B Philips Tomoscan SR 7000 SSCT SSCT
C Philips Mx 8000 IDT (16 slices) MSCT (16-slice system)
Da Philips Mx 8000 IDT (16 slices) MSCT (16-slice system)
E GE LightSpeed 8 MSCT (8-slice system)
F Siemens Sensation 64 MSCT (64-slice system)
Ga GE LightSpeed 16 MSCT (16-slice system)
H Toshiba Aquilion 16 MSCT (16-slice system)
Ia Picker PQ 5000 SSCT
J GE CT/i PRO SSCT
DRL is obtained by multiplying the mean value, obtained by averaging the typical values provided by the participat-ing centres, by an appropriate factor (1.25 in the present work). Due to the typical shape of the dose distributions, this method provides a figure comparable with the third quartile. Each centre provided for each anatomical region and clinical indication typical values for the various age groups, taking into account the variability due to differ-ences in the protocols used (number of sequdiffer-ences, technical parameters, etc.). Therefore, the average values over the participating centres expressed the national variability for a given examination/indication.
Results
Information was obtained from eight out of the ten centres. Two centres (C and H), which are small regional hospitals, could not provide it due to the limitation of their accounting systems. Three centres were not able to provide detailed information and gave either the number of all examinations ventilated by age, but merging the first two age categories (<1 year and 1-5 years) into a single one (0-5 years), (centres D and F), or the total number of examinations
(centre B). The CT systems involved in the survey are presented in Table1.
The total frequencies of all types of examinations are given in Table2. The data obtained from centres A, G and J specific to the two age categories (<1 year and 1-5 years) were summed up into a single one (0-5 years), in order to allow the comparison with the other centres. Moreover, in the case of centre B, the data presented for the three age groups was calculated based on the total number of examinations and using the average distribution of all the other centres. Table 3 presents the frequency data ventilated by type of examination, associated with the five centres that provided such detailed information (A, E, G, I and J).
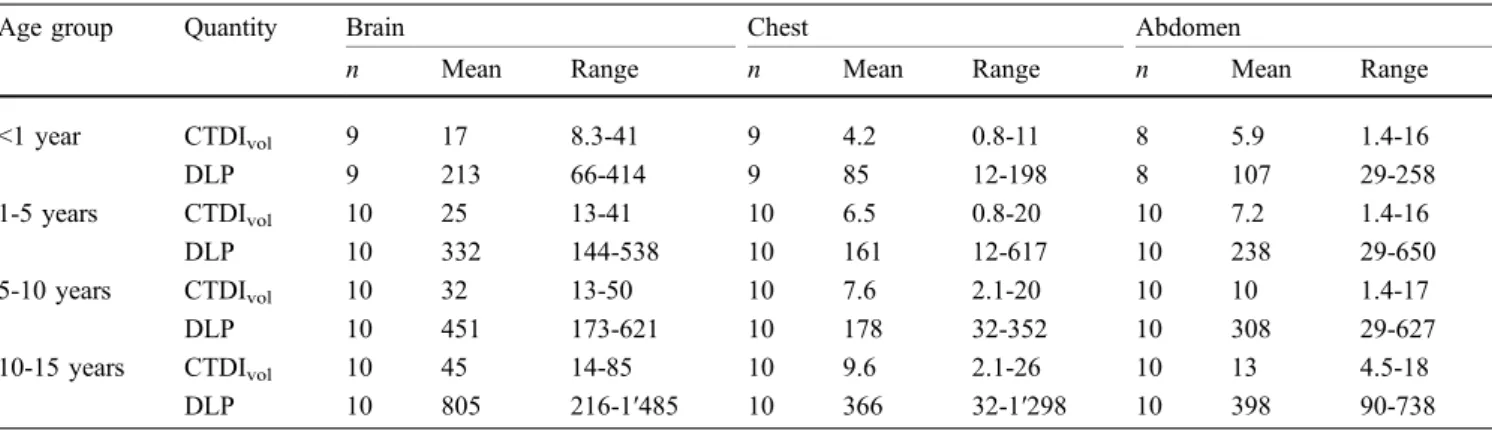
Table 4 displays the dose results of the survey concerning the CT examinations of the brain, the chest and the abdomen and for the four age groups. Mean values averaged over the participating centres and ranges of the CTDIvol(mGy) and the DLP (mGy cm) values are given.
Table 5 gives the DRL values, in terms of the CTDIvol
(mGy) and the DLP (mGy cm), established as described above for the three types of CT examinations and the four age groups, as well as the corresponding DRLs reported in the literature for Germany and the UK.
Table 2 Number of examinations performed in the various centres
Centre 0–5 years 5–10 years 10–15 years Total
(0–20 kg) (20–35 kg) (>35 kg) Aa 208 126 186 520 B 10b 7b 8b 25 Da 304 219 290 813 E 29 35 33 97 F 69 76 145 290 Ga 261 212 217 690 Ia 563 273 203 1039 J 26 38 86 150 All 1,470 986 1,168 3,624 a
University or paediatric hospital
bBased on the total number and using the average distribution of all the other centres
Table 3 Number of examinations per type of examination. (Only the five centres, A, E, G, I and J, which gave detailed information, are considered)
Examination 0–5 years 5–10 years 10–15 years Total
(0–20 kg) (20–35 kg) (>35 kg)
Brain 793 407 351 1,551
Chest 173 146 198 517
Abdomen 121 131 176 428
As an example of the dose distribution involved, Fig.1
summarises the data obtained for children in the age group 1–5 years. It displays graphically the relation between the DLP and the CTDIvol. The slope of the distribution of
points expresses the anatomical length since, by definition, the DLP is the product of the CTDIvoland the length of the
volume examined . This information is of particular importance as the actual length exposed to primary radiation tends to increase when switching from a SSCT to a MDCT as shown by [26]. Moreover, one needs to control the over-ranging of the examination which tends to increase with the size of the beam collimation of the CT unit.
Discussion
The participating centres that carry out paediatric CT in Switzerland use a wide range of CT technologies. Table1
shows that most centres are using multiple-slice CT (MSCT): one eight-slice, five 16-slice and one 64-slice systems from the four main CT manufacturers (General
Electric, Philips, Siemens and Toshiba). However, three centres, one of which is a University centre (I) are still using single slice CT (SSCT) units. There is a general trend in Switzerland to replace SSCT by MSCT systems and this hold for the total number of 216 CT in the country.
The eight centres that provided frequency data per-formed a total of 3,624 CT examinations in 2005 (Table2), with an average of 453 per centre and a variability from 25 in a small centre (B) to 1,039 for a big centre (I). Forty-one per cent of the examinations are performed on newborns and children before the age of 5, 27% on children between 5 and 10, and 32% on children between 10 and 15. Table3
shows that brain examinations represent on average 62% of the total, whereas chest and abdomen account for 21% and 17%, respectively. For the age category 0-5 brain exam-ination accounts for as high as 73%. Three centres only (A, G and J) provided data separately for the two age groups <1 and 1-5, revealing that 16% of the examinations are performed on newborns and 84% on children between 1 and 5.
Large variations in dose appear between the different centres (Table4). These variations are reflected in Fig. 1
Table 4 Means values averaged over participating centres and ranges of CTDIvol(mGy) and the DLP (mGy cm) values
Age group Quantity Brain Chest Abdomen
n Mean Range n Mean Range n Mean Range
<1 year CTDIvol 9 17 8.3-41 9 4.2 0.8-11 8 5.9 1.4-16
DLP 9 213 66-414 9 85 12-198 8 107 29-258
1-5 years CTDIvol 10 25 13-41 10 6.5 0.8-20 10 7.2 1.4-16
DLP 10 332 144-538 10 161 12-617 10 238 29-650
5-10 years CTDIvol 10 32 13-50 10 7.6 2.1-20 10 10 1.4-17
DLP 10 451 173-621 10 178 32-352 10 308 29-627
10-15 years CTDIvol 10 45 14-85 10 9.6 2.1-26 10 13 4.5-18
DLP 10 805 216-1′485 10 366 32-1′298 10 398 90-738
Table 5 DRL values in terms of CTDIvol(mGy) and the DLP (mGy cm) established in the present work compared with the data reported in Germany (D) and the UK
Age group Quantity Brain Chest Abdomen
This work D [6] UK [26] This work D [6] UK [26] This work D [6] UK [26]
<1 year CTDIvol 20 33 30 5 3.5 12 7 5 20a
DLP 270 390 270 110 55 200 130 145 170a
1-5 years CTDIvol 30 40 45 8 5.5 13 9 8 20a
DLP 420 520 470 200 110 230 300 255 250a
5-10 years CTDIvol 40 50 50 10 8.5 20 13 13 30a
DLP 560 710 620 220 210 370 380 475 500a
10-15 years CTDIvol 60 60 65 12 6.8 14 16 10 14
DLP 1′000 920 930 460 205 580 500 500 560
a
These values recommended in the EU are taken from reference [31]. For the UK, adult values were taken for age group 10–15 years since they were not available in the report
that displays the plot of the DLP as a function of the CTDIvol and the DLP. For brain examination, almost all
data points can be aligned along a straight line that has a slope of 11.7 (R2=0.86), meaning that the average length of coverage is 11.7 cm for this particular examination and age category. This examination length is fully compatible with the data obtained in the UK in 2003 (10.9-11.7 cm) [26]. For both chest and abdomen examinations, the slope is 22 (R2=0.94 and R2=0.97, respectively), i.e. an average scan length of 22 cm. It is of note that the value obtained for the
chest in this survey for a similar age category is slightly higher than the UK data (16.5–18.6 cm) [26]. Table 4
shows that the inter-centre variation for brain examination and for the different age groups ranges from a factor of 3.2– 6.2 for the CTDIvol (3.6–6.9 for the DLP) the highest
variation being for age group 10–15 years where the CTDIvoldelivered varies from 14 to 85 mGy and the DLP
varies from 216 to 1,485 mGy cm. For chest examination the inter-centre variations for the different age groups range from a factor of 9.5–25 for the CTDIvol (11–51.4 for the
DLP), the highest variation being for age group 1–5 years where the CTDIvoldelivered varies from 0.8 to 20 mGy and
the DLP varies from 12 to 617 mGy cm. For abdomen examination, the inter-centre variations for the different age groups ranges from a factor of 4.0–12.1 for the CTDIvol
(8.2–22.4 for the DLP), the highest variation being for age group 1-5 years where the CTDIvoldelivered varies from
1.4 to 16 mGy and the DLP varies from 29 to 650 mGy cm. It is worth mentioning that only one centre (I) that performs more than 1,000 CT examinations with a SSCT system does not adapt the protocols to the age of the patient. Thus, there is great potential for optimisation. The small centres (E and F) recourse systematically to a bi-phase acquisition. This practice is not adopted by the other centres for brain and chest examinations. Centre D (large) performs also a bi-phase acquisition during abdomen examinations, which leads to high dose values. Here again there is a potential for optimisation by specifying accurately the instances for which bi-phase acquisition is indicated.
The great dispersion of the CTDIvol reflects a great
dispersion of the associated image quality. The majority of the big centres produce images of homogeneous quality since they are well grouped. Centre I only, where no adaptation of protocols is used, the images produced are of excellent quality for a very young population of patients. On the other hand, in certain centres, where only a few examinations are carried out, such low CTDI values are used (0.8 mGy for chest and patients between 0 and 5 years; 1.4 mGy for abdomen and patients from 0 and 10 years) that the diagnostic quality of the image may be questioned.
As shown in Table5, the DRLs in terms of CTDIvoland
DRLs are compatible with the values reported in Germany and the UK. In most cases they are lower than the UK data. Compared with the German data, the values established in this work are lower for the brain examination, but higher for chest and abdomen for some age groups.
The DRLs obtained in this investigation were estab-lished by considering typical dose values associated with standard protocols used in a given centre for the various types of examinations and age groups, and then averaging over the ten participating centres and multiplying by an appropriate factor. These DRLs should be considered as provisional only, to be replaced in the future by more robust data established through surveys of measured doses A D E (2 phases) F (2 phases) G I J UK 2003 [26] DRL [31] This study 0 100 200 300 400 500 600 700 0 10 20 30 40 50 60 70 CTDIw (mGy)
CTDIvol (mGy)
CTDIvol (mGy)
H C L= 11.7 cm B 0 100 200 300 400 500 600 700 0 5 10 15 20 25 30 35 A B C D E (2 phases) F (2 phases) G H I J UK 2003 [26] DRL [31] This study L = 22 cm A B C D (2 phases) E (2 phases) F (2 phases) G H I J This study L= 22 cm 0 100 200 300 400 500 600 700 0 5 10 15 20 25 30 DRL [26] (upper + lower abdomen) DRL [26] (upper abdomen only)
DLP (mGy.cm)
DLP (mGy.cm)
DLP (mGy.cm)
Fig. 1 Brain (top), chest (middle) and abdominal (bottom) exam-ination for children in age group 1 to 5 years
on a big sample of patients leading to empirical dose distributions. The collection of such data is time and resource consuming, but the new Swiss legislation concerning the implementation of DRLs and the setting-up of a national dose database, as well as the standardisa-tion of the way the dose descriptors (CTDIvol and DLP
parameters) will be stored in the DICOM header, which is under discussion, will all facilitate such an endeavour.
Conclusion
The frequency of paediatric CT examinations and the typical values of the related dose quantities (CTDIvol
and DRLs) were surveyed in the ten Swiss centres performing paediatric CT. Mean values averaged over the participating centres were calculated and the corresponding DRLs were established by multiplying the mean values by 1.25. This investigation revealed that 4,000–5,000 CT examinations are carried out on children in Switzerland, with an average of 453 per centre performing paediatric CT. Significant variations of the radiation dose delivered to the paediatric
popu-lation were found. An optimisation process should be initiated in order to reduce this spread in dose (appropriate image quality requirements for a given indication, number of acquisition phases that are clinically relevant, etc.). A major element of the optimisation process is a consensus on the DRLs that need to be used. This becomes a priority in the light of contributions such as described in a recent article published in the Lancet [32]. A set of DRL values for CT examinations of the brain, the chest and the abdomen and for the various age groups are proposed here for temporary use in paediatrics until a more extensive survey is organised to collect dose data on a large sample of patients and to establish empirical dose distributions.
Acknowledgements The authors gratefully acknowledge financial support from the Swiss National Science Foundation (Grant no. 3200B0-105951) and are thankful to the members of SSPR, in particular: Drs G. Eich, S. Hanquinet, J.-M. Girard, A. Racle, G. Remsei, T. Schraner, P. Waibel, R. Wolf, Mme M. Wyttenbach, M. P. Brégis, and A. Devaud)
References
1. United Nations Scientific Committee on the Effects of Atomic Radiation (2000) Report to the general assembly, annex D: Medical radiation exposures. United Nations, New York
2. Aroua A, Vader JP, Valley JF, Verdun FR (2007) Exposure of the Swiss population by radiodiagnostics : 2003 Review. Health Phys 92:442–448 3. Børretzen I, Lysdahl KB, Olerud HM
(2007) Diagnostic radiology in Norway—trends in examination frequency and collective effective dose. Radiat Prot Dosim 124:339–347 4. Aroua A, Burnand B, Decka I, Vader
JP, Valley JF (2002) Nation-wide survey on radiation doses in diagnostic and interventional radiology in Swit-zerland in 1998. Health Phys 83:46–55 5. Aroua A, Decka I, Burnand B, Vader
JP, Valley JF (2002) Dosimetric aspects of a national survey of diagnostic and interventional radiology in Switzerland. Medical Phys 29:2247–2259
6. Galanski M, Nagel HD, Stamm G (2007) Paediatric CT exposure prac-tice in the federal republic of Ger-many: results of a nationwide survey in 2005-2006. Medizinische
Hochschule, Hannover
7. Kanae N, Masaki M, Kazuo I, Takashi M (2004) Survey of CT practice in Japan and collective effective dose estimation. Nippon Acta Radiologica 64:151–158
8. Nationwide Evaluation of X-Ray Trends (NEXT): 2000 Survey of Com-puted Tomography (2006), CRCPD publication NEXT_2000CT-T 9. Donnelly LF, Emery KH, Brody AS,
Laor T, Gylys-Morin VM, Anton CG, Thomas SR, Frush DP (2001) Mini-mizing radiation dose for paediatric body applications of single-detector helical CT: strategies at a large chil-dren’s hospital. AJR Am J Roentgenol 176:303–306
10. Cody DD, Moxley DM, Krugh KT, O’Daniel JC, Wagner LK, Eftekhari F (2004) Strategies for formulating ap-propriate MDCT techniques when im-aging the chest, abdomen, and pelvis in pediatric patients. AJR Am J
Roentgenol 182:849–859
11. Hollingsworth C, Frush DP, Cross M, Lucaya J (2003) Helical CT of the body: a survey of techniques used for pediatric patients. AJR Am J Roent-genol 180:401–406
12. Vock P (2005) CT dose reduction in children. Eur Radiol 15:2330–2340 13. Boone JM, Geraghty EM, Sielbert JA,
Wootton-George SL (2003) Dose re-duction in pediatric CT: a rational approach. Radiology 228:352–360 14. Paterson A, Frush DP, Donnelly LF
(2001) Helical CT of the body: are settings adjusted for pediatric patients? AJR Am J Roentgenol 176:297–301 15. Huda W, Lieberman KA, Chang J,
Roskopf ML (2004) Patient size and x-ray technique factors in head computed tomography examinations. II. Image quality. Med Phys 31:595–601 16. Siegel MJ, Schmidt B, Bradley D,
Suess C, Hildebolt C (2004) Radiation dose and image quality in pediatric CT: effect of technical factors and phantom size and shape. Radiology 233:515– 522
17. Verdun FR, Lepori D, Monnin P, Valley JF, Schnyder P, Gudinchet F (2004) Management of patient dose and image noise in routine pediatric CT abdominal examinations. Eur Radiol 14:835–841 18. Wilting JE, Zwartkruis A, van Leeuwen
MS, Timmer J, Kamphuis AG, Feldberg M (2001) A rational approach to dose reduction in CT: individualized scan protocols. Eur Radiol 11:2627– 2632
19. Pages J, Buls N, Osteuax M (2003) CT doses in children: a multicentre study. Br J Radiol 76:803–811
20. Linton OA, Mettler FA (2003) National conference on dose reduction in CT with an emphasis on pediatric patients. AJR Am J Roentgenol 181:321–329 21. Hall EJ (2002) Lessons we have
learned from our children: cancer risks from diagnostic radiology. Pediatr Radiol 32:700–706
22. Ron E (2002) Let’s not relive the past: a review of cancer risk after diagnostic or therapeutic irradiation. Pediatric Radiology 32:739–744 dis-cussion 751–754
23. Brenner DJ, Elliston CD, Hall EJ, Berdon WE (2001) Estimated risks of radiation-induced fatal cancer from paediatric CT. AJR Am J Roentgenol 176:289–296
24. Frush DP, Donnelly LF, Rosen NS (2003) Computed tomography and ra-diation risks: what pediatric health care providers should know. Pediatrics 112:951–957
25. International Commission on Radio-logical Protection (1997) RadioRadio-logical protection and safety in medicine. ICRP Publication 73, Pergamon, Ox-ford New York
26. Schrimpton PC, Hillier MC, Lewis MA, Dunn M (2005) Dose from CT examination in the UK–2003 review. NRPB–W67 Report. National Radio-logical Protection Board, Chilton
27. International Electrotechnical Commit-tee (2002) Medical diagnostic X-ray equipment-Particular requirements for the safety of X-ray equipment for CT; Standard IEC #60601-2-44
28.http://www.impactscan.org
29. Neofotistou V (2001) Review of patient dosimetry in cardiology. Radiat Prot Dosim 94:177–182
30. Aroua A, Besançon A, Buchillier-Decka I, Trueb P, Valley JF, Verdun FR, Zeller W (2004) Adult reference levels in diagnostic and interventional radiol-ogy for temporary use in Switzerland. Radiat Prot Dosim 111:289–295 31. Shrimpton PC, Wall BF (2000)
Refer-ence doses for paediatric computed tomography. Radiat Prot Dosim 90:249–252
32. Martin DR, Semelka RC (2006) Health effects of ionising radiation from diag-nostic CT. Lancet 367:1712–1714