DEVELOPMENT OF MICROREACTOR SETUPS FOR
ARGMiVW
MICROWAVE ORGANIC SYNTHESIS
MASSACHUSETTS INSTITUTEOF TECHNOLOLGY by
JUN 16 2015
Wen-Hsuan Lee
LIBRARIES
Bachelor of Science, Chemical Engineering, National Taiwan University, 2008
Master of Science, Chemical Engineering Practice, Massachusetts Institute of Technology, 2011
SUBMITTED TO THE DEPARTMENT OF CHEMICAL ENGINEERING IN PARTIAL FULFILLMENT OF THE REQUIREMENTS FOR THE DEGREE OF
DOCTOR OF PHILOSOPHY IN CHEMICAL ENGINEERING
AT THE
MASSACHUSETTS INSTITUTE OF TECHNOLOGY
FEBRUARY 2015
0 2015 Massachusetts Institute of Technology. All rights reserved.
Author
Signature redacted
Wen-Hsuan Lee Department of Chemical Engineering October 3, 2014
Signature redacted
Certified bye
Klavs F. Jensen Warren K. Lewis Professor of Chemical Engineering Professor of Materials Science and Engineering Thesis Supervisor
Accepted
by
Signature redacted
Patrick S. Doyle Professor of Chemical Engineering Chairman, Committee for Graduate Students
DEVELOPMENT OF MICROREACTOR SETUPS FOR MICROWAVE ORGANIC SYNTHESIS by
Wen-Hsuan Lee
Submitted to the Department of Chemical Engineering on October 3, 2014 in partial fulfillment of the
requirements for the degree of
Doctor of Philosophy in Chemical Engineering
ABSTRACT
The main contribution of this work is the understanding of microwave heating and the microreactor design challenges involved through both chemical experiments and computational models. The original goal of this research is to develop a microreactor system in order to carry the microwave organic synthesis in continuous flow format and to understand the basic phenomena of microwave heating through accurate kinetic studies.
Several heating issues were observed with the first microreactor setup, including an uneven temperature distribution across the microwave irradiated area and a temperature limitation that depends on the position of the reactor. To find the root of these problems, the electromagnetic field and the heat transfer scheme of the microwave system were modeled with COMSOL. The simulations show that there are three main causes to the heating issues: (1) the electric field has an inherent resonance structure and thus has an uneven magnitude within the microwave cavity, (2) the electric field changes with not only the material, but also the sizes and positions of the objects in the microwave cavity, (3) the air gaps in the microwave waveguide creates a large natural convection heat loss. The simulations gave us a deeper understanding of the microwave heating phenomena and were used to find the optimum design of the microreactor.
A second multiple-layered glass reactor was designed accordingly to overcome the heating
limitation and minimized the temperature unevenness. However, the non-uniform heating rate cannot be eliminated since it is inherent in the resonance structure of microwaves. Both the experimental results and the simulations of the final reactor show that even though the reactor can reach the desired temperature, the temperature range across the reactor could be up to 20 *C. In addition, it was found that the flow rate of the reaction greatly affects the thermal equilibrium of the reaction volume. Accurate temperature control is therefore still a challenge for kinetic studies to be feasible with the current single-mode microwave system. The benefit of microwave heating is therefore still in the qualitative screening of chemical compounds, a feature which was demonstrated with a Fischer-Indole screening in the final setup.
Thesis Supervisor: Klavs F. Jensen
Title: Department Head, Chemical Engineering
Warren K. Lewis Professor of Chemical Engineering Professor of Materials Science and Engineering
~e1y -~
~y[~
1aidIn
I~xWWI
I
1&7
ACKNOWLEDGEMENTS
The pursuit of this degree has been a humbling journey that has bent and shaped me as both a scientist and a human being, hopefully into a better form in each respect. I am only able to travel to the end of this road because of the amazingly supportive family, friends, mentors, and colleagues that I have been fortunate enough to have known. They have all been an instrumental part of my growth throughout these years. During the completion of this thesis, I have longed to put down in words my gratitude for the overwhelming help and encouragement they have provided me.
I would like to start by thanking my advisor, Professor Klavs Jensen, without whom this
thesis would not have been possible. I am deeply grateful for his years of guidance and support, be it technical, financial, or beyond. I am still at awe by not only his remarkable breadth and depth of knowledge, but also the substantial time and care he puts towards his students despite his busy schedule. I greatly appreciate his policy of keeping his doors open to his students at all times, and for his efforts in creating an encouraging lab environment. Thank you, Klavs, for believing in my work and my scientific abilities, especially at times when I lose sight of the
prospects myself.
I would also like to thank Professor Bill Green and Professor Tim Jamison, my thesis
committee members, for their feedbacks throughout the years. Both of them have provided crucial and inspiring suggestions that helped me focus on the contributions of this project to the research community and its applications. Thank you for lending your time to me and offering me your viewpoints from your expertise.
This work was funded by the National Science Foundation and Novartis AG. I deeply appreciate these institutions for helping me fulfill my goal to pursue scientific research in the States while putting a roof over my head. I also acknowledge CEM for generously lending us the microwave unit used for this study for the past six years. Furthermore, I would like to thank Professor Aaron Beeler and Professor John Porco for hatching the idea of this project.
Numerous people have helped me acquire technical skills and offered me scientific discussion throughout this thesis. I am grateful for the knowledge they have passed on to me. I would especially like to thank Dr. Will Grover, who took out generous amount of time to train me in glass microfabrication and lent me his photo exposure setup. Thanks to Lih Feng Cheow
for helping me use the CNC drill press in the Han Lab. I also owe many thanks to YiMing and ShaoLing in the Buchwald Lab, and Christina Dai in the Jamison Lab, for the useful suggestions on purifying the Indole products and for generously lending me their setups when our lab was under renovation. I gratefully appreciate everyone in the Jensen Lab, past and present, for keeping a friendly work environment and for kindly providing me with constructive suggestions as well as insightful discussions. In particular, I would like to thank Stephen Born, Stephen Newman, and Chris Smith, for helping me with my organic chemistry; Lei Gu, for the suggestions on COMSOL; and Jason, Patrick, Brandon, and Everett, for helping me on the numerous miscellaneous problems I run into every now and then. This has been a really
enjoyable lab to work in.
The people in ChemE have enriched my graduate school experiences, and I deeply appreciate the staff and faculty that have helped me throughout the years: Professor William Deen and Professor Patrick Doyle, thank you for letting me TA your class. It was both a privilege and a delight working for you. Claude Lupis and Chris Marton, thank you for directing
us at Practice School. It was a very valuable experience. To the staffs, you do the best job at keeping the department affairs efficiently in order while creating a warm and welcoming atmosphere for us all. Alina Haverty, Barbara Balkwill, Iris Chang, Christine Preston, Suzanne Maguire, Joel Dashnaw, and Beth Tuths, thank you for all the care and the friendly faces over the years.
The support of my friends here in Boston/Cambridge have carried me through the hardships of graduate school and have helped me found home in this foreign city. I am astounded
by these friendships that I've been blessed with, and I treasure every profound discussion, every
silly laugh, every happy drink, every delicious meal, and every heartfelt moment we've shared together. Many of these friendships have been forged in the Jensen lab: Chao Ling, thank you for rekindling my faith in research every time my visions are flickering. Vicki, thank you for being not only a wonderful TA and a knowledgeable mentor, but also an understanding friend who always sees the good in me and encourages me to treat myself kinder. Tanya and Maria, thank you for being my comrades that pump one another up at all times, in every aspect of life. Norbert, thank you for lamenting with me the ups and downs we've both experienced. Gino, thank you for making sure I still had an enjoyable life outside of work while I was making the final sprint this past year. To my friends at MIT: Kunle, thank you for taking me in as your mentee when I was a
first year and as your "other roommate" during you last few years in Ashdown. Kristin, you're an awesome person to chill with at all occasions. I am very thankful that I got to know you better throughout the years and that you've held my hand through some of my worst moments. Jungmin and Vivian, thanks for all the food adventures and fashion exchanges. Ilia and Amy, thank you for all the epic hangouts and for being there whenever I need someone to talk to. Harry, Simon, Kevin, Bonnie, and Michael Hess, thanks for being there at battle with me since first year and helping me maintain my work-life balance from then on. I greatly appreciate all the friends I made through the Taiwanese ties both at MIT and in the greater Boston area: Yina, I am grateful to have you as a friend that I can always talk honestly to and share all sorts of ideas with. Andrew, thank you for your advice on all things, especially finance, in life. Chih-Chao, thank you for giving me care and support as the older brother I've never had. Joyce, I'm happy to have a friend who shares so many interests as me. Ingrid, Michelle, Sherry, and Lisa, thank you for treating me as a sister and always opening up your home to me. To my friends who I've had the fortune to nourish relationships with for more than a decade: Chih-Ying, thank you for commiserating and traveling with me throughout grad school. Yuan-Hsi, Chia-Chen, and You-yu, thank you for all the postcards throughout the years. I know that wherever I may go, you'll be there for me anywhere you are. A very special group of friends in Ashdown House have been my Boston family. We've spent countless celebrations and consolations together ever since we all moved into Ashdown the first year it opened. I know we can always rely on one another to be there for the big moments. Kao Tsung, thanks for being there for me during all sorts of problems, from getting me started with electromagnetic simulation to talking with me through personal issues. Kay, thank you for guiding me through all stages of grad school and teaching me the ins and outs of MIT ChemE. Jackie, thank you for being a considerate roommate. Albert, Samuel, Vgod, thank you for all the fun talks and for driving me whenever I need a lift. Without naming names, I would also like to thank the people I have met at an MIT support group. The intelligence and resilience they've shown throughout experiences that resonate with mine have given me immense hope and comfort.
For the last year and a half, I have to thank Michael for his continuous love and support. Both his compassion and craziness have kept me grounded and motivated for life. Michael, thank you for appreciating me as who I am and inspiring me to be better. I am grateful to have you as my personalized Hoptimist. I am looking forward to all the delicious journeys we have ahead.
My deepest gratitude goes to my parents, whom I admire and respect more and more each
day. If I can go through life with half the wit, grit, and kindness they have, I would consider myself a success. I am grateful that despite the hardships they've faced, they have always put raising my siblings and me with the right values as the utmost priority. I would not have been in MIT if they had not taught me the importance of learning and being independent. Dad, thank you for taking me to the library ever since I learned how to read, and for never putting a price on our education. Mom, thank you for encouraging me to never limit my interest or potential to the social expectation of the gender I was born in, and for teaching me the values of a curious mind and a kind heart over outer appearances. Most importantly, I would like to thank you both for giving me the three most wonderful siblings anyone can ask for: Judy, Michael, and Meimei, thank you for the years of companionship, entertainment, and, at times if not most, tolerance. It gives me strength to know that the three of you have always looked up to me not for what I did, but for who I am. Last but not least, I would like to thank the rest of my family for their encouragement, especially my Grandma and cousin Marian, who surprised me with care packages for the last six years, and my Grandpa, who took me to grade school every day and whose memories I will forever cherish.
TABLE OF CONTENTS
ABSTRA CT...3
ACKN OW LED G EM ENTS ... 7
TA BLE OF CON TEN TS ... 11
LIST OF FIGURES ... 15
LIST O F TA BLES...23
LIST O F SCH EM ESS ... 25
CHA PTER 1. M OTIV A TION AN D BACK GROUN D ... 27
1.1 M otiv.1i n ... 27
1.2 M icrow ave-assisted Organic synthesis... 29
1.2.1 M icrow ave Heating M echanism ... 29
1.2.2 M icrow ave H eating Effects and Applications... 30
1.2.3 M icrow ave Units and Equipm ent ... 36
1.2.4 M icrow ave Synthesis in Continuous Flow ... 39
1.3 G lass M icroreactor Fabrication... 42
1.3.1 G lass M icroreactor Fabrication ... 42
1.3.2 Packaging Techniques ... 45
1.4 Thesis Overview ... 47
CHA PTER 2. INITIA L SY STEM D ESIGN ... 49
2.1 Introduction ... 49
2.2 Discover M icrow ave Unit ... 49
2.3 M icroreactor Setup and Fabrication M ethods ... 50
2.4 V alidation Reactions... 54
2.5 H eating Issues...57
CHAPTER 3. MICROWAVE HEATING SIMULATIONS ... 61
3.1 Introduction ... 61
3.2 Theoretical Background ... 62
3.3.1 M odel Geometry... 64
3.3.2 Simulation M odel Description... 66
3.3.3 Simulation Results... 68
3.3.4 Improving Reactor Design with Simulations ... 73
3.3.5 M odel Deficiency ... 73
3.4 Air Convection M odels ... 74
3.4.1 Thermal Conductivity Estimation M odel... 76
3.4.2 Single-Phase Flow M odel... 79
CHAPTER 4. SPIRAL REACTOR SETUP ... 87
4.1 Introduction ... 87
4.2 Reactor Design and Heating Testing ... 87
4.2.1 First Generation of Spiral M icroreactor ... 87
4.2.2 Chemistry Testing and M echanical Stability... 88
4.2.3 Second Generation of Spiral M icroreactor ... 91
4.3 Spiral Reactor Simulations ... 91
4.3.1 Spiral Reactor Simulations with Empty Channels ... 92
4.3.2 Spiral Reactor Simulations with Static Acetic Acid...94
CHAPTER 5. VERIFICATION EXPERIM ENTS...105
5.1 Introduction ... 105
5.2 Condensation Reaction Kinetics...105
5.2.1 Direct M icrowave Heating at Two Different Positions...105
5.2.2 Experiments with a M icrowave-Shielding Glycerol Bath...108
5.3 Temperature Results of Reactor M odels with Flow ... 110
5.3.1 Kinetic M ean Temperature Definition ... 110
5.3.2 Spiral Reactor Simulations with Flow...111
5.3.3 Simulation Parameter Sensitivity ... 115
5.4 Fischer Indole Screening ... 121
5.4.1 Experimental Procedures ... 123
5.4.2 Fischer Indole Synthesis Results ... 123
CHAPTER 6. CONCLUSIONS AND FUTURE PERSPECTIVES...127
6.2 Future Perspectives...13 1
6.2.1 Redesigning a Microwave Unit ... 131
6.2.2 3D Tem perature Sensor ... 132
6.2.3 Simulation for Accurate Temperature Prediction...132
R E F E R E N C E S ... 135
APPENDIX A. CHAPTER 2 SUPPORTING INFORMATION ... 141
A .1 Fabrication D etails...14 1 A.2 Designs of Initial Glass Microreactor Holders ... 144
A .3 M ixing Q uality...145
A .4 Experim ental Procedure...146
APPENDIX B. CHAPTER 3 SUPPORTING INFORMATION ... 151
B. 1 Nusselt Number Calculation Details and Matlab Code for Thermal Conductivity E stim ation M odel ... 15 1 B.2 Additional Temperature Plots for Each Simulation Models...153
APPENDIX C. CHAPTER 5 SUPPORTING INFORMATION ... 159
C. 1 Condensation Reaction Experimental Procedure...159
C.2 Matlab Code for Reactor Mean Temperature Calculation...160
LIST OF FIGURES
Figure 1.1: Microwave heating of ethanol under atmospheric pressure with 75W of irradiation
4
p o w er. ... 3 1
Figure 1.2: Kinetic data collected from microwave heating (0) and conventional heating (0)
4
for esterification reaction. ... 31
Figure 1.3: Different shapes of waveguides in single-mode microwave units: (a) Circular
5
waveguide in CEM Discover. (b) Rectangular waveguide in Biotage Initiator. ... 38 Figure 1.4: CEM Voyager® continuous flow system and its different reactors.15' 47 . . . 38
Figure 1.5: (a) Microreactor, and (b) capillary reactor designed by the Haswell group for
Suzuki cross-coupling reactions. 48 9... 40 Figure 1.6: (a) Single capillary reactor system and (b) parallel, capillary multireactor system
18-19
for continuous flow microwave reaction designed by the Organ group... 41 Figure 1.7: Schematics of the sand-filled flow cell designed by the Bagley group.5... 42 Figure 1.8: Schem atic of microfabrication in glass. ... 43 Figure 1.9: Glass-glass bonding with FEP Teflon film to create membrane valves. (a) The
exploded and assembled illustration of the bonding pieces. (b) Cross-sectional
schematic the operation of a single valve .62 44
Figure 1.10: (a) Schematic of three-dimensional channels in the pile-up reactors aligned for
54
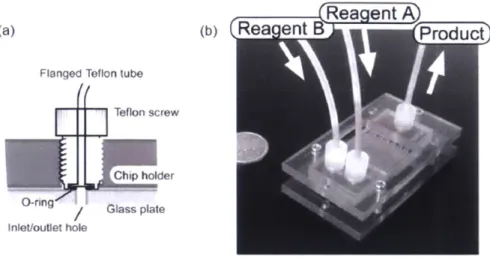
thermal bonding. (b) Photograph of the ten-layer, pile-up reactor. ... 45 Figure 1.11: Compression packaging of glass reactors in the Kitamori group: (a)
Cross-sectional schematic of the tube connection. (b) Photograph of the pile-up glass
54
reactor w ith tube connections.4... 46 Figure 1.12: Reactor setup for glass tube brazing procedure.68 ... 47
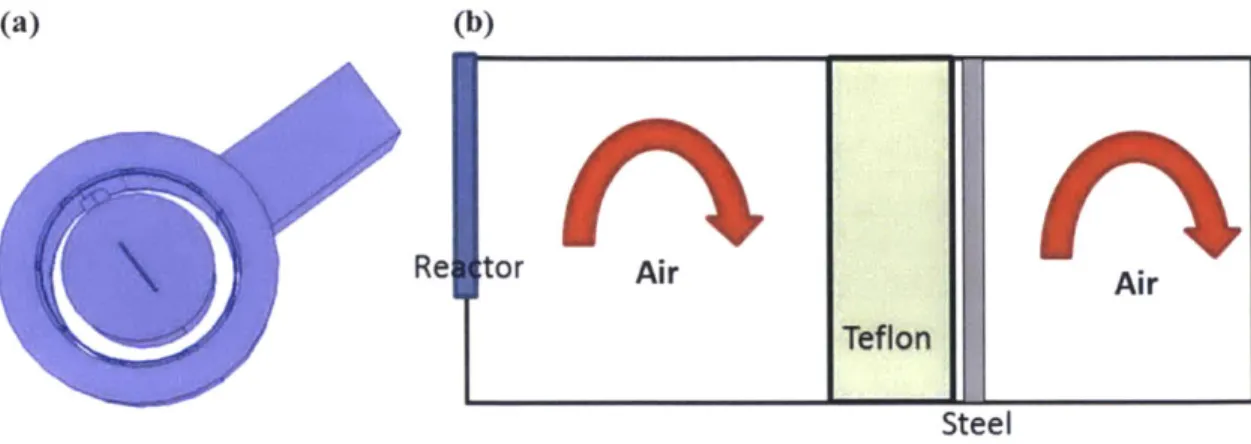
Figure 2.1: CEM Dicover@ 1 unit used for this research: (a) Front view of the unit. (b)
Schematic of internal microwave configuration view from the top.47... ... . . . 50
Figure 2.2: Side view of the microreactor fitting into the microwave unit. Red arrows depict the direction of m icrowave irradiation... 51
Figure 2.3: 1 " generation of microreactor: (a) Microreactor without packaging. (b) Packaging
of microreactor with PEEK assembly and Teflon holder for the fiber optic
temperature probe. (c) Backside of assembly with PEEK screws... 52
Figure 2.4: Microreactor setup for continuous-flow microwave synthesis. ... 53
Figure 2.5: Conversion profile for 2-methylbenzimidazole formation with first microreactor setu p ... 5 6
Figure 2.6: Arrhenius plot of ln k versus l/T used to determine the activation energy and pre-exponential factor of the condensation reaction with the results from the initial
m icroreactor for m icrow ave... 56
Figure 2.7: Comparison of the aromatic substitution results from microwave microreactor and conventional cartridge heater... 57
Figure 2.8: Deposits in reaction channels after aromatic substitution reactions. ... 57 Figure 2.9: Schematic of the reactor temperature as measured by a thermal couple after
heating the aromatic substitution solution to 260 C... 58
Figure 2.10: Temperature profile at different solvents inside the microreactor irradiated at the m axim um m icrow ave pow er. ... 59
Figure 2.11: Temperature profiles of empty reactor surface center under different microwave power irradiation at positions (a) parallel to microwave port, (b) perpendicular to m icrow ave port. ... 59
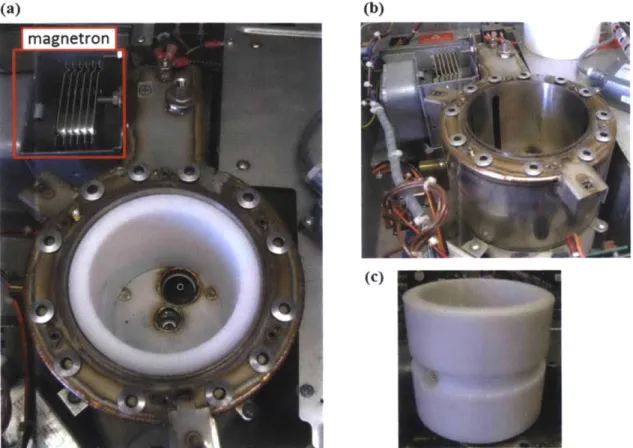
Figure 3.1: Internal structure of the CEM Discover Unit: (a) top view of all components, (b) side view of waveguide and steel wall without the Teflon piece, and (c) picture of the Teflon component with a side hole... 65
Figure 3.2: Isotropic view of simulation geometry schematics with reactor positioned (a) parallel to microwave port, and (b) perpendicular to microwave port. (Colored
axes show the directions in the simulation geometry drawing.)... 66
Figure 3.3: Simulated reactor surface temperature of an empty reactor under 300 W microwave irradiation for 60 seconds at (a) parallel-to-port position, and (b)
perpendicular-to-port position. (Inserts show the surface position and direction)... 68 Figure 3.4: Simulated total power dissipation/heating rate in microwave cavity across reactor
center plane under 300 W microwave irradiation for 60 seconds at (a) parallel-to-port position, and (b) perpendicular-to-parallel-to-port position... 69
Figure 3.5: Simulated electric field strength in microwave cavity across reactor center plane of empty reactor under 300 W microwave irradiation for 60 seconds at (a) parallel-to-port position, and (b) perpendicular-parallel-to-port position. ... 70
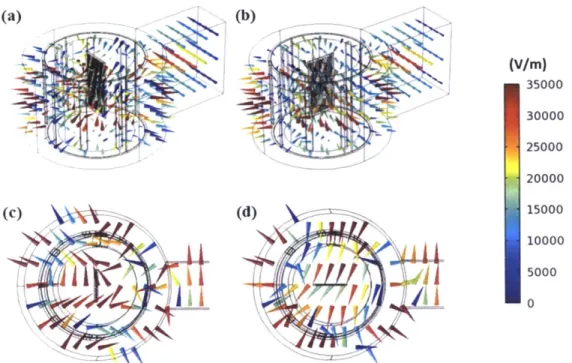
Figure 3.6: Simulated electric field of empty reactor under 300 W microwave irradiation for
60 seconds: (a) Isometric view of parallel-to-port position. (b) Isometric view of
perpendicular-to-port position. (c) Top view of parallel-to-port position. (d) Top view of perpendicular-to-port position. ... 71
Figure 3.7: Size view of the electric field resonance in the cavity and the start of the
w av egu id e. ... 72
Figure 3.8: Electric field strengths and temperatures of reactor center with various reactor
thicknesses under 60 seconds of 300 W microwave irradiation... 73 Figure 3.9: Temperature of reactor center in initial simulation models after 60 minutes of
m icrow ave irradiation... 74 Figure 3.10: (a) Domain in the simulation model that required natural convection model. (b)
Schematics of the side view of the air gap in the cavity and waveguide... 75 Figure 3.11: Comparison between the experimental and simulated heating profiles with the
k-estimation models of empty reactors under different power exposure at parallel-to-p ort parallel-to-p o sition ... 7 7
Figure 3.12: Comparison between the experimental and simulated heating profiles with the k-estimation models of empty reactors under different power exposure at
perpendicular-to-port position. ... 78
Figure 3.13: Velocity field on cavity center plane viewed from the front of the unit in the single-phase flow simulation when reactor is parallel to port. (Color bar shows velocity magnitude, arrows indicate velocity direction projected onto the 2D
p lan e .) ... 8 1
Figure 3.14: Velocity field on cavity and waveguide center plane viewed from the right side of the unit in the single-phase flow simulation when reactor is parallel to port. (Color bar shows velocity magnitude, arrows indicate velocity direction projected onto the 2D plane.)... 82
Figure 3.15: Velocity field on cavity center plane viewed from the front of the unit in the single-phase flow simulation when reactor is perpendicular to port. (Color bar
shows velocity magnitude, arrows indicate velocity direction projected onto the 2D p lan e .) ... 8 2
Figure 3.16: Velocity field on cavity and waveguide center plane viewed from the right side of the unit in the single-phase flow simulation when reactor is perpendicular to port. (Color bar shows velocity magnitude, arrows indicate velocity direction
projected onto the 2D plane.)... 83
Figure 3.17: Comparison of heating profiles between the two air-convection simulation models and experimental data for empty reactor under 300 W microwave
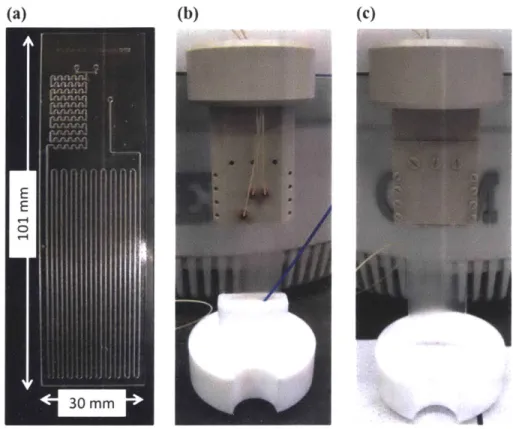
irradiation at (a) parallel-to-port and (b) perpendicular-to-port position... 84 Figure 4.1: 1s' spiral, multilayer microreactor design: (a) front view, (b) angled view, (c) side
view schematics, and (d) picture of actual reactor... 88
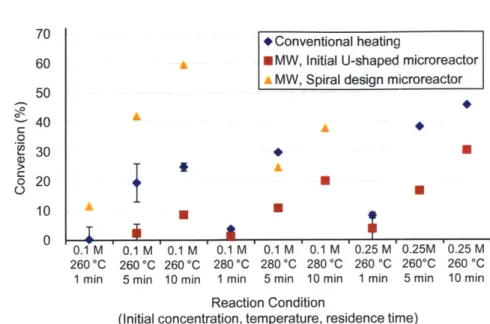
Figure 4.2: Comparison of the aromatic substitution results from microwave microreactor and conventional cartridge heater... 89
Figure 4.3: 2nd spiral, multilayer microreactor design: (a) picture of reactor, (b) front view
picture with packaging, (c) angled view picture with packaging. ... 91
Figure 4.4: Isotropic view of (a) entire simulation geometry for spiral reactor positioned parallel to microwave port, and (b) close-up schematics of the reactor with reaction channels colored in blue. ... 92
Figure 4.5: Comparison between the experimental and simulated heating profiles with the k-estimation models of empty spiral reactors under different power exposure at
parallel-to-port position. ... 93
Figure 4.6: Simulated temperature profile of spiral reactor filled with acetic acid under various power of microwave irradiation. (Insert shows the point of temperature
m easurem ent.)... . . 95
Figure 4.7: Electric field strength of different planes viewed from the front side of the unit for spiral reactor under 6 W irradiation... 96
Figure 4.8: Power dissipation density of different planes viewed from the front side of the unit for spiral reactor under 6 W irradiation. ... 97
Figure 4.9: Temperature of reactor center plane viewed from the front side of the unit for
Figure 4.10: Temperature of different planes viewed from the front side of the unit for spiral reactor at t=60 minutes under 6 W irradiation... 100
Figure 4.11: Temperature along the reaction volume in the spiral reactor at t=60 minutes
under 6 W irradiation... 101
Figure 4.12: Electric field strength of cavity and waveguide center plane viewed from the
right side of the unit for spiral reactor at t=60 minutes under 6 W irradiation... 102 Figure 4.13: Power dissipation density of cavity and waveguide center plane viewed from the
right side of the unit for spiral reactor at t=60 minutes under 6 W irradiation... 103 Figure 4.14: Temperature of cavity and waveguide center plane viewed from the right side of
the unit for spiral reactor at t=60 minutes under 6 W irradiation. ... 103
Figure 5.1: Conversion data of condensation reaction of o-phenylenediamine and acetic acid from spiral m icroreactor. ... 106
Figure 5.2: Conversion data of condensation reaction of o-phenylenediamine and acetic acid from spiral m icroreactor. ... 109
Figure 5.3: Temperature along the reaction volume in the spiral reactor under constant 6 W irradiation for continuous flow with different residence times... 115
Figure 5.4: The input power dependencies of the average power dissipation density (0) and
the total heating rate in the reaction volum e (*)... 116
Figure 5.5: The input power dependencies of the reactor kinetic mean temperature at various flo w rates... 1 17
Figure 5.6: The permittivity dependence of the total heating rate in the reaction volume... 118 Figure 5.7: The permittivity dependence of the kinetic mean temperature of the reaction
w ith ou t flow ... 119
Figure 5.8: The dielectric constant dependencies of the kinetic mean temperature of the
reaction without flow at various dielectric loss values... 120 Figure 5.9: The dielectric loss dependencies of the kinetic mean temperature of the reaction
without flow at various dielectric constant values... 121 Figure A. 1: Calibration curve of glass wet-etched with 49 % HF solution... 141 Figure A.2: Microscope picture of furnace bonded glass reactor etched on single side. (Scale
Figure A.3: Microscope picture of furnace bonded glass reactor etched on both sides. (Scale u n it: 10 p m ) ... 14 3 Figure A.4: Drawing of PEEK holder for initial microreactor setup. (Unit: inch)... 144 Figure A.5: Drawing of Teflon holder for fiber optic probe. (Unit: mm) ... 144 Figure A.6: Simulation of mixing length for microreactor with 4.5 pl/min flow rate at each
in let. ... 14 5 Figure A.7: Simulation of mixing length for microreactor with 750 pl/min flow rate at each
in let. ... 14 6 Figure A.8: Arrhenius plot of ln k versus l/T for Diels-Alder reaction using initial
m icroreactor w ith m icrow ave... 147 Figure A.9: Arrhenius plot of ln k versus l/T for Diels-Alder reaction in batch experiments
w ith m icrow ave... 148 Figure A.10: Arrhenius plot of ln k versus l/T for the condensation reaction using the
reported conversions in reference "Damm, M.; Glasnov, T. N.; Kappe, C. 0., Translating High-Temperature Microwave Chemistry to Scalable Continuous
Flow Processes. Org. Process Res. Dev. 2009, 14 (1), 215-224." ... 149 Figure A. 11: Arrhenius plot of ln k versus 1 /T of the condensation reaction with the results
from the cartridge-heated microreactor. The results from the red calibration line were used to determine the activation energy and pre-exponential factor. ... 150 Figure B. 1: Temperature of cavity center plane viewed from the front side of the unit when
reactor is parallel to port at t=3000 seconds under 300 W irradiation for initial
m odel w ithout air convection. ... 153
Figure B.2: Temperature of cavity and waveguide center plane viewed from the right side of the unit when reactor is parallel to port at t=3000 seconds under 300 W irradiation
for initial m odel without air convection. ... 153
Figure B.3: Temperature of cavity center plane viewed from the front side of the unit when reactor is perpendicular to port at t=3000 seconds under 300 W irradiation for
initial m odel w ithout air convection. ... 154 Figure B.4: Temperature of cavity and waveguide center plane viewed from the right side of
the unit when reactor is perpendicular to port at t=3000 seconds for under 300 W irradiation initial m odel without air convection. ... 154
Figure B.5: Temperature of cavity center plane viewed from the front side of the unit when reactor is parallel to port at t=3000 seconds under 300 W irradiation for
k-estim ation m odel... 155
Figure B.6: Temperature of cavity and waveguide center plane viewed from the right side of the unit when reactor is parallel to port at t=3000 seconds under 300 W irradiation
for k-estim ation m odel... 155
Figure B.7: Temperature of cavity center plane viewed from the front side of the unit when reactor is perpendicular to port at t=3000 seconds under 300 W irradiation for
k-estim ation m odel... 156
Figure B.8: Temperature of cavity and waveguide center plane viewed from the right side of the unit when reactor is perpendicular to port at t=3000 seconds under 300 W
irradiation for k-estim ation m odel... 156
Figure B.9: Temperature of cavity center plane viewed from the front side of the unit when reactor is parallel to port at t=1000 seconds under 300 W irradiation for laminar flo w m o d el... 157
Figure B. 10: Temperature of cavity and waveguide center plane viewed from the right side of the unit when reactor is parallel to port at t=1000 seconds under 300 W irradiation for lam inar flow m odel... 157
Figure B. 11: Temperature of cavity center plane viewed from the front side of the unit when reactor is perpendicular to port at t=1 000 seconds under 300 W irradiation for
lam inar flow m odel... 158
Figure B.12: Temperature of cavity and waveguide center plane viewed from the right side of the unit when reactor is perpendicular to port at t=1000 seconds under 300 W
irradiation for lam inar flow m odel... 158
Figure C. 1: GC-FID chromatography for condensation reaction with glycerol jacket at 140
'C , 10 m in residence tim e... 160
Figure C.2: NMR spectrum of solvent deuterated chloroform... 162
Figure C.3: NMR spectrum of internal standard 1,3,5-trimethoxybenzene. ... 163
Figure C.4: GC-FID chromatography for Fischer indolization of cl at 180 'C, 3 min residence tim e . ... 16 4 Figure C .5: G C m ass spectrum for ci... 165
Figure C.6: NMR spectrum for crude collection of ci at 180 'C, 3 min residence time. ... 165
Figure C.7: NMR spectrum for purified cl at 180 'C, 3 min residence time... 166
Figure C.8: GC-FID chromatography for Fischer indolization of c2 at 170 IC, 3 min residence tim e . ... 16 7
Figure C .9: G C m ass spectrum for c2... 168
Figure C.10: NMR spectrum for crude collection of c2 at 170 'C, 10 min residence time. ... 168 Figure C. 11: NMR spectrum for purified c2 at 170 'C, 3 min residence time... 169
Figure C.12: GC-FID chromatography for Fischer indolization of c3 at 180 'C, 15 min
resid en ce tim e. ... 170
Figure C .13: G C m ass spectrum for c3... 171
Figure C.14: NMR spectrum for crude collection of c3 at 180 'C, 20 min residence time. ... 171 Figure C. 15: NMR spectrum for purified c3 at 180 'C, 30 min residence time... 172
Figure C. 16: GC-FID chromatography for Fischer indolization of c4 at 180 'C, 30 min
resid en ce tim e. ... 173
Figure C .17: G C m ass spectrum for c4... 174 Figure C.18: NMR spectrum for crude collection of c4 at 180 'C, 20 min residence time. ... 174 Figure C. 19: NMR spectrum for purified c4 at 180 'C, 20 min residence time... 175 Figure C.20: GC-FID chromatography for Fischer indolization of c5 at 180 'C, 10 min
resid en ce tim e. ... 176
Figure C .21: G C m ass spectrum for c5... 177
Figure C.22: NMR spectrum for crude collection of c5 at 180 'C, 3 min residence time. ... 177 Figure C.23: NMR spectrum for purified c5 at 180 'C, 3 min residence time... 178
LIST OF TABLES
Table 1.1: Loss tangent values of selected solvents at 2.45 GHz, 20 aC.5 ... . . . 29
Table 1.2: Sample scope of chemistries run under microwave irradiation. ...... . . . 35
Table 2.1: Diels-Alder results compared with literature data... 55
Table 3.1: Parameters used for microwave geometry in COMSOL... 66
Table 3.2: Material electrical properties used in the simulation.1,77 ... ... ... . . 67
Table 3.3: Effective thermal conductivities, equivalent heat transfer coefficients, and Nusselt numbers for k-estimation models of parallel-to-port reactor. (Nurectangular
calculated from reference 87) ... 77
Table 3.4: Effective thermal conductivities, equivalent heat transfer coefficients, and Nusselt numbers for k-estimation models of perpendicular-to-port reactor. (Nurectangular calculated from reference 87)... 78
Table 3.5: Rayleigh numbers of the air gaps in the microwave unit at different reactor
positions and different power settings. ... 80
Table 4.1: Condensation results and kinetic mean temperature calculations from 1st spiral
m icroreactor ... 90
Table 4.2: Microwave heating rate versus irradiation power for spiral reactor channels with acetic acid . ... 9 5
Table 5.1: Condensation results and kinetic mean temperature calculation from spiral
microreactor at parallel-to-port position... 107
Table 5.2: Condensation results and kinetic mean temperature calculation from spiral
microreactor at perpendicular-to-port position... 107
Table 5.3: Condensation results and kinetic mean temperature calculation from spiral
microreactor heated with glycerol bath. ... 110
Table 5.4: Laminar flow and creeping flow simulation comparison... 112 Table 5.5: Results from spiral reactor flow simulations with acetic acid as solvent and 6 W
m icrow ave irradiation... 114 Table 5.6: Optimization of phenylhydrazine and cyclohexanone indolization with microwave
Table 5.7: Synthesis of indole derivatives with microwave spiral microreactor... 125 Table A. 1: Diels-Alder results in batch mode. ... 148
LIST OF SCHEMES
Scheme 1.1: Friedel-Crafts benzylation of deuterated p-xylene with results reported by
44
D udley and Steigm an. ... 34 Scheme 1.2: Biginelli three-component reaction that generates DHPM library. Numbers stand
for the potential number of compounds that can be used or generated."... 35 Scheme 2.1: Diels-Alder reaction of isoprene and maleic anhydride... 54 Scheme 2.2: Condensation reaction of o-phenylendiamine and acetic acid... 54 Scheme 2.3: Aromatic substitution of 2-chloropyridine with piperidine. ... 54 Schem e 5.1: Fischer indole synthesis. ... 122 Scheme 5.2: Fischer indolization of phenylhydrazine and cyclohexanone to
CHAPTER 1. MOTIVATION AND BACKGROUND
1.1 Motivation
The goal of the thesis research is to engineer microreactor setups that can perform microwave-assisted organic flow synthesis with rigorous experiments in order to obtain a better characterization of microwave heating and probe its benefits. In specific, the aims were to integration the microreactor system with an automated platform for reaction screening, and perform kinetic studies of microwave reactions.
Microwave-assisted organic synthesis (MAOS) has become increasingly popular ever since microwave irradiation was first introduced to organic synthesis in 1986. - The rising
interest in this field is due to the numerous advantages brought about by the unique mechanisms of microwave heating.3 The main advantage of microwave heating is the dramatic increase in heating rate compared with conventional heating since molecules in the reaction mixtures can absorb the microwave energy directly within a microwave-transparent vessel. The reactions in microwave synthesis therefore result in less reaction time, higher yields, and cleaner profiles.3 Other benefits include the abilities to superheat solvents under atmospheric pressure4 and to heat certain components selectively.5 Selectively heating different reaction components under microwave have led to reports of novel reaction pathways and product distributions that differ from conventional heating under the same temperatures. 67 The ability to collect data rapidly and the potential to expand chemical space make MAOS attractive to the fields of kinetic studies,8 high-throughput synthesis, chemical/drug discovery and reaction optimization.2' 9-10
However, by the start of this thesis project, most of the work on microwave synthesis had been done in batch mode. The preparation and cleanup steps required in batch reactions are considerably time and labor intensive even when most microwave units come with a robotic handler for the vials. These problems were especially hindering when a large amount of data and experiments are required." In addition, batch experiments often leads to inaccurate data collection, such as the vapor build up in headspace resulting in higher concentration measurement and residue heat from slow quenching resulting in longer actual residence time than intended.'2 This is especially important for microwave experiments since the reactions run
cause behind most extraordinary chemistry results that mislead scientists to believe microwave has non-thermal effects on chemistry. Furthermore, the limitations of batch reactors create the main challenges in bringing microwave synthesis from laboratory scales to production scales.1415
Some of these scale-up issues include the restriction on the size of the reactors due to the penetration depth of microwave irradiations, the requirement of significantly higher power supply to heat up larger volumes, the need for complicated cooling systems, and the reduction of energy efficiency in turning electricity into microwave irradiation when going up to large volumes.14
-16 Therefore, there has been significant interest in performing microwave reactions in continuous flow conditions in order to address the above issues. There are only a few examples of continuous flow systems for microwave reactions, and none of them have been applied to kinetic modeling or high-throughput synthesis. 17-21
Microreactor setups have the ability to operate microwave reactions in continuous flow format. This advantage allows us to prevent the previously mentioned data inaccuracy and scale-up issues and to perform large numbers of experiments faster, which is extremely advantageous
22
for high-throughput screening. In addition, continuous processes reduce material costs, improve process safety, and provide easier scaling.23-24
The small channel size of microreactors also provides numerous advantages. The small reaction volumes of microreactors greatly decrease chemical consumption in experiments, and thus reduce the cost for high-throughput testing. The reduced amount of toxic or hazardous materials in the microreactors at any time point also makes the processes safer for dangerous chemistries. 2-26 In addition, the large surface to volume ratios and small length scales of the channels allow fast mass and heat transfer in microreactors, therefore leading to faster and more uniform mixing of reactants and more uniform heating where isothermal conditions can easily be achieved. The large surface to volume ratio is also beneficial for additional features, such as coating catalysts along the surfaces.
Furthermore, many of the advantages of microwave heating, such as less reaction time, higher yield, and purer products, are also found with microreactors without microwave heating.27 Therefore, the comparisons of kinetic data of reactions in microreactors with conventional heating and with microwave heating gives insight into the basic phenomena of microwave effects and helps us evaluate the usefulness of microwave synthesis on reaction screening with microreactors.
1.2 Microwave-assisted Organic synthesis
1.2.1 Microwave Heating MechanismMicrowaves are electromagnetic radiation that consists of oscillating electric fields and magnetics fields in between the frequency of 300 MHz to 300 GHz. Most microwave units in chemistry lab operate at 2.45 GHz. The energy of microwave photon at 2.45 GHz is only 0.0016 eV, much lower than molecular bond energies, and is therefore unable to start chemical reactions
by cleaving molecular bonds. Instead, microwave induces heating by dipolar polarization and
ionic conduction.5 The dipoles and ions of the materials under microwave irradiation will
continuously adjust their positions to align with the oscillating electric field. During the realignment, energy is turned into heat through dielectric loss and molecular friction, and the process is called dielectric heating.5, 28-29 The ability of materials to absorb microwave energy
and convert them into heat thus depends on their dielectric properties, which is expressed as the complex permittivity:30-31
E = E - (1.1)
The real part of the permittivity is the lossless term and stands for how well the material absorbs and propagates the microwave energy, while the imaginary part of the permittivity is the energy loss term and stands for how well the material converts the microwave energy into heat.
The loss tangent is then defined as the ratio of the lossy portion in the electric field to the lossless reaction:30
tan6= - (1.2)
The permittivity, and therefore loss tangent, is dependent on the frequency and temperature that the material in under (Table 1.1). The larger the loss tangent of a material, the faster it heats up under microwave irradiation.3,5,29
Table 1.1: Loss tangent values of selected solvents at 2.45 GHz, 20 oC.5
Solvent / Material tan5 Solvent / Material tan6
ethylene glycol 1.350 1,2-dichloroethane 0.127
ethanol 0.941 water 0.123
DMSO 0.825 chlorobenzene 0.101
2-propanol 0.799 chloroform 0.091
formic acid 0.722 acetonitrile 0.062
Solvent / Material tan6 Solvent / Material tan6 nitrobenzene 0.589 acetone 0.054 1 -butanol 0.571 tetrahydrofuran 0.047 2-butanol 0.447 dichloromethane 0.042 1,2-dichlorobenzene 0.280 toluene 0.040 NMP 0.275 hexane 0.020
acetic acid 0.174 Pyrex 0.010
DMF 0.161 Telfon 0.0015
1.2.2 Microwave Heating Effects and Applications
The fact that different materials couple with microwave radiation differently leads to many benefits and applications. The key advantage is volumetric heating, where reactants can be heated up directly when placed in a microwave transparent vessel (tan6 < 0.01), such as Pyrex/glass or Telfon containers. The reactants can therefore be heated up faster to higher temperature regimes that cannot be easily achieved by conventional heating. This in turn leads to greatly reduced reaction times and higher conversions for many reactions.3, 32
In addition, studies have shown that microwave radiation can superheat organic solvents under atmospheric conditions (Figure 1.1).4'33 The extent of the super-heating temperature from a solvent's classic boiling point varies with different solvent and can be as high as 40 'C and is useful in expanding the range of data collection for kinetic studies, as demonstrated by Chemat et al. with the esterification reaction of benzoic acid in excess of methyl alcohol catalyzed by sulphuric acid (Figure 1.2).4 However, this feature is not often employed since most microwave reactions are run under sealed vessel conditions, where pressures are allowed to rise above the
atmospheric temperature.5
Other special techniques in microwave heating include putting small traces of strongly microwave absorbing materials into reaction solutions that are weaker in absorbing microwave
energy in order to improve the heating effect, or to add thin metal catalyst inside the solutions to create small hot spots where the reactions take place.5'9 For example, the Kappe group added
1-butyl-3-methylimidazolium hexafluorophosphate (bmimPF6), a strongly microwave absorbing ionic liquid, to aid the intramolecular hetero-Diels-Alder reaction of alkenyl-tethered pyrazinone in 1,2-dichloroethane. The original reaction took an hour to complete while the reaction with the ionic liquid added was complete in 13 minutes since it was able to reach a higher temperature in a much small time range.9
T (GC) C T.= 88 *C 090
80
-... - -- - - - - -. --..--- 4oOOOOOoOO* 70 0 B Bp78 0C 60 50 40 0 3030 A 20 10 0 100 200 300 400 500 600 time (s)Figure 1.1: Microwave heating of ethanol under atmospheric pressure with 75W of 4
irradiation power.
0
Nmaewwavv ont% classical healing limits
V..
_P W.17 o O(S
4)1.m21
O. 1W 4)01 I Bp-700C I/T (K-')Figure 1.2: Kinetic data collected from microwave heating (o) and conventional heating (.) for esterification reaction.4
In addition to the benefits mentioned above, some people had suggested that microwave heating can also bring about "non-thermal effects.' 3 4 This topic have been highly controversial. Microwave reactions with rate-accelerated results or special product distribution that cannot be replicated by conventional heating are often suggested to exhibit non-thermal effects.34-3 In order to facilitate a clear discussion of how microwave can affect chemical reactions, C. Oliver Kappe proposed the following terms to describe the different attributes of microwave in organic reactions: (1) thermal effects, (2) specific microwave effects, and (3) non-thermal microwave
C
1i
0.0026
effects.5
Microwave chemistry enhancement that results from rapid heating and the ability to reach a higher temperature regime is categorized as displaying thermal effects. The rate enhancement or cleaner profile obtained under microwave heating is purely due to thermal/kinetic effect that can be explained with the bulk reaction temperature by the same Arrhenius equation as the one of the same chemistry under conventional heating. Kappe defines specific microwave effects as "accelerations of chemical transformations in a microwave field
that can not be achieved or duplicated by conventional heating, but essentially are still thermal effects. " These include the aforementioned microwave heating applications, such as
superheating solvents and selectively heating strong microwave-absorbing materials, and the elimination of wall effects that can result from conventional heating. For selectively-heated reactions that display specific microwave effect, not only are the reaction conditions hard to replicate without microwave, but the exact experimental temperatures are also hard to determine since the localized "hot spots" in the reaction is not the same as the bulk temperature. Non-thermal microwave effects include all other reaction accelerations that cannot be explained by thermal effect or specific microwave effect. It has been postulated that non-thermal effects result from the direct interaction of microwave electric field with specific reaction molecules.34 For
instance, if the reaction transition state is more polar than ground state, then the electric field can stabilize process of the reactants going to the transition state. This results in a lower activation energy that leads to increase in reactivity. It is also hypothesized that the rotation of the molecules may sometimes result in a higher pre-exponential factor in the Arrhenius equation. These effects are stated to be stronger in solvent-free reactions or in low microwave-absorbing solvents because the microwave can interact directly with the reactants instead of being "blocked" by polar solvents.29
, 34, 36-37 However, many author argues that differences in
microwave heating and conventional heating in these examples are due to inaccurate temperature readings in microwave units or other poor control of the reaction conditions. 35,38 Many reactions
that have been claimed to display non-thermal effect were found to produce the same results as conventional heating after careful reconstruction of the reactions in identical temperature settings.39-40 Kappe's group have been prominent in debunking many non-thermal microwave effect claims in the past decade by recreating reactions in microwave units with fiber-optic temperature setups that provide more accurate temperature measurements then the built-in IR sensors in typical microwave units (section 1.2.3 Microwave Units and Equipment).39 A
representative example is the Diel-Alder cycloaddition of phenylacetylene to methyl 2-oxo-2H-pyran-3-carboxylate reported by Loupy et al. in 2004. After reinvestigating the reaction with a fiber-optic temperature sensor, Kappe's group found that higher yield in Loupy's study under microwave irradiation compared to oil bath heating was due to the underestimation of the bulk microwave reaction temperature by the IR sensors.36, 39 Kappe's group has also assessed the
existence of non-thermal effect by investigating chemical transformations in a silicon carbide vial.40 4' Silicon carbide is a chemically inert material with high microwave absorbance and high thermal conductivity. Therefore, under microwave irradiations, the SiC vial converts the microwave field into heat and conducts the heat to the reaction such as in conventional heating settings, while a Pyrex vial will allow the reaction to be exposed to the microwave field. The chemistry results from a Pyrex vial and the SiC vial turn out to be the same under the same temperature setting, and therefore Kappe concluded that the microwave field does not affect the reactions.4
Due to the extensive effort place in the reinvestigation of microwave reactions, most scientists today agree that non-thermal microwave effect does not exist. However, disputes are still taking place over which reactions or reaction conditions qualify as displaying "specific microwave effects" and whether these reactions are significant enough for chemistry application. One of these examples was the arguments Gregory B. Dudley and Albert E. Stiegman had with C. Oliver Kappe over the Friedel-Crafts benzylation of both deuterated p-xylene and toluene that Dudley and Stiegman reported in 2012 (Scheme 1.1). 13, 42-44 The xylene and toluene in the reaction act as both reactants and microwave transparent solvents. Dudley and Stiegman proposed that the polar solute, 2-Benzyloxy- 1 -metylpyridinium BArF, is selectively heated up in the homogeneous solution, and therefore the solute reactivity is not only temperature dependent but will also be affected by the power of the microwave irradiation. They suggested the solute create local hot spots and collide more frequently on a molecular level, and thus increasing the pre-exponential factor in the Arrhenius equation and leads to a reactivity enhancement cannot be captured by the bulk temperature of the solution.44 This is an analogy to heterogeneous microwave reaction where solid catalysts are selectively heated amidst solvent with lower microwave absorbance. While they ran the xylene reactions under open vessel conditions, they ran a second series of toluene benzylation under reflux condition to ensure the reaction temperature is the same between the microwave irradiated and the oil bath experiments, and the
conversion rates were also higher under microwave irradiation." Kappe's group recreated the experiments with a fiber optic probe and reported the same conversions between the two heating methods, and therefore concluded that Dudley and Stiegman's observation is due to inaccurate temperature measurement and also superheating affects under atmospheric temperature.'3 They believe the reaction enhancement Dudley and Steigman reported was due to the increase of the bulk solvent temperature instead of solute hot spots. Dudley and Stiegman, however, refuted this argument since they claim Kappe did not accurately replicate their experiments: for the xylene microwave experiment, Kappe's group used a constant temperature setting at 100 'C with a lower microwave power irradiation; while for the toluene microwave experiment, Kappe's group added boiling chips to the solution. Dudley and Stiegman argue that the lower power settings diminished the high power steady-state microwave irradiation effect that they intentionally aimed for in their design, and that Kappe's group reported the same increased conversions as Dudley and Stiegman's original paper when boiling chips were not added in the toluene
experiments.42 Dudley and Steigman also ruled out superheating as the cause of increased reactivity since they added stir bars to all their experiments and also demonstrated the stirred toluene has the same temperature with and without boiling chips.4 2 In summary, Kappe believes the results Dudley and Stiegman observed can be explained by the bulk solution temperature, and the rate enhancement can be achieved by simply increasing the bulk reaction temperature.'3'
43 However, Dudley and Stiegman believe this is a case of selective heating of a homogeneous
solution, and with strategic experimental designs, reactions with polar solute in microwave transparent solvents can benefit from constant high power microwave irradiation; they encourage chemists to further explore this area.42
CD3 CDs
0 N D D Bn D
D D D D
F3CC CF3 CD3 CD3
1. Oil Bath, 1000C, 10min: 12% conversion F3C CF3 2. Steady-state Microwave Irradiation,
F3C CF3 [BArF] 300W, 10min: (<1000C), 86% conversion
Scheme 1.1: Friedel-Crafts benzylation of deuterated p-xylene with results reported by Dudley and Steigman."
Aside from the dispute on the nature and application of microwave effects, the potential of microwave heating to speed up the rate of synthesis for high-throughput synthesis and kinetic studies have also been anticipated and exploited.2' 8, 22, 45 An example of library synthesis by microwave is the generation of a dihydropyrimidine (DHPM) library by Biginelli multicomponent reactions (Scheme 1.2).2, 10 Reactions were carried out in an automatic
sequential format with sealed-vessel vials irradiated batch-wise. The microwave irradiation significantly increased the reaction rate and was able to screen 48 compounds in 12 hours. This is a great improvement compared to the traditional synthetic procedure of Biginelli reactions, which took some time between 2 to 12 hours to run one single reaction.'0
An example of microwave heating used in kinetic studies is the reevaluation of the Newman-Kwart Rearrangement by Gilday et al.8 The reaction they chose was one on which no specific or non-thermal microwave effect was reported. After demonstrating that microwave heating produced the same conversion as conventional heating, they collected a larger range of data with microwave synthesis. The analysis showed that the reaction order for the rearrangement changes with the reactant concentration as opposed to exhibiting a constant first order kinetic profile. The study demonstrates how data can be rapidly collected by microwave heating.
R2
0 H NH2 Ethanol, acetic acid, E
E .Ik '1 1 Lewis acid catalyst al NH R1 + R2 H + H2N z MW,120
0
C, 10-20 min R1 N Z
R3 R3
E=ester, acyl, amide, nitro; Z=0, S, NR; R-R3=H, alkyl, (het)aryll
Scheme 1.2: Biginelli three-component reaction that generates DHPM library. Numbers stand for the potential number of compounds that can be used or generated.2"0
As a summary, many types of organic reactions have been successfully conducted through microwave heating, and several examples are shown in Table 1.2. Detailed reviews can be found in reference 5.
Table 1.2: Sample scope of chemistries run under microwave irradiation.5 32
Reaction Type Example
CN Br Pd(OAc)2/ P(o-tolyl)3 NC CO2H
Heck Reactions - -,CO 2H Et3N, MeCN, I
Reaction Type Example
EtO2C CO2Et NO2 [(t-Bu)2P(OH)]2PdC2 NO2
Suzuki- Miyaura c + /\ K2CO3, THF, Me
Reactions I Me MW, 100 *C, 30 min M CO2Et
B(OH)2 77% - CO2Et
+ R-XN
Buchwald-Hartwig Nr CIH Pd(OAc)2, NaOtBu, BTF R N -N
Reactions X = N o. C MW, 150 *C, 15-20 min
R = H Me, Ph, Bn (50-95%) CI
Diels-Alder neat HfK
Reaction
Q
MW, 165 0C, 20 min 0 o 97%Nucleophilic NO2 ok NH2 2 eguiv. DIEA. EtOH.. NO2
Aromatic F + 5h, 1200C, MW NH Substitution 2 equiv. 81% 00 Multicomponent 0 + N Ac2O, p-TSA 9 NH 0 Synthesis 'NH 3 H MW, 150 *C, 20 min f N -0 90% 0
1.2.3 Microwave Units and Equipment
When the field of microwave organic synthesis started to emerge, most reactions were performed in domestic microwave ovens modified by the researchers. However, due to the increasing trend of microwave synthesis studies, dedicated microwave units have been developed which features better control and measurements of temperature, power, pressure, and ensures safety.5'46 A microwave reactor is composed of a magnetron which generates the microwave, a waveguide that transmit the microwave, and a cavity in which the microwave is resonated and energy is coupled.3" Different modes can be generated depending on how the energy is coupled inside the cavity. Microwave reactors can in turn be classified into two general types. The multimode reactors are like kitchen microwave ovens and can generate power up to 1000 to 1600 watts, but require rotation of the cavity because of the highly inhomogeneous energy field they generate. The low power density also prevents small-scale synthesis (< 3 mL) inside multimode reactors. Therefore, most of the lab scale processes right now are performed in single-mode reactors, where the energy field is relatively homogeneous and high in density.5
Single-mode microwaves generally have a more accurately designed waveguide that directs the irradiation waves to a confined cavity at a fixed position in which the reaction sample is loaded. Several companies provide single-mode microwave reactor units for lab-scale organic synthesis.' " The waveguides of the models come in different shapes that direct the irradiation into the cavity through different geometries (Figure 1.3). Different units also include different features of control and different formats to process the reactions. In general, single-mode microwave units can provide power output up to 300 to 400W and can operate either under constant power output, or use the power output to regulate the temperature or pressure of the reaction with the help of temperature sensors, pressure sensors, and a control program. The reaction vials are placed in the cavities and are usually irradiated one at a time. The volume of the vials can range anywhere between 0.2 mL to 80 mL. Although some units allow the reactions to run under open-vessel conditions, most units use vials designed with a sealed cap that allows the reaction pressure to go up to around 20 bar. In order to increase the speed of this type of batch-wise experiment, several companies offer integration of an automated system, where a robotic gripper can be used to handle a set of vials. The only commercial single-mode microwave units that can run reactions in flow are the CEM Voyager® systems. These microwave units come with reactors made out of glass or Teflon coils, and can be run in continuous flow or stop flow mode (Figure 1.4). The reactors come in volumes of 10 or 80 mL and can allow flow rates up to 20 mL/min. The operation limit is 250 'C and 17 bar.5 In addition to the above features, microwave units often come with a compressed-air cooling application that can be used to cool the sample after the reaction or to achieve simultaneous cooling of the reaction vessel while the samples are being heated up by microwave irradiation.