Development
of an In Vitro Model
of Contraction by Fibroblasts
by Toby M. Freyman B.S., Engineering Physics Syracuse University, 1996Submitted to the Department of Materials Science and Engineering in Partial Fulfillment of the Requirements for the
Degree of
Doctor of Philosophy in Materials Engineering at the
Massachusetts Institute of Technology June 2001
© 2001 Massachusetts Institute of Technology
All rights reserved
Signature of Author ----,
___r_--~___r_---nd Engineering M~ 4, 2001
Certified by---;--,c-=:;::::;::;;:;:::::;;
Lorna
J.
GIbson Matoulas S. SalapatasProfessor of Materials Science and Engineering Thesis SupervisorCertified by_
Ioannis V. Yannas Professor of Polymer Science and Engineering Thesis Supervisor Accepted by ~=_..._.:'~~~...,-___t_-~ __ ---_ ~ HarryL.Tuller lectronic Materials n Graduate Students
,
Room 14-0551 77 Massachusetts Avenue Cambridge, MA 02139 Ph: 617.253.5668 Fax: 617.253.1690 Email:docs@mit.edu http://libraries.mit.edu/docs
MITLibraries
Document ServicesDISCLAIMER
OF QUALITY
Due to the condition of the original material, there are unavoidable
flaws in this reproduction. We have made every effort possible to
provide you with the best copy available. If you are dissatisfied with
this product and find it unusable, please contact Document Services as soon as possible.
Development
of an In Vitro
Model of Contraction by Fibroblasts
by Toby M. Freyman
Submitted to the Department of Materials Science and Engineering on May 4, 2001 in Partial Fulfillment of the
Requirements for the Degree of Doctor of Philosophy in Materials Engineering
Abstract
Dermal scars in adult humans are mechanically and functionally inferior to normal skin and can be physically disfiguring. The contraction of the wound by fibroblasts has been linked to the formation of scar. The mechanical and chemical signals, which control the contraction, are being investigated through the use of models of fibroblast contraction to understand the conditions which promote tissue regeneration. A cell force monitor (CFM) was designed and constructed to measure quantitatively the contraction of a highly-porous, collagen-GAG matrix by fibroblasts. .Using this device, contractile force, displacement, and kinetics were compared for different values of cell density and total stiffness resisting fibroblast contraction. In addition, observation of live cells contracting individual matrix struts established the cellular mechanisms responsible for the matrix contraction measured in the CFM.
Observation of live cells revealed that macroscopic contraction of the collagen-GAG matrix was the result of forces generated during cell elongation. Contractile force
normalized by the number of attached cells (~1 nN per cell) was independent of cell density (400 - 2,000 cells/mrrr') and total stiffness resisting contraction (0.7.:. 10.7 N/m). Total contractile force was dependent on the cell density. These results indicated that the contractile force developed during fibroblast elongation was determined at the level of individual cells (not cooperatively) and was limited by force per cell (not displacement per cell).
The kinetics of macroscopic matrix contraction were also independent of cell density and system stiffness; contractile force reached an asymptotic value in ~ 15 h. Observation of live cells found the macroscopic time dependence likely resulted from the stochastic nature of cell elongation initiation and the time required for the fibroblasts to elongate completely (~2-4 h). Therefore, the time dependence of macroscopic matrix contraction did not reflect the time dependence of force generation by individual fibroblasts, but rather an average for the entire population.
Thesis Co-Supervisor: Lorna
J.
GibsonTitle: Matoulas S. Salapatas Professor of Materials Science and Engineering Thesis Co-Supervisor: Ioannis V. Yannas
Aclmowledgements
Although I have been receiving the handshakes and congratulations for the successful completion of my thesis, my advisors Lorna (prof. Gibson) and Prof. Yannas deserve a large part of the recognition. I thank you both for believing in me from the beginning and helping me to learn and grow as a doctoral student at MIT. You both will always have my respect and gratitude. In addition, I was extremely lucky to have had a "third advisor" in Prof. Spector. Your comments and enthusiasm about contraction caused
0
cellsmore than once helped put me on the right track and understand my thesis on a more fundamental level. Finally, I would like to thank Prof. Subra Suresh and Prof. Doug Lauffenburger for your help and guidance with my thesis.I owe a special thanks to Dr. John Germaine and Sandra Taylor. Without Dr. Germaine's experience and advice on the design of the CFM I would still be trying to track down the source of the electronic drift! And, without Sandra's histology expertise my thesis would have be devoid of images of cells on matrix.
I would also like to thank the members of the Fibers and Polymers Lab at MIT, Prof. Spector's lab at the Brigham, and the Cellular Solids Group at MIT. Particularly, Lila, Donna, Mark, Bernie, Cyndi, Rayka, Shona, Courtney, Nick, Martha, and Tara for the friendly conversation and invaluable advice in the lab which surely helped and put things into perspective along the way.
Last but not least, I would like to thank my family and friends for their love and support. I give all of you most of the credit for where I am today. Thank you Mom, Dad and Todd for always pushing me to do my best and supporting me when I didn't quite make it. A special thanks to Todd and Amy for the amazing Sunday night dinners up in Andover.
Finally, to Krystyn who is by far the most important and treasured thing MIT introduced me to. Your love, caring, and, of course, understanding has made the last three years of my PhD work the best (did the last sentence have enough commas KJ?). Not only did you proof read my entire thesis more than once, just looking at you reminded me that work is not the most important thingin my life.
Table of Contents
Abstract 3 Ackno\vledgements 5 Table of Contents 7 List of Figures 11 List of Tables 13Chapter 1. Introduction and Background 15
1.1 Models for the Study of Contraction 18
1.1.1 In Vivo Models of Contraction 18
1.1.2 In Vitro Models of Contraction 19
1.2 The Cell Force Monitor 23
1.2.1 Choice of Substrate 23
1.2.2 Choice of Cell Type 24
1.2.3 Design Parameters of the CFM 24
1.3 Project Goals and Overview 25
Chapter 2. Microstructure and Mechanical Properties of the Collagen-GAG Matrix27
2.1 Introduction 27
2.2 Materials and Methods 28
2.2.1 Collagen Matrices 28
2.2.2 Matrix Pore Diameter 29
2.2.3 Mechanical Testing of the Collagen-GAG Matrix 31
2.3 Results 36
2.3.1 Matrix Pore Diameter 36
2.3.2 Tension Testing 37
2.3.3 Compression Testing 38
2.4 Discussion 39
2.4.1 Comparison of Collagen-GAG Matrix with Other Foamed Materials 39 2.4.2 Macroscopic Mechanical Properties of the Collagen-GAG Matrix 39
2.5 Conclusions 41
Chapter 3. Design and Testing of the Cell Force Monitor (CFM) .43
3.1 Introduction 43 3.2 Device Design 44 3.2.1 Strain Gage CF1-1 46 3.2.2 Proximity Sensor CFM 47 3.3 Methods 48 3.3.1 Measurement of Drift 48 3.3.2 Calibration of the CFJ'vl 48
3.3.3 Cell Seeding and Force Measurement Assay 50
3.4 Results 51
3.4.1 Measurement of Drift 51
3.4.2 Calibration of the CFM 52
3.5 Discussion 55
3.5.1 Device Design 55
3.5.2 Functionality of Device 56
3.5.3 Force Measurement 56
Chapter 4. Effect of Attached Cell Number on Contraction of the Collagen-GAG
Matrix 59
4.1 Introduction 59
4.2 Methods 62
4.2.1 Cell Culture 62
4.2.2 Cell Seeding and Force Measurement Assay 63
4.2.3 Cell Counting and Histology 64
4.2.4 Statistical Methods 66
4.3 Results 66
4.3.1 Contractile Response 66
4.3.2 Attached Fibroblast Number with Time 68
4.4 Discussion 69
4.5 Conclusions 74
Chapter 5. The Micromechanics and Cellular Mechanisms of Fibroblast Contraction
of Collagen-GAG Matrices 77
5.1 Introduction 77
5.2 Methods 80
5.2.1 Measurement of Cell Aspect Ratio with Time 80
5.2.2 Immunohistochemical Identification of Myofibroblasts 81
5.2.3 live Cell Imaging 83
5.3 Results 84
5.3.1 Aspect Ratio Measurement 84
5.3.2 Myofibroblast Identification 86
5.3.3 live Cell Imaging 87
5.4 Discussion 95
5.4.1 Cell Processes linked to Microscopic Matrix Deformations 95
5.4.2 Microscopic Deformations Leading to Macroscopic Matrix Contraction 97
5.4.3 Time Dependence of Contraction 98
5.4.4 Micromechanical Model of Contraction on Collagen-GAG Matrix 99
5.5 Conclusions 103
Chapter 6. Effect of Stiffness on Fibroblast Contraction 105
6.1 Introduction 105
6.2 Methods 107
6.2.1 Collagen Matrices 107
6.2.2 Quantitative Measurement of Contraction Using the Cell Force Monitor 107
6.2.3 Fibroblast Morphology Determination 110
6.2.4 Free-Floating Experiments 111
6.2.5 Statistical Methods 112
6.3 Results 112
6.3.1 Quantitative Contraction Measurement Using the CFM 112
6.4 Discussion 118 6.4.1 Asymptotic contractile force is independent of total stiffness 118
6.4.2 Force Generation is a Homeostatic Level 119
6.4.3 The Cellular Mechanism of Matrix Contraction 120
6.4.4 Fraction of fibroblasts participating in contraction 122
6.4.5 Matrix stiffness affects contraction occurring over several days 122
6.5 Conclusions 124
Chapter 7. Conclusions 125
References 127
Appendix A. Collagen-Glycosaminoglycan Matrix Production 133
Appendix B. Cell Culture Protocols 135
Appendix C. Mechanical Testing of Collagen.GAG Matrix 141
C.l Tension Testing Protocol 141
C.2 Compression Testing Protocol 156
Appendix D. Pore Diameter Determination 163
D.1 Type-I Collagen Immunohistochemical Staining Protocol.. 163
D.2 Image Capture and Analysis Protocol 164
D.3 Linear Intercept Macro Code 166
Appendix E. Cell Force Monitor 171
E.l Construction 171
E.2 Calibration Protocol 178
E.3 Contraction Experiment Setup Protocol... 179
E.4 Variation on Cell Seeding of Collagen-GAG Matrix Samples 181
E.5 Non-linear Regression Analysis of CFM Data 182
E.6 Annotated Labview Code 183
Appendix F. Free-Floating Matrix Contraction 193
Appendix G. Histology 195
G.l Paraffin Embedding ProtocoL 195
G.2 Glycomethacrylate Embedding Protocol... l96
G.3 Hematoxylin and Eosin Staining Protocol 197
G.4 a-Smooth Muscle Actin Staining Protocol 198
G.5 Image Capture and Analysis Protocol (aspect ratio) 201
List of Figures
Figure 1.1 Schematic showing the structure of normal skin 16
Figure 1.2 Schematic showing contraction of an unrestrained, fully restrained, and
restrained-and-released cell-seeded, collagen gel. 21
Figure 2.1 Micrographs showing the microstructure of a polyethylene foam, a sponge, and
the collagen-GAG matrix. . 28
Figure 2.2. A two-dimensional section of matrix from confocal fluorescent microscopy used in the pore diameter analysis and a representative polar coordinate plot of the linear intercept length and the corresponding best-fit ellipse. . 31
Figure 2.3. Collagen-GAG matrix tensile testing setup 32
Figure 2.4. Images used for the optical strain measurement technique in the tensile tests 34 Figure 2.5. Schematic of compression testing setup utilizing the CFM. .. 36 Figure 2.6. Tension stress-strain curve of hydrated collagen-GAG matrices at 37°C. 37 Figure 2.7. Representative compression stress-strain curve of hydrated collagen-GAG
matrix 38
Figure 2.8. Tensile and compressive stress-strain curves representative of elastomeric
foams 40
Figure 3.1. Schematic of the strain gage cell force monitor (CFM). .. .45 Figure 3.2. Schematic of the proximity sensor cell force monitor (CFM). .. .46 Figure 3.3 Plot of voltage over time for the strain gage CFM, in the incubator, to show the
response with nothing attached to the beam. . 51
Figure 3.4 Plot of voltage over time for the proximity sensor CFM, in the incubator, to
show the response with nothing attached to the beam. .. 52
Figure 3.5. Strain gage CFM displacement and force calibration plots. .. 53 Figure 3.6. Proximity sensor CFM displacement and force calibration plots 54 Figure 3.7. Force over time plot from the CFM for a cell-free matrix sample and a cell
seeded matrix sample. . 55
Figure 4.1. Attached cell number variation with time for two different values of cell
number seeded. . 65
Figure 4.2. Contractile force plotted against time, for several densities of attached
fibroblasts at 22 hours (cell number in millions) 67
Figure 4.3 Asymptotic force plotted against number of attached cells per sample at 22
hours 68
Figure 4.4 Force plotted against attached cell number per sample at 22 hours, showing a
Figure. 4.5. Hematoxylin and eosin stained sections of fibroblast-seeded, collagen-GAG matrix to show differences in fibroblast morphology at 0 and 22 hours post seeding. 74 Figure 5.1. Schematic of clamping system used to hold cell-seeded matrices for average cell
aspect ratio determination 81
Figure 5.2. Schematic of live cell imaging setup. . 84
Figure 5.3. Light micrographs of H&E stained sections of cells attached to the
collagen-GAG matrix fixed at 0,8, and 22 hours post-seeding 85
Figure 5.4. Plot of average aspect ratio of fibroblasts with time seeded on the
collagen-GAG matrix 86
Figure 5.5. Histogram showing the frequency of fibroblast aspect ratios at different times
post-seeding. . 87
Figure 5.6. Sequence of images depicting a cell simultaneously elongating and deforming a
matrix strut. . 89
Figure 5.7. Sequence of images showing a cell elongating and deforming matrix struts. ..90 Figure 5.8. Cell, 2 hand 25 m after seeding, which had attached to the matrix and
elongated. Addition of isopropyl alcohol revealed matrix relaxation following cell
death 91
Figure 5.9. Sequence of images depicting a cell deforming a matrix strut 92 Figure 5.10. Sequence of images showing a cell which elongated on a matrix strut almost 2
hours after attachment. After significant elongation, adhesion sites near the cell center began to release and eventually catastrophic failure of attachment at one end of the cell resulted in rapid retraction of the cell and a slight matrix relaxation. .. 93 Figure 5.11. Sketches of cell elongation, showing attachment sites forming at cell
extensions and showing a gap between the cell and strut. Free body diagram of forces, showing tension in the actin fibers, compression in the matrix strut and the resulting balance at the attachment site. Sketches showing cell attached at a strut junction
resulting in bending of the struts due to the force developed by the cell. . 102 Figure 6.1 Plot of displacement per cell over time for different total stiffnesses. .. 113 Figure 6.2 Plot of force per cell over time for different total stiffnesses. .. 114 Figure 6.3 Histogram showing the distribution of aspect ratios at 22 h post-seeding for
cells cultured under two different total stiffnesses 115
Figure 6.4 Plot showing the effect of initial matrix stiffness on the average reduction in diameter of free-floating matrix disks over two weeks in culture. .. 116 Figure 6.5. Light micrographs of H&E stained GMA sections of free-floating matrix
samples showing cell distribution and matrix microstructure changes with time. ...117 Figure 6.7. Schematic showing the centripetal motion of adhesion sites and the centrifugal
List of Tables
Table 3.1. Calibration factors for the CFMs 53
Table 4.1. Exponential curve fit parameters (1;
FJ
for cell density CFM experiments 71Table 4.2. Force per cell values from data reported by other investigators. . 72
Table 6.1. Total system stiffnesses for CFM experiments 109
Table 6.2. Exponential curve fit parameters for CFM experiments with a change in total
Chapter 1. Introduction and Background
In adult humans, the healing of dermal wounds results in the formation of scar
tissue. Compared to the tissue which it replaces, scar tissue is mechanically weaker [1],
physically disfiguring, and can lead to the restricted motion of joints. The formation of scar
tissue is accompanied by and has been linked to wound contraction [2,3]. Contractile
fibroblasts which migrate into the wound site are responsible for both the synthesis of the
scar tissue and the associated contraction [2, 4]. In an attempt to understand the process of
wound contraction and scar formation, these cells and their associated processes have
received much attention in the past three decades.
Normal human dermis is composed of two layers, the epidermis and the dermis,
separated by a basement membrane (Fig. 1.1). The epidermis is composed entirely of cells
and regenerates spontaneously following injury, provided that a portion of the underlying
dermis is still present. The dermis is composed of the following components: extra-cellular
matrix (ECM) proteins (primarily type-I collagen), proteoglycans, fibroblasts, blood vessels,
and nerve fibers. The ECM proteins provide a scaffold for the fibroblasts and, along with
the proteoglycans, are responsible for the mechanical properties of the skin. In normal
dermis, the collagen fibers are randomly oriented, forming an isotropic structure. In
contrast, scar tissue is composed of highly planar collagen fibers that can exhibit a preferred
alignment [5]. The direction of collagen fiber alignment is determined by the direction of
highest tension in the healing wound. In addition, scar is less vascularized than normal
hYPOdermiS] (SUbeutaneo~
layer)
~ oUgland ~ hair fO~lIel"l blood vessels91~seWadsworth Publishing CompoinyllTP
Figure 1.1 Schematic showing the structure of normal skin (http://www.as.wvu.edu/-rbrundage/) [Brundage, R. 2000]. ens,ory neuron swea1 gland smooth muscle bEAMIS
In adult humans, dermal wounds close through the synthesis of scar tissue and
contraction of the wound margins [2, 4]; regeneration of the dermis does not occur
spontaneously [3]. Wound contraction occurs due to forces generated by fibroblasts which,
through differentiation stimulated by factors in the wound environment, have acquired some
characteristics of smooth muscle cells [4]. These differentiated, contractile fibroblasts have
been termed myofibroblasts [4,6].
Dermal wound healing occurs through several well-characterized steps starting with
the formation of the blood clot immediately following injury [2]. The blood clot
re-establishes hemostasis and provides a scaffold for the migration of cells into the wound.
Monocytes from the blood then enter the wound and differentiate into macrophages. The
the wound site from the surrounding tissue. Fibroblasts then proliferate and synthesize new
collagenous ECM. Simultaneously, new blood vessels form through the process of
angiogenesis to supply the newly forming tissue with oxygen and nutrients. Due to the
granular appearance of the new ECM and blood vessels, this composite structure has been
termed 'granulation tissue'. After approximately the 2nd
week following injury, fibroblasts in
the wound site differentiate into myofibroblasts [2]. These cells are responsible for the
contraction of the wound [4, 6, 7], a process which reduces the amount of new tissue which
must be formed. The differentiation of fibroblasts into myofibroblasts has been shown to
depend, in part, on the resistance of the wound to contraction. The resulting ECM in scar
tissue is made mosdy of collagen aligned along the direction of highest tension at the wound
site. Thus, the mechanical forces present during wound healing regulate the function of the
myofibroblasts and the architecture of the tissue which forms.
Inhibition of dermal wound contraction by myofibroblasts, using a highly specific
collagen-GAG matrix, has been linked to the blockage of scar tissue formation and leads to
the regeneration of the dermis [3]. The exact mechanisms through which this matrix
facilitates the regeneration of skin have not been elucidated. Although wound contraction is
not observed in wounds grafted with the collagen-GAG matrix, the myofibroblasts
responsible for contraction are still present in the wound. Regeneration of the dermis in situ
is a significant contribution in the effort to encourage tissues or organs to retain functionality
following injury. A more detailed understanding of this process may lead to successful
treatments for more complex tissues.
Myofibroblasts have been identified in many wounded/ diseased tissues (e.g., skin [4,
6,7], peripheral nerves I8], anterior cruciate ligament [9], cirrhotic liver [10], asthma
tissue engineered scaffolds would be greatly improved by a thorough knowledge of the
processes by which these cells synthesize and remodel new tissue and the mechanical,
chemical, and physical signals which control them.
1.1 Models for the Study of Contraction
The complex process of the development of contractile force by fibroblasts and the
myriad factors which influence it motivate the development of experiments with which this
phenomenon can be studied. The ideal experimental system will allow the investigator to
monitor all mechanical and chemical signals which result from and affect the contractile
force without disturbing the wound healing environment. This ideal system is approximated
by both in vivo and in vitro models to study the development of contractile force by
fibroblasts.
1.1.1 In Vivo Models of Contraction
The study of experimentally-created dermal wounds in human subjects is not
ethically acceptable, so investigators have developed animal models. However, the healing
of dermal wounds in animals is not identical to the healing process in humans, so an
appropriate animal model must be selected and the results must be interpreted to account
for anatomical and physiological differences. For example, the healing of dermal wounds in
rodents occurs almost entirely through wound contraction; scar formation only accounts for
a small fraction of total healing [3]. In contrast, skin wounds in humans close via
approximately equal proportions of scar formation (47%) and wound contraction (53%).
Dermal wounds in pigs close through similar proportions of scar formation and wound
healing, but there is an added cost of using larger animals and the disparities with human
wound healing are unknown.
The use of an animal model has the benefit of providing an environment which
currently cannot be replicated in vitro. These models have been used to identify materials and
treatments which improve the healing of dermal wounds through histological analysis and
non-invasive monitoring techniques (Integra [3],Apligraf [12]). However, techniques which
could be used to monitor factors endogenous to the wound environment (e.g., local
contractile forces, chemical concentrations) would also make the wound environment more
artificial. Thus, although an animal model can provide the proper environment for study, an
increase in the number of factors which are monitored will likely decrease the relevance of
the model.
1.1.2 In Vitro Models of Contraction
The large expense of development and employment of in vivo models, as well as the
limitation of which and how many factors can be monitored and controlled with them, has
led investigators to develop in vitro models of wound contraction. These in vitro models
cannot duplicate the intricate network of chemical and mechanical signals present in a
healing wound, but they do allow for experiments to be conducted in a highly controlled and
controllable environment where many variables can be monitored simultaneously. The large
numbers of degrees of freedom afforded by in vitro experimental work has led to the
development of many different models.
Two general types of experimental models for measuring contraction in vitro, using
cell-seeded gels or matrices, have emerged. The first model monitors contraction through
model quantitatively measures the contractile force and sometimes provides a resistance, in
addition to the substrate, to the contraction developed by the seeded cells [16-20].
1.1.2.1 Measuring Contraction through Dimensional Changes
0/
the SubstrateMonitoring the dimensional changes of a compliant, biocompatible material provides
a simple, straight-forward technique with which to monitor contraction by cells (Fig. 1.2).
This technique was developed more than 20years ago by Bellettil. [12], and has since been used to define and understand the process of contraction of many different cell types [13-15, 21]. Use of this type of model has allowed researchers to determine that contraction
depends on: cell attachment via the 131family of integrins [22, 23]; cytoskeletal elements [12, 13, 24]; and serum factors (TGF-I3, PDGF) [13, 24-29].
Imposing an external restraint on the contraction of a collagen gel by cells has led to
a variation of this type of model (Fig. 1.2). Physical restraint of the gel during the
development of a contractile force by cells results in tension developing in the gel. The
morphology and function of cells in a gel that is in tension vary markedly from those in an
unrestrained gel [13, 30]. One investigator [13],reported that the cells in a restrained substrate resemble those in granulation tissue (healing dermis), while those in a freely
contracting substrate resemble those in normal dermis. Subsequent experiments have
shown that cells in restrained and unrestrained substrates respond differently to the growth
factors relevant to wound healing. For example, a well known stimulant of fibroblast
contraction, TGF-I3, increased the production of the contractile protein a-smooth muscle
actin in fibroblasts three-fold in restrained collagen gels; fibroblasts in freely floating gels do
This has been utilized to study the growth factor signaling pathways involved in contraction [32]. Unrestrained
/
Culture Dish Restrained Restrained and Released Contracted Gel/
~.,. -''''-Contracted GelI
Figure 1.2 Schematic showing contraction of an unrestrained, fully restrained, and restrained-and-released cell-seeded, collagen gel. The gel adheres to the culture dish during casting. The left-most column shows a gel which was released from the substrate immediately following gelation. This gel contracts freely, so little internal tension can build up. The middle column shows a gel which adheres to the dish during the entire experiment. The restraint results in a tense gel. The right-most column shows an experiment where internal tension is allowed to build during a portion of the experiment, but the gel is then released from the dish and the cells contract it rapidly.
1.1.2.2 Measuring the Cellular Contractile Force
Contraction models which monitor dimensional changes provide a method to study
contraction, but do not provide information on the parameter responsible for wound
contraction: cell-generated forces. For this purpose, models which quantitatively measure
classified by whether the force is generated by one or many cells. In the former category
classification, the cells are spatially and mechanically isolated from each other, and the forces
generated by a single cell are measured. Originally, this mechanical isolation was achieved by
seeding a very low density of fibroblasts onto a compliant silicone membrane, followed by
analysis of the buckling pattern under active fibroblasts [33]. TIlls method has subsequently
been modified by replacing the silicone membrane with a substrate containing latex beads
and observing the fibroblast-induced deflection of the beads over time [34]. TIlls
improvement simplified force calculations since the substrate deformed elastically(i.e.,not
by buckling). The bead deflections were converted into force values via the substrate
stiffness. Using this technique, investigators found that: force was transferred to the
substrate during cell migration [33,35,36], pseudopod extension, and partial retraction [34,
37]; and cell movement and focal adhesions are guided by the substrate stiffness [38].
In the latter category of these quantitative models, a device equipped with a force
transducer measured the macroscopic contraction of a three-dimensional substrate by
fibroblasts [16, 18-20]. The contractile force developed by fibroblasts typically begins to
increase within one hour of seeding, and approaches an asymptotic value within 36 h (details
reported in Table 4.2). Both systems allow the cellular contractile response to be observed
over time, but under different conditions. Using this model, investigators have reported the
following: exogenously applied cyclical force dramatically affects the production of enzymes
specific for ECM protein degradation [39,40]; the force which develops appears to be a
homeostatic level [16,20,41]; disruption of microfilaments results in a decrease in force [16,
42]; disruption of microtubules results in an increase in force [17,42]; and contractile force is
1.2 The Cell Force Monitor
In the present work, the model system developed to monitor contraction by cells
measured the macroscopic contractile force generated by millions of fibroblasts attached to a
highly-porous, three-dimensional, collagen-GAG matrix over time. This type of model was
used because it allowed the force developed to be averaged over an entire population of
cells, eliminating cell-to-cell variation and allowing cells to develop the force in a
three-dimensional environment which was more relevant to the in vivo environment. In the
following paragraphs, the choice of the three main components of this model are discussed:
substrate, cell type, and force monitoring device.
1.2.1 Choice of Substrate
Unlike most previous models, this experimental system was designed to monitor the
contraction of a highly-porous, type-I collagen and chondroitin-6-sulfate (a
glycosaminoglycan, orGAG) matrix by cells. The collagen-GAG matrix provided several
experimental advantages. The freeze-drying and subsequent crosslinking processes which
were used to produce this matrix allowed the mechanical and microstructural properties (e.g.,
stiffness, pore diameter) to be modified, independent of the chemical composition (e.g.,
collagen-to-GAG ratio, GAG or collagen type). In addition, the open pore structure and
size of the struts (-10 Jlm diameter) of the collagen-GAG matrix allowed for observation of
the deformation of individual matrix struts by cells via a light microscope. This was
beneficial because the macroscopic measurement of contraction by millions of cells yields a
population average for contractile force, but does not reveal the mechanism by which
individual cells develop these forces and matrix deformations. The study of how contractile
the capability to inhibit wound contraction. In fact, it has been shown to mediate the
contraction and scarring resulting from severe burn wounds in humans.
1.2.2 Choice of Cell Type
For the purposes of this work, dermal fibroblasts (derived from rabbit dermis) were
studied due to the major role they play in wound healing and contraction. The use of a
dermal fibroblast cell-line would simplify the cell culture, but it has been reported that vitally
transfected cells do not exhibit decreased levels of the contractile protein a-smooth muscle
actin as compared to primary cells [44,45]. Ideally, human dermal fibroblasts would be used
in these studies, but problems associated with obtaining human cells and the concern of
infectious disease transmission made the use of fibroblasts obtained from an animal dermis
more practical.
1.2.3 Design Parameters of the CFM
The cell force monitor (CFM) was designed to measure the uniaxial contractile force
developed in a cell seeded sample of the collagen-GAG matrix over a period of time (usually
>20 h). The CFM allowed the stiffness of the resistance to contraction to be controlled. The resistance to contraction was an important variable in that it allowed the user to
simulate different mechanical conditions in vivo. Thus, together with control of the chemical
composition of the culture medium and the properties of the collagen-GAG matrix, the
CFM allowed the user to define the mechanical, chemical, and physical environment under
1.3 Project Goals and Overview
This work was structured to accomplish the following three goals: 1) Development
of an in vitro model to measure the contractile force developed by cells in a controlled
environment; 2) Identification of the cellular mechanisms responsible for matrix contraction;
and 3) Identification of the limiting mechanical factors in the development of matrix
contraction by cells.
An in vitro model was developed to study the contraction over time of a
three-dimensional collagen-GAG matrix by attached fibroblasts. To define the system, the
mechanical and microstructural properties of the collagen-GAG matrix were determined
(Chapter 2). A cell force monitor (CFM) was constructed, calibrated, and tested which
allowed the contractile force developed by millions of cells attached to the matrix over time
to be quantitatively measured (Chapter 3). The contraction of the collagen-GAG matrix
over time by fibroblasts increased almost immediately following cell seeding and reached an
asymptotic value after -15 h in culture. In Chapter 4, a parameter fundamental to the use of
this model, attached cell number, was found to relate linearly to the contractile force which
developed. In addition, an exponential equation was established which described and
allowed a quantitative comparison of the data from separate contraction experiments. Using
this equation, it was established that a force of 1 nN was generated per cell with a time
constant of - 5 h. Both of these values were independent of cell number. The two derived
constants together with determination of attached cell number at the termination of each
experiment enabled, a quantitative comparison of contractile data from different
experiments (Chapter 4).
The mechanisms through which individual cells deformed the matrix were identified
immunohistochemical identification of the contractile protein a.-smooth muscle actin. Using
these techniques, it was established that the contraction of the collagen-GAG matrix
occurred coincidentally with the elongation of fibroblasts along the matrix struts. In
addition, the time dependence of the contractile force measured with the CFM was found to
represent the actions of the population as a whole; not the time dependence of individual
cells deforming the matrix (Chapter 5).
The contractile force which was developed in the collagen-GAG matrix by the
fibroblasts was found to be limited by the force which developed, not the displacement.
This was determined by varying the amount of resistance to contraction (stiffness) provided
by the CFM (Chapter 6). The conclusions of each of these efforts are correlated in the final
Chapter 2. Microstructure and Mechanical Properties of the
Collagen-GAG Matrix
2.1 Introduction
As cells exert force on a porous material to which they are attached, the material
provides a resistance to this force which is determined by its stiffness. If the porous material
issufficiently compliant, the cellular forces will result in macroscopic deformations of the material which can be measured. If the material issufficiently stiff, however, the
macroscopic deformations resulting from the cellular forces will not be measurable.
Therefore, knowledge of the amount of resistance the material provides to cellular forces is
crucial to measuring and understanding the forces exerted by cells.
The cellular forces which macroscopically deform porous materials are applied
internally to individual pore walls (struts) which comprise the solid structure of the foam-like
materia,l. This internally initiated deformation is in contrast to the more common application
of external forces to macroscopically deform materials, such as in simple compression. To
draw conclusions about cellular forces from the measurement of macroscopic deformation,
the link between the microscopic and macroscopic phenomena must be elucidated.
In this chapter, the macroscopic mechanical properties, the microstructure of the
collagen-GAG matrix and the relationship between these features are discussed. An analysis
of the matrix microstructure suggests that it is similar to other natural and man-made open
cell foams (Fig. 2.1) [46]. However, comparison of the tension and compression
stress-strain curves of the collagen-GAG matrix with those of other open cell foams reveals that it
freeze-dried (Genesis 25LE, Virtis, Gardiner, NY) at -43°C in stainless steel trays to produce
a porous collagen-GAG matrix sheet (25 x 16 x -0.3 cm). Sublimation of ice crystals during
the freeze-drying process produced the pore structure. These sheets were then crosslinked
by dehydrothermal (DH1) treatment at 105°C under a vacuum of <50 torr for 24 hours [3]. This treatment leaves the collagen triple helix intact, if the moisture content of collagen prior
to heat treatment is less than 1wt, %[3,47]. A second set of matrix sheets to be used in the free-floating experiments (Chapter 6) were crosslinked for only 1 hour, producing a less stiff
matrix.
2.2.2 Matrix Pore Diameter
The microstructure of three-dimensional foams was determined quantitatively using
standard stereological techniques from images of planar sections. Due to the fragile nature
of the collagen-GAG matrix, it was difficult to obtain a cut surface that was not distorted or
damaged in some way. Therefore, confocal fluorescence microscopy of stained matrix
samples was used to observe two-dimensional sections of the matrix up to 1 mm below the
surface, providing an undisturbed section for analysis. General observations about the
three-dimensional microstructure were also made by viewing hydrated samples with a light
nucroscope.
Collagen-GAG matrix samples were stained using a fluorescent conjugated type-I
collagen antibody (see Appendix D.l). Images were gathered from stained samples hydrated
in TRIS-buffer (Sigma Chemical, St. Louis, MO) using a confocal fluorescent microscope
(MRC-600, Bio-Rad, Hercules, CA) (see Appendix D.2). To facilitate editing and analysis,
they were then converted to binary images using NIH Image software
by poor image quality (Fig. 2.2a). This assured that the program was only counting cell
walls. Examples of regions that needed correction for poor picture quality were dark regions
in the middle of pores, or obviously speckled areas. Without this editing, the image analysis
software would have interpreted a speckled area to be many small pores. These images were
then analyzed with the help of a linear intercept macro written for NIH Image (see
Appendix D.3). This macro finds the number of times that a series of parallel lines drawn
across the image intercepts a white line (e.g., a cell wall) at least 2 pixels wide (1.5 J.lm).
Likewise, a pore was not considered a pore by the program unless the black region was at
least two pixels wide. A circular region of the image was then selected using the circular
selection tool and the macro executed. This processes was repeated for series of parallel
lines rotated by 5° increments around the circular section and the mean intercept length, or
average distance between cell walls was reported. The program then used these distances
and angles to construct a best-fit-ellipse representing an average pore for the section
analyzed (Fig. 2.2b). To account for measurement of pores which were not sectioned along
their true cross-section, but rather at an arbitrary angle which would skew their calculated
pore size, the ellipse major and minor axes were corrected by multiplying by 1.5 [46].
Matrix microstructure was described by both a pore diameter (the average of the
best-fit ellipse major and minor axes) and an aspect ratio. The orientation of the best-fit
ellipse for each image was determined, but since the orientation of pores throughout the
matrix was random the value was not reported. The value of the reported average pore
diameter was an average of values from 4 different matrix samples. At least 4 images were
Orientation of Pores
108J1m
/
B
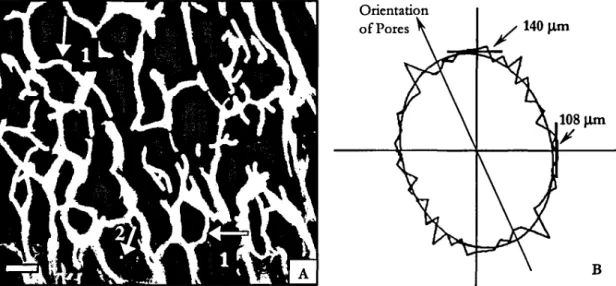
Figure 2.2. (A) A two-dimensional section of matrix from confocal fluorescent microscopy used in the pore diameter analysis (scale bar
=
100 J..lm). Arrows 1 indicate pore walls that were curved prior to any deformation imposed by macroscopic compression or by cellular forces. Arrow 2 indicates an example of an artifact of poor picture quality that was edited out. (B) A representative polar coordinate plot of the linear intercept lengths (50intervals) and the corresponding best-fit ellipse as reported by the Scion Image software. The average pore diameter for this sample was 124 J..lm and the aspect ratio was 1.3.2.2.3 Mechanical Testing of the Collagen-GAG Matrix
2.2.3.1 Tension Testing
Fully processed collagen-GAG matrix sheets were cut into rectangular samples 85
mm x 25 mm x -3 mm for tensile testing. The drydimensions of each sample were determined using a micrometer (±0.02mm). Due to the high compliance of the hydrated matrix samples, it was necessary to measure displacement opticallyvia a video camera. For this purpose two parallel lines of black fabric paint were placed 15 mm apart, perpendicular
to the axis of deformation (Fig. 2.3c), and allowed to dry overnight (see Appendix C.l). The marked samples were placed into 0.05M acetic acid for 1 hour to begin the re-hydration
process, then transferred to phosphate buffered saline (PBS), and stored at 4°C until testing
began.
<,
Load Cell
Fixed
L..---.::.----,~=:::iI""""'....
E--- CrossheadInstron Modet4201
B.
Acrylic Clamp Silicone Tubes '" MatrixC.
<E(:--- 80 mm>
Figure 2.3. Side view tensile testing apparatus with video camera to measure strain optically (A). Magnified view of acrylic clamp used to grip matrix (B), and top view of a marked matrix sample (C).
oriented horizontally in an acrylic pan so that it could be submerged in the saline during
testing (Fig. 2.3a). One end of the matrix was held in place by a fixed clamp, while the
other end was held in a clamp that moved horizontally as the mobile crosshead of the
universal testing machine (Model 4201, Instron, Canton, MA) displaced vertically. A nylon
line and pulley were used to translate the vertical crosshead displacement into the horizontal
matrix displacement. The stiffness of the nylon line was irrelevant since the displacement
was measured optically and the matrix, nylon line and load cell were in series. To monitor
the strain, a video camera (fM-1001-02, Pulnix America Inc., Sunnyvale, CA) connected to a
VCR (AG-S555, Panasonic, Rockville, MD) was positioned so that the position of the two
black lines on the matrix were recorded throughout the test (Fig. 2.4). The mobile
crosshead was programmed to ascend at a speed of 1mm/minute. This displacement rate
was chosen to minimize any effect of matrix viscoelasticity and of the release of fluid from the pores. Force data was gathered using a 50 N load cell (Model #2512-305, Instron, Canton, MA) connected, through the Instron, to a data acquisition card (AT-MIO 16XE-50,
National Instruments, Austin, TX) installed in a Pc. A time stamp (Fig. 2.4) recorded with
the images initiated simultaneously with the start of crosshead motion and load data
acquisition (see Appendix C.1). This feature allowed video frames and load data points,
both acquired at 30 Hz, to be synchronized.
Tensile engineering stress-strain curves were constructed from - 30 discrete points
by correlating optical strain measurements with the load data, normalized by cross-sectional
area. The video-recorded matrix displacement was replayed and images were acquireed, at 1
minute intervals, with a frame grabber card (HLImage++, Western Vision Software, Salt
Lake City, U1) installed in a Pc. Matrix displacement was determined using image analysis
distance between the fabric paint lines in the images. The distance between lines was measured at a minimum of 5 locations and averaged to account for any inhomogeneities in the matrix deformation. Strain was calculated by normalizing average displacement
measurements with the distance between the lines in the first frame acquired. Stress was calculated by normalizing the measured load by the cross-sectional area of the sample, calculated from the hydrated width and the unhydrated thickness of the matrix. The unhydrated thickness was used due to the high compliance of the hydrated matrix making measurement of this parameter after hydration difficult. A cursory analysis revealed the hydrated and unhydrated dimensions did not very significantly.
o
min.Figure 2.4. Images used for the optical strain measurement technique in the tensile tests, at the beginning of testing (0 min.) and at the end of testing (29 min.). The time stamp on the bottom of each image was used to correlate displacement and load. The distance between the black lines at the start of the test was 15 rom.
2.2.3.2 Compression Testing
The compressive response of the collagen-GAG matrix was determined using the device described in the following chapter (Fig. 3.2). Briefly, the cell force monitor (CFM) was designed to measure contraction of the collagen-GAG matrix by fibroblasts with time. Deflection of the cantilevered beam was monitored using an inductive transducer. The transducer converted the beam deflection into a voltage which was recorded using a Pc.
The force applied to the beam end is linearly related to measured deflection by the beam's
stiffness. Therefore, the CFM allowed simultaneous measurement of the force and
displacement applied to the beam end.
Collagen-GAG matrix samples 5 mm x 13 mm x -3 mm were rehydrated with PBS
and placed between the horizontal translation stage and the cantilevered beam (Fig. 2.5).
Prior to rehydration, the width and thickness of each sample were measured using a
micrometer so that force could be converted into stress using the cross-sectional area. The
dimensions of the matrix did not measurably change upon rehydration. Any sample which
did not have parallel edges was discarded. In addition, the samples were pre-stressed by
advancing the horizontal translation stage prior to the acquisition of the first data point in
order to ensure that the entire surface was in contact with the beam and stage. The sample
was then compressed, along the 5 mm long axis, by advancing the stage manually at discrete
intervals (0.1,0.2,0.5,0.8, 1.1 mm), causing both the beam and the matrix sample to deflect
(see Appendix C.2). After a two minute delay following each compression interval,
deflection of the beam was recorded as a change in voltage by a data acquisition card
(AT-MIO 16XE-50, National Instruments, Austin, TX) installed in aPC, This delay allowed the matrix to reach a steady-state displacement following the increase in displacement. Force
and displacement of the beam were then calculated from this voltage using calculated
calibration factors (Chapter 3). The matrix and the beam were in series (Fig. 2.5), so the
force in the beam was equal to the force in the matrix. Matrix stress was calculated by
dividing the force by the cross-sectional area of each sample (13 x 3 mm). The deflection in
the matrix was calculated by subtracting the beam end deflection from the stage
displacement. Matrix strain was calculated by dividing the matrix deflection by the original
To Cantilevered End
t
and Proximity SensorBe-Cu ~Beam Adjustable Horizontal Stage
..
L
PBS Level ·· ···· · M._.__ __ _. ._._ _ .._. . _ . Matrix Sample Petri /DishFigure 2.5. Schematic of compression testing setup utilizing the CFM. The sample is pushed with the horizontal stage causing both the beam and matrix to deflect. The beam deflection is measured using a proximity sensor (see Fig. 3.2).
An engineering stress-strain plot was constructed from individual samples. Samples were tested from two different matrix sheets each crosslinked for 24 h (n= 11and n
=
5), to determine the variation between sheets. A matrix sheet crosslinked for only 1 h was also tested for the free-floating experiments described in Chapter 6 (n=
6).2.3 Results
2.3.1 Matrix Pore Diameter
The analysis of two-dimensional sections yielded an average pore diameter of 138 ± 12 Jlm (n
=
4) and an average aspect ratio of 1.2. This aspect ratio represented the preferred alignment of the pores in the image analyzed (e.g., Fig. 2.2). Although not quantitatively analyzed, the pore alignment was only a localized phenomenon. In other words, for the small areas of the matrix analyzed the pores had a preferred alignment, but when the matrix was viewed macroscopically the pore orientation was essentially random, similar to alight microscopy was the presence of pore walls which were curved without any imposed
deformation (Fig. 2.1c arrow 1). This was also apparent in the planar sections (Fig. 2.2
arrow 1). 10 ..,.---, 8 x
....
t'l ~ ~e
,;- 6 '" u...
..
C/) ~ .5...
4 u u c:....
~ c: ~ 2 0% 5% 10% 15% 20% 25% 30% Engineering Strain, eFigure 2.6. Tension stress-strain curve of hydrated collagen-GAG matrices at 37°C. Data points represent the results from 4 samples. Trendline is a best-fit second order polynomial.
2.3.2 Tension Testing
Tension testing of matrix samples resulted in a stress-strain curve for which the slope
increased with increasing strain (Fig. 2.6). Matrices generally failed at a strain between
20-25%. In most samples, failure initiated at a small, localized tear which slowly propagated
across the width of the sample. The initial tear did not occur near the clamps nor did it
always occur at an edge of the sample. In addition, there was no correlation between the
2.3.3 Compression Testing
A representative compressive engineering stress-strain curve is shown inFigure 2.7. All samples exhibited a linear (R2 2: 0.96) stress-strain behavior up to the highest strains tested (-20%). The average slope for all samples from a particular sheet of 24h crosslinked matrix was determined to be 44 ± 5.9 Pa (n
=
11). A second sheet of 24h crosslinkedmatrix, tested to examine sheet-to-sheet variation, had an average slope of 54
±
9 Pa (n=
5). The average slope for the matrices crosslinked for only 1 h, for use inthe free-floating experiments (Chapter 6), was 19±4.4 Pa (n=
6).10 0'
=
44xE+0.2 R2=
0.98...
8 ~ Pot ...e
en 6 en ~...
.... en eo c ·C 4 ~ ~ c....
e.o c ~ 2 0+---,---,---,.---1 0% 5% 10% 15% Engineering Strain, E 20%Figure 2.7. Representative compression stress-strain curve of hydrated collagen-GAG matrix. Other samples showed a similar linear response up to -20% strain.
2.4 Discussion
2.4.1 Comparison of Collagen-GAG Matrix with Other Foamed Materials
The microstructure of the collagen-GAG matrix resembled that of other open cell
foams (Fig. 2.1) [46]. The pore structure was not perfectly regular, resulting in local
variations in matrix stiffness (Fig. 2.1c arrows 2 and 3). This effect was compounded by the
presence of struts which were curved prior to matrix deformation (Fig. 2.1c arrow 1). The
fibroblasts which were used in the experiments presented in the following chapters were -10
to 20 Jlm in diameter when rounded and - 50 Jlm in length when elongated. Therefore,
since the size of the fibroblasts was similar to that of the pores, localized variations in pore
diameter, geometrical stiffness and irregularities in pore shape will most likely affect cell
behavior.
2.4.2 Macroscopic Mechanical Properties of the Collagen-GAG Matrix
Neither the tension nor the compression stress-strain curve for the collagen-GAG
matrix were qualitatively similar to those reported for more traditional foamed materials
(Figs. 2.6,2.7, and 2.8). Current theory predicts that the mechanical properties of a foam
are determined by the properties of the pore wall material, the foam's pore volume fraction,
and the pore geometry [46]. The production method and small size of the individual
collagen-GAG matrix struts precluded determination of the pore wall material's mechanical
properties under appropriate testing conditions. Therefore, a direct application of the
current theory was not possible. An interpretation of the macroscopic mechanical testing
results, based on a qualitative comparison with the stress-strain curves and the
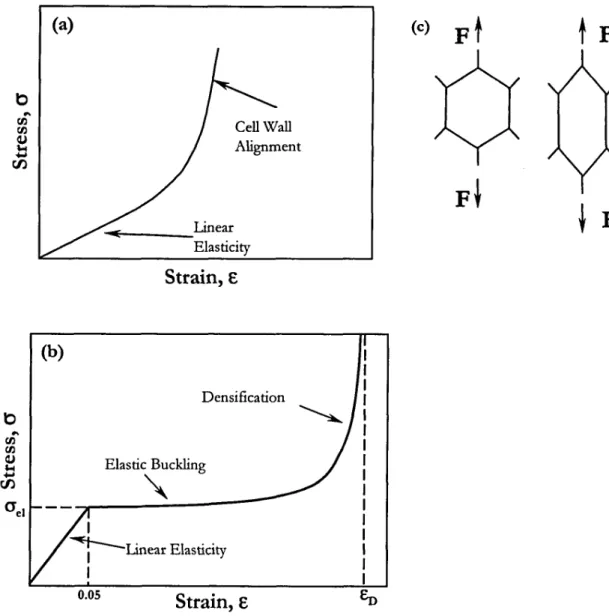
(a) b Cell Wall Alignment ~ Linear Elasticity
Strain,
E b Densifica tion (b) Elastic Buckling"
I ~Linear Elasticity I 0.05Strain,
E (c)F
t
t
F
Figure 2.8. Tensile (a) and compressive (b) stress-strain curves representative of elastomeric foams. In (b), eJe\isthe stress at which elastic buckling occurs (E== 0.05 for open cell foams) and EDis the strain at which the foam's density is equivalent to that of the solid material. (c) Schematic illustrating the alignment of pore walls (struts) after tensile deformation. This phenomenon causes the increase in slope of the tension eJ-Ecurve at high strains.
The collagen-GAG matrix's tensile stress-strain curve did not exhibit the initially
linear region reported for other foams (Figs. 2.6 and 2.8). In the literature [46], this small
strain regime is linked to linear elastic bending of pore walls. Instead, there appeared to be a
the linear elastic deformation was not noticeable due to the resolution of the testing
equipment. As the walls become aligned, they would be more resistant to deformation,
resulting in an increasing slope in the tension stress-strain curve (Fig. 2.8e).
In contrast, the compression stress-strain curve was completely linear (R2 ~ 0.96).
The stress-strain curve for other foams in compression exhibits two linear or nearly linear
regions: linear elasticity and elastic buckling (Fig. 2.8). Linear elastic deformation of most
foams terminates beyond - 5% strain, followed by a sharp decrease in slope caused by the
onset of elastic buckling of cell walls. The collagen-GAG matrix stress-strain curve had no
such transition even to strains> 15%, suggesting that the linear elastic region was
circumvented by another deformation mechanism(s). The observation of curved struts prior
to any imposed deformation (Fig. 2.1c arrow 1) would be consistent with immediate elastic
buckling. Therefore, early deformation was likely the result of buckled struts preferentially
deforming under the applied load, rather than linear elastic bending. The slope of this curve
would then represent the slope of the elastic buckling region.
2.5 Condusions
The pores of the collagen-GAG matrices were slighdy elliptical (aspect ratio
=
1.3). A representative pore diameter, determined by averaging the major and minor axes of theellipse, was -140 Ilm. The preferred alignment of elliptical pores was localized in regions
<1 em on a side and these regions were randomly oriented throughout the matrix sheet. Therefore, the size of the matrix samples used in the contraction experiments preempted the
need to account for the localized anisotropy. The shape and size of the pores and struts was
not perfecdy regular resulting in local variations in matrix stiffness. Since the size scale of
affected cell behavior. The macroscopic tension and compression stress-strain response of
the matrix did not compare well with that reported for other porous materials. However,
the linear nature of the compression response allowed for the calculation of a modulus (-44
Pa), This modulus was used to calculate the fibroblast contractile force due to the
compressive nature of the matrix contraction by fibroblasts. The tensile properties reported
Chapter 3. Design and Testing of the Cell Force Monitor (CFM)
3.1 Introduction
An important component of an in vitro model of cell-mediated contraction is the
method through which contraction is monitored; the choice of this method will determine
how the variables which affect the contraction will be controlled. Two experimental
systems for measuring contraction in vitro, using cell-seeded substrates, have emerged
from previous work. Non-instrumented systems measure the dimensional changes of a
cell-seeded substrate over days or weeks [12-15]. Instrumented systems generally
provide a resistance, in addition to the substrate, opposing contraction, and monitor
changes in the contractile force developed by the seeded cells continuously, up to several
days [16-20]. For this study, an instrumented system was designed and constructed
which quantitatively monitors the contraction of a collagen-GAG matrix by fibroblasts
immediately following cell attachment.
The goal of the design of the cell-force monitor (CFM) was to measure the contraction of the collagen-GAG matrix in the most direct and accurate manner possible. This goal was established so that measurement techniques would not complicate the interpretation of the contraction data. Our design was based on a similar device developed by Eastwood and his co-workers [18,41]. In their device, one end of the substrate was held by a fixed clamp, while the other was connected to a wire A-frame which was attached to a cantilevered beam. The beam was instrumented with strain gages to measure its deflection as the substrate was contracted by the cells. The use of the wire A-frame introduced poorly
defined moments into the device, complicating the analysis of the contractile forces. In
addition, the use of strain gages attached directly to the beam made it difficult to change the
level of mechanical restraint, as well as the range and resolution of the forces measured. The
design described in this study is a modification of Eastwood's device, in which the cantilever
beam is attached directly to the clamp holding the matrix, providing a more accurate
measurement of the matrix response. In addition, we introduced the use of an inductive
transducer (proximity sensor), rather than strain gages, to measure the beam deflection,
which allows the beam stiffness to be varied easily. A direct comparison between the CFM
and Eastwood's device to determine the effect of these design changes has not been made,
but our modifications do result in a more compact, mechanically simplified system.
The CFM allows the evaluation of the cellular contractile response under a variety of
environmental conditions in vitro, including changes in matrix stiffness, changes in an
externally opposed resistance to substrate contraction, and changes in the chemistry of the
testing environment. The CFM has application in furthering understanding of the
contraction associated with wound healing, and of the presence and role of contractile cells
in diseased tissue. In addition, the CFM may prove useful in understanding the effect of
forces on gene expression and cellular differentiation.
3.2 Device Design
The cell-force monitor (CFM) was designed to monitor the contraction of a
compliant, biocompatible porous matrix by cells over time (Fig. 3.1a). Cell-seeded,
(a)
To Amplifier / PC
Adjustable
Horizontal Stage Rotation
Stage
Fixed Clamp Moveable Clamp (b) Collagen-GAG Matrix Be-CuBeam Be-Cu Beam
Fixed Clamp Movable Clamp
"-End View
Top View
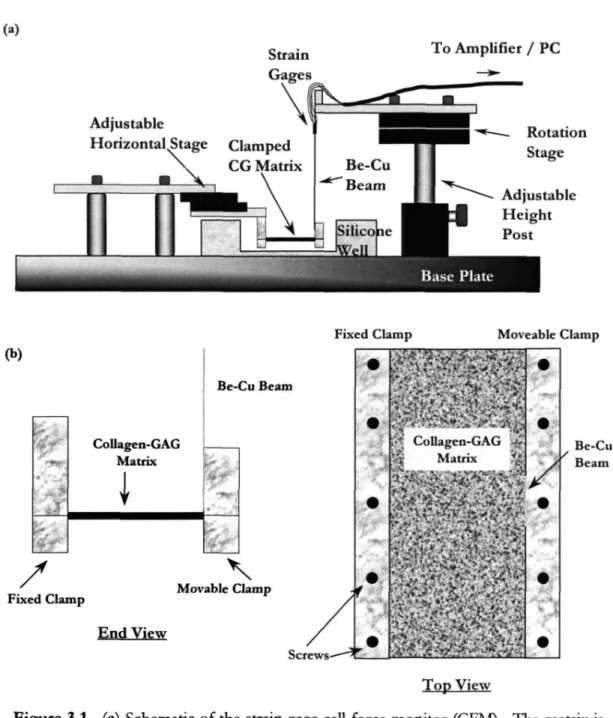
Figure 3.1. (a) Schematic of the strain gage cell force monitor (CFM). The matrix is held between a fixed clamp on the left and a second clamp, attached to an instrumented beam, on the right. Contraction of the matrix by the cells deflects the beam, allowing the cell force to be calculated. The beam deflection is measured by either strain gages or by a proximity sensor. (b) End and top view of a clamped collagen-GAG matrix attached to the CFM.
One clamp was fixed while the other was attached to an instrumented beryllium-copper
beam (100mm x 10mm xO.15mm; 2% Be - 98% Cu, Goodfellow Corp, Cambridge, UK). The end of the beam farthest away from the porous scaffold was rigidly clamped in the
vertical position. As the cells contracted the matrix, the beam deflected; measurement of
this deflection, by either strain gages or a proximity sensor (Fig. 3.2), allowed the contractile
force to be calculated.
The mechanical resistance of the system was controlled by changing the beam
geometry (see Chapter 6). The scaffold and the clamps were submerged in cell culture
medium in a silicone well. Adjustable stages were used to ensure that the clamps were
parallel, the matrix was horizontal, and the beam was at its equilibrium position prior to the
start of each test. The entire apparatus was mounted on an anodized steel optics plate
(Edmund Scientific, Barrington, NJ).
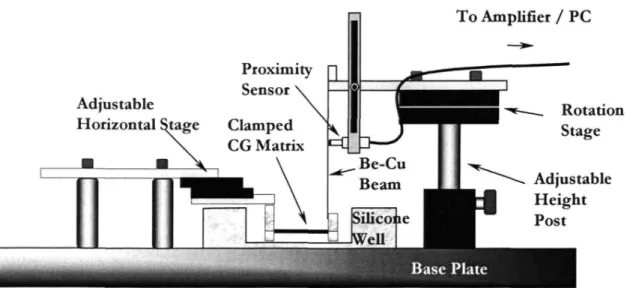
To Amplifier / PC Rotation Stage ~ Adjustable Height Post
Figure 3.2. Schematic of the proximity sensor cell force monitor (CFM). See caption for Fig. 3.1 for detailed description.
3.2.1 Strain Gage CFM
Four strain gages (N3K-06-S022H-50C Measurements Group, Inc., Raleigh, NC)
were attached to the beam, two on each side, 15 mm from the clamped end. To ensure
proper measurement, the gages needed to be well-bonded to the beam, while minimizing
adhesive (M Bond 450, Measurements Group, Inc., Raleigh, NC) were followed (see
Appendix E.l). The strain gages were then wired in a full-bridge configuration which
compensates for temperature changes so that the voltage difference across the bridge,
produced by bending, would be maximized. Signal voltage from the bridge, due to beam
bending, was acquired by a data acquisition card (AT-MIO-16XE-SO) installed in a PC using
the strain gage accessory (SC-4083, National Instruments, Austin, TX). This accessory supplied a stable excitation of 5V to the bridge, and then amplified the output signal before
transmission to the PC to reduce noise. When possible, shielded wires were used to reduce
noise further. Data processing was performed by data acquisition software loaded on the PC
(Labview, Austin TX); voltage values were acquired from the strain gage bridge at a rate of 1 per second, and were then averaged over 100 seconds to yield one data point (see Appendix
E.6). The strain gage bridge and small diameter inter-gage connecting wires were coated
with a 3:1 mixture of petroleum jelly and paraffin wax to protect the electronics from the high humidity in the incubator. This mixture minimized local beam stiffening without
flowing at the elevated temperature (37°C) in the incubator. Commercially available coating
materials including: silicone (3140-RTV), microcrystalline wax (M-Coat-Wl), and
solvent-thinned butyl rubber (M-Coat FBl) (Measurements Group, Raleigh, NC) were not as
effective at protecting the gages from moisture.
3.2.2 Proximity Sensor CFM
A second CFM was built using an inductive transducer (proximity sensor) to detect
beam deflections (Fig. 3.2). Without contacting the beam, the proximity sensor
(KD-2300-lSD, Kaman Instruments, Colorado Springs, CO) measured beam movement by emitting an
field. The sensor measured deflections up to 1.3 rom from its front surface at a resolution of
0.1 J-lm. The voltage output for this sensor was 1 V/ rom and varied linearly with distance to
the beam. Voltage readings were acquired using the same method described above for the
strain gage CFM. Modifications were made to firmly fix the sensor so that motion relative
to the beam occurred only by bending of the beam. The modifications allowed the position
of the sensor along the beam's length to be adjusted. The best sensor position maximized
resolution while keeping the maximum expected deflection within the sensor's range. For
these experiments, the sensor was placed 36 rom from the fixed end of the cantilever.
3.3 Methods
3.3.1 Measurement of Drift
To assess baseline function, the stability and signal-to-noise ratio of an undisturbed
beam was recorded. To establish this baseline response, the CFM was prepared and placed
in the incubator, as if for a matrix contraction experiment, but no clamp was attached to the
beam. Voltages were then gathered for 20 hours in the manner described above. The drift
in the average voltage with time and the peak-to-peak voltage change attributed to
background noise were calculated. This measurement was repeated for both the CFM
instrumented with strain gages and that instrumented with a proximity sensor.
3.3.2 Calibration of the CFM
The cell-force monitor recorded displacement data as voltage changes using either
the strain gage bridge or the proximity sensor. In both systems, the voltage changes were
proportional to the deflection of the beam, which, according to elementary beam theory, is
system was calibrated to convert voltage changes to displacements or forces (see Appendices E.2 & E.6). To calibrate for displacement, voltage changes were recorded after displacing the beam end by a known amount, from 0.2 to Zmm, with a micrometer (resolution O.Olmm). A minimum of 5 displacements were used to construct a plot of voltage vs. displacement. The resulting slopes from 3 such plots were averaged to yield a calibration factor. To calibrate for force, known masses, ranging from 3.2 mg to 2g, were placed on the end of the beam in the horizontal orientation. An initial deflection due to the beam's own weight was accounted for by using it as a zero point. The calibration range for displacement and force were selected to include the maximum values expected during cell-seeded matrix contraction experiments. Maximum values in actual experiments did not exceed these expectations.
The cellular contractile force was equal and opposite to the total force in the beam and the matrix. Since the beam and matrix displaced equal amounts, they acted in parallel, and the total force was the sum of each element. The opposing force in the beam, Fbtam, was
found dire~tly from the voltage data using the calibration factors described above, while the opposing force in the matrix, Fma,ri>.? was calculated using the compressive stiffness (measured
in Chap. 2) of the matrix and the deflection of the beam end. Therefore, the total force exerted by the cells was:
F =~eam +Fmatrix =V 0Cforce +V 0Cdispl, 0Kmatrix (Eqn.3.1)
where Vwas the voltage measured, C'iorcr and Cdisplwere calibration factors for force and
displacement, respectively, and Kma,rix was the compressive stiffness of the matrix. (Note:
Kmatrix
=
(Ematrix°A)/lwhereA and I are the cross-sectional area and length of the matrix, respectively.)Due to the rigid attachment of the matrix to the beam, the deflection of the beam
and the matrix were identical. Thus, the choice of beam or matrix stiffness can make one of
the components of opposing force negligible (e.g.,if the beam is orders of magnitude stiffer
than the matrix, then the matrix stiffness is negligible). Itshould be noted that the CFM, like most force transducers, directly measured displacement to infer force. Thus, if the
combination of beam and matrix stiffness was sufficiently large, no noticeable deflection
would be measured, even though the cells were generating a contractile force.
3.3.3 Cell Seeding and Force Measurement Assay
As a test of the CFM's functionality, a known number of fibroblasts in suspension
were seeded onto a clamped, hydrated matrix sample (25 mm x 70 mm x -3 mm; Length x
Width x Thickness) attached to the CFM. The matrix sample was hydrated by submersion
in 37°C culture medium for 30 minutes and blotted dried with filter paper (S&S #595,
Dassel, Germany). The fibroblast suspension (830JlI volume) was then evenly distributed
over the top surface with a pipet. The matrix was held at 37°C for 10 minutes to encourage
fibroblast attachment, and then the silicone well of the CFM was filled with culture medium.
The entire apparatus was placed inside an incubator (Ultima 300T, Revco, Asheville, NC) at
37°C, 5% CO2 and -98% R.H., and data was acquired using the data acquisition program.
The acquired voltage, representative of deflection of the beam, was translated into
contractile force through application of Eqn, 3.1. Attached fibroblast number was
determined at 22 hours by digesting the matrix in a buffered dispase (GIBCO, Grand Island,
NY) solution (2.0 U/ml) at 37°C for 20 minutes and counting fibroblasts with a