HAL Id: cea-02103387
https://hal-cea.archives-ouvertes.fr/cea-02103387
Submitted on 18 Apr 2019
HAL is a multi-disciplinary open access archive for the deposit and dissemination of sci-entific research documents, whether they are pub-lished or not. The documents may come from teaching and research institutions in France or abroad, or from public or private research centers.
L’archive ouverte pluridisciplinaire HAL, est destinée au dépôt et à la diffusion de documents scientifiques de niveau recherche, publiés ou non, émanant des établissements d’enseignement et de recherche français ou étrangers, des laboratoires publics ou privés.
modifications on JET
Laurent Colas, P Jacquet, V. Bobkov, M. Brix, L. Meneses, K. Kirov, E.
Lerche, C. Klepper, M. Goniche, A. Křivská, et al.
To cite this version:
Laurent Colas, P Jacquet, V. Bobkov, M. Brix, L. Meneses, et al.. 2D mappings of ICRF-induced SOL density modifications on JET. 45th EPS Conference on Plasma Physics, Jul 2018, Prague, Czech Republic. �cea-02103387�
2D mappings of ICRF-induced SOL density modifications on JET
L. Colas1, P. Jacquet2, V. Bobkov3, M. Brix2, L. Meneses4, K. Kirov2, E. Lerche2,5, C.C. Klepper6, M. Goniche1, A. Křivská5, P. Dumortier2,5, A. Czarnecka7 and JET contributors*EUROfusion Consortium, JET, Culham Science Centre, Abingdon, OX14 3DB, UK 1
CEA, IRFM, F-13108 Saint Paul Lez Durance, France. 2
CCFE, Culham Science Centre, Abingdon, OX14 3DB, UK. 3
Max-Planck-Institut für Plasmaphysik, Garching, Germany. 4
Instituto de Plasmas e Fusão Nuclear, IST, Universidade de Lisboa, Lisboa, Portugal. 5
LPP-ERM-KMS, TEC partner, Brussels, Belgium. 6
Oak Ridge National Laboratory, PO Box 2008, Oak Ridge, USA. 7
IPPLM, Hery 23 Str., 01-497 Warsaw, Poland.
Waves in the Ion Cyclotron Range of Frequencies (ICRF, 20-80MHz) provide core ion heating in tokamaks and are used to limit impurity accumulation in high-performance JET scenarios [1][2]. Before reaching the core, these radiofrequency (RF) waves, excited at the Low-Field Side of the torus, interact with the Scrape-Off-Layer (SOL), causing enhanced wall sputtering, heat loads and local density (ne) changes with a complex 3D geometry. Extending
previous studies on JET [3-5], this paper aims at mapping RF-induced SOL ne patterns in 2D.
This puts constraints on SOL RF modelling and provides hints for locating RF-specific W-sources on the JET ITER-Like-Wall (ILW), similar to the ITER vessel.
I.
Experimental setup and 2D mapping technique
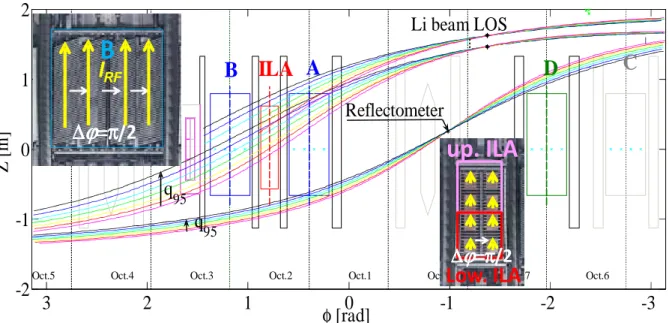
At JET, ICRF waves were excited at a frequency of 42MHz by phased toroidal arrays of four poloidal RF current straps (A2 antennas [6]) as well as a 2×4 ITER-like array (ILA
[7]). Four A2 antennas (named A-D) are located toroidally around the torus, while the ILA is placed between A and B (see figure 1). Upper and Lower halves of the ILA can be operated independently of D and of the pair A+B, whose feeding transmission lines are coupled. 500kW power was delivered per antenna, with a toroidal phasing ∆
ϕ
=π/2rad. SOL density (ne) distributions are measured by Lithium Beam Emission Spectroscopy (Li-BES) [8] andX-mode reflectometry [9], whose Lines Of Sight (LOS) have different magnetic connections to the various antennas (see Figure 1). D[H]-heated L-mode pulses at 2.4T were studied, where *See the author list of “X. Litaudon et al. 2017 Nucl. Fusion 57 102001″
Figure 1: Toroidal/vertical view of ICRF antennas and outer limiters in JET from inside the vacuum vessel. Magnetic field line tracing from several points along Lithium beam and reflectometry LOS on pulse JPN 90454, over a scan of q95. Inset: photos of A2 and ITER-like ICRF antennas, with sketch of the toroidal phasing.
Figure 2: Time traces during pulse JPN 90456. Upper two panels: density distributions (logarithmic scale) along Li-beam and reflectometry LOS, mapped to outer mid-plane, vs time and radial distance to separatrix. ne color range: 1×10
17 m-3 to 1.2×10¹⁹m-3. Bottom: RF power delivered by the different ICRF antennas, and edge safety factor q95.
ICRF antennas were toggled while the plasma current was ramped up (see
figure 2). D2 gas fueling from a
toroidally-distributed valve was feedback-controlled to maintain a constant core density. In ohmic regime Li-BES and reflectometry measured similar profiles within a 4cm radial shift. During ICRH ne modifications
with respect to ohmic references at similar edge safety factor q95, were
recorded in the outer SOL, several meters away toroidally from the active antennas. Earlier studies showed that these reproducible changes increased in magnitude with larger RF power and when switching from phasing ∆
ϕ
=π to ∆ϕ
=π/2 [4]. They depended on q95, on which antenna was active and which diagnostic monitored ne. Thisis attributed to varying LOS-antenna magnetic connections. Following this idea, supported by other observations (e.g. [5]), and assuming a parallel homogeneity of the RF-induced SOL patterns, the ratio of time-averaged ne with or without RF waves was plotted versus the
-3
-2
-1
0
1
2
3
-2
-1
0
1
2
Oct.1 Oct.2 Oct.3 Oct.4Oct.5 Oct.8 Oct.7 Oct.6
JPN 90454, JET unfolded view from inside torus
φ
[rad]
Z
[
m
]
Li beam LOS
C
Reflectometer
q
95q
95B
ILA
A
D
∆∆∆∆ϕϕϕϕ=π
=π
=π
=π
/2
I
B
RFup. ILA
Low. ILA
∆∆∆∆
ϕϕϕϕ
=π
=π
=π
=π
/2
location of observation points along the diagnostic LOS, mapped in front of each RF antenna using field line tracing. In this technique, first proposed in [10], the LOS ensured the radial resolution of 2D maps, while scanning q95 provided their vertical resolution.
II.
Experimental 2D maps of RF-induced density variations.
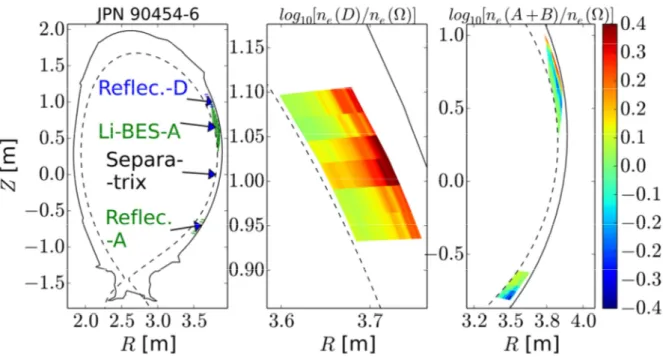
Figure 3 maps density ratios during A2 antennas with respect to ohmic reference. Ratios in the range of 0.4 (depletion) to 2.5 (over-density) were observed, mostly in the outer SOL, extending radially 2-3cm in front of antenna limiters, with poloidal asymmetries.
Figure 3: 2D maps of ne ratios during antenna D and A+B to ohmic, mapped to antennas D and A.
Figure 4 compares ne modifications
when powering lower and upper ILA, along the Li-beam LOS connected magnetically to the upper array. ne changes in this region
even when the un-connected lower ILA is active. When switching to the upper array, the density depletion stays similar in the upper part of the map while an over-density area develops at the bottom.
←Figure 4: log10(ne(ILA)/ne(Ω)) along Li-beam LOS mapped to ILA, with lower ILA (left panel, JPN 90456) and upper ILA (right panel, JPN 90509) active. Color scale: [-0.4 ;0.4].
III.
Discussion and outlook.
Many machines have evidenced ICRF-induced SOL ne modifications, with a
phenomenology similar to JET [10-14]. The emitted oscillating near fields likely cause SOL biasing to large direct current (DC) potentials VDC by RF-sheath rectification, and subsequent
E×B ne convection in EDC=-∇∇∇∇⊥VDC. Large VDC exceeding sputtering thresholds [14-16] and
SOL cross-field flows were measured during ICRH [14-17]. In addition to other experiments,
e.g. [5], reproducing the observed ne patterns, in relation with antenna electrical settings, can
be used to validate RF-sheath modelling tools. Present simulations suggest that powering the
Figure 5: (Radial-poloidal) location of connection points to the ILW for perturbed flux tubes along Li-beam LOS on pulse JPN 90454.
lower ILA with ∆
ϕ
=π/2 enhances VDC also in the upper partof the antenna, but less than using the upper array, qualitatively consistent with figure 4 [18]. Within RF-induced convection the maximal VDC, most efficient for wall
sputtering, is expected at the center of the convective cells.
Figure 5 shows that some flux tubes with modified ne connect
to W-components on the ILW, e.g. the tiles at low divertor entrance. Limited W spectroscopy diagnostics at these candidate sputtering locations and the toroidal spread of connection points, might explain why RF-specific W-sources have not yet been evidenced directly on the ILW [3]. This might guide further attempts at detection. It is also proposed to reduce RF-SOL interactions by tuning the power balance between inner and outer straps of A2 antennas [19].
Acknowledgements. This work has been carried out within the framework of the EUROfusion Consortium and
has received funding from the European research and training programme under grant agreement N° 633053. The views and opinions expressed herein do not necessarily reflect those of the European Commission.
IV.
References
[1]: E. Lerche et al. Nucl. Fus. 56 (2016), 036022
[2]: M. Goniche et al. PPCF 59 (2017) 055001
[3]: V. Bobkov et al., Journal of Nuclear Materials
438 (2013) pp. S160–S165
[4]: L. Colas et al. JNM 463 (2015) pp.735–738 [5]: C.C. Klepper et al. EPJ Web of Conferences 157, 03024 (2017)
[6]: A. Kaye et al., SOFE Conf. Proc., 16th IEEE/NPSS Symposium, Vol. 1 p736 (1995)
[7]: F. Durodié el al., FED 74, 223–228 (2005)
[8]: M. Brix, et al., RSI 81 (2010), 10D734
[9]: A. Sirinelli, et al., RSI 81 (2010), 10D939
[10]: L. Colas et al., JNM. 363–365, p.555 (2007)
[11] : K. Crombé et al. Proc. 40th EPS conference Espoo (Finland) 2013 ECA vol 37D P4.184
[12]: C. Lau et al. PPCF 55 (2013), 095003
[13]: L. Colas et al., AIP CP 1580, p.259 (2014)
[14]: M.J. Martin et al. PRL 119 (2017) 205002
[15]: R. Ochoukov et al. PPCF 56 (2014), 015004
[16]: M. Kubič et al. Journal of Nuclear Materials
438 (2013) S509–S512
[17]: I. Cziegler et al. PPCF 54 (2012), 105019
[18]: A. Křivská et al., proc. 23rd PSI conf. Princeton 2018, P111, submitted to Journ. Mat. & En..
[19]: Bobkov et al., proc. 23rd PSI conf. Princeton 2018, I106, submitted to Journ. Materials & Energy.