HAL Id: hal-00973115
https://hal-sciencespo.archives-ouvertes.fr/hal-00973115
Preprint submitted on 3 Apr 2014
HAL is a multi-disciplinary open access archive for the deposit and dissemination of sci-entific research documents, whether they are pub-lished or not. The documents may come from teaching and research institutions in France or abroad, or from public or private research centers.
L’archive ouverte pluridisciplinaire HAL, est destinée au dépôt et à la diffusion de documents scientifiques de niveau recherche, publiés ou non, émanant des établissements d’enseignement et de recherche français ou étrangers, des laboratoires publics ou privés.
The Impact of Financial Constraints on Firms Survival
and Growth
Patrick Musso, Stefano Schiavo
To cite this version:
Patrick Musso, Stefano Schiavo. The Impact of Financial Constraints on Firms Survival and Growth. 2007. �hal-00973115�
The Impact of Financial Constraints
on Firms Survival and Growth
N° 2007-37
December 2007
Patrick MUSSO
UNSA, GREDEG and CERAM
Stefano SCHIAVO
OFCE-DRIC
The Impact of Financial Constraints on
Firm Survival and Growth
Patrick Musso∗ Stefano Schiavo†
November 2007
Abstract
We propose a new approach for identifying and measuring the degree of financial constraint faced by firms and use it to investigate the effect of financial constraints on firm survival and development. Using panel data on French manufacturing firms over the 1996 - 2004 period, we find that (i) financial constraints significantly increase the probability of exiting the market, (ii) access to external financial resources has a positive effect on the growth of firms in terms of sales, capital stock and employment, (iii) financial constraints are positively related with productivity growth in the short-run. We interpret this last result as the sign that constrained firms need to cut costs in order to generate the resources they cannot raise on financial markets.
Keywords: Financial constraints, Firm growth, Firm survival
1
Introduction
The paper develops a new approach for identifying and measuring the degree of financial constraint faced by firms, and uses it to investigate the effect of financial constraints on firm survival and growth. We propose a time-varying and continuous measure of constraint that recognizes the multifaceted feature of this phenomenon and allows one to capture different degrees of constraint. Firm exit and growth represent interesting fields of application, since financial constraints can interfere with market selection mechanisms, and therefore shape market structures in ways not necessarily consistent with efficiency. In fact, given the presence of important sunk entry costs in most markets, one can expect that constrained firms find it more difficult to grow and even to survive. Also, while a large amount of evidence exists on the relation between financial development and growth,
∗University of Nice - Sophia Antipolis, GREDEG (CNRS) and CERAM Business School.
E-mail: Patrick.Musso@gredeg.cnrs.fr
†Observatoire Fran¸cais des Conjonctures Economiques, D´epartement de Recherche sur l’Innovation et
both cross-country and cross-industry, much less is known at the microeconomic level of the firm.
We can summarize our main results as follows. First of all, we find that financial constraints significantly increase the probability of exiting the market. In addition, access to external financial resources has a positive effect on the growth of firms in terms of sales, capital stock and employment. Last, the presence of financial constraints is positively related with productivity growth in the short-run: we interpret this latter result as the sign that constrained firms need to cut costs in order to generate the resources they cannot raise on financial markets, and this results in improved efficiency.
Our contribution is twofold. First, we propose a new way to measure the degree of financial constraint, which we believe is superior to existing methodologies. Second, we shed new light on the role played by access to external financial resources in shaping firm growth and survival.
The paper is organized as follows. Next Section presents an overview of the empirical literature on financial constraints. Section 3 presents our data and illustrates the empirical methodology we propose to measure financial constraints. In Section 4, we present an application to French firms that specifically investigates the issue of growth and survival. Section 5 concludes.
2
A glance at the existing empirical literature
Since the late 1980s, a large number of empirical studies have addressed the issue of financial constraints, mainly in order to study the relation between firm investment and the availability of internal funds. Indeed, a large and convincing evidence exists showing that, when a standard investment equation is augmented with cash flow availability, the fit of the equation improves. Now, under perfect capital markets, internal and external sources of financial funds are perfectly substitutable (Modigliani and Miller, 1958), so that the availability of internal funds should not affect investment decisions.
While there is a substantial consensus on the notion that liquidity does matter in investment equations, much less agreement exists on why this is the case. Chirinko and Schaller (1995) suggest two possible hypotheses: the existence of financial constraints (due to the existence of either asymmetric information or transaction costs), and mere mispecification whereby liquidity takes up the effect of other omitted variables.
2.1 Firm growth and survival
The existence of financial constraints can obviously have important effects on the firm’s ability to grow and stay in the market. A number of studies exist on the topic, al-though many stem from the finance and growth macro literature (Levine, 2005) and focus
on comparing cross-country performances controlling for the degree of financial develop-ment. Hence, for instance, Kunt and Maksimovic (1998) and Beck, Demirguc-Kunt and Maksimovic (2005) find that financial development eases the obstacles firms face to grow faster and therefore improves macroeconomic performance. Similarly, Beck, Demirguc-Kunt, Laeven and Levine (2005) use cross-country and cross-industry data to investigate the role of financial factors in shaping the size distribution of firms. They conclude that financial development exerts a disproportionately positive effect on small firms. Yet, financial development is constant across firms operating in the same economic system. A recent work on the issue, which is very close to our analysis in spirit, is an article by Aghion, Fally and Scarpetta (2007) where the authors address the impact of financial development on firm entry, the size at entry and the post-entry performance of new firms. They find that access to external finance matters most for the entry of small firms, and that it improves market selection by allowing small firms to compete on a more equal footing. Also, financial development is shown to ameliorate significantly post-entry growth of firms. Once again, the paper’s results are based on a cross-country comparison that takes financial variables as given for all firms located in the same country. Another in-teresting investigation on the effect of credit constraints on the real economy is undertaken by Jeong and Townsend (2005), who decompose Total Factor Productivity (TFP) growth to account for a number of its determinants. They find a significant effect of aggregate financial development on aggregate TFP growth.
For what concerns microeconometric studies, most works use survey data where firms give a self-assessment of the difficulty faced in accessing external funds. Often the survey are targeted to specific issues, most notably R&D expenses or investment in innovation. So, for instance, Winker (1999) uses data collected from 1,900 enterprises in the 1982– 1991 period to show that the perceived credit constraint has a negative effect on innovation expenditures and overall investment. These results are very similar to those reported by Becchetti and Trovato (2002) and Savignac (2006) and reviewed in the previous subsection. In a different fashion, Holtz-Eakin et al. (1994) exploit a unique dataset matching personal wealth (in the form of received bequests) to survival rates among US entrepreneurs. They show that inheritances increase both the probability of survival and future sales growth of the firm whose owner benefited from the windfall, and interpret this as testifying for the existence of significant credit constraints. Binks and Ennew (1996) analyze the perceived credit constraint of 6,000 UK firms using survey data. They find that expected future growth is associated with a higher perceived constraint, so that the latter seems to play a relevant role in shaping firm development decisions. More recently, Carpenter and Petersen (2002) analyze growth of 1,600 small US firms (defined as firms whose total assets range between 5 and 100 million US dollar at time of entry) and find that asset growth is indeed constrained by the availability of internal finance. Firms able to raise a lot of external
funds (relative to the group average) in fact display higher growth rates and therefore manage to grow faster.
Overall, compelling evidence seems to exist about the substantial role played by finan-cial constraints in shaping and conditioning firm decisions underlying growth and survival.
2.2 Existing research strategies
The usual empirical strategy adopted to detect the existence and the relevance of financial constraints entails segmenting the sample ex ante into subgroups of firms with different likelihood of facing financial constraints, and test whether cash-flow plays a different role in explaining investment decisions by more/less constrained firms. Thus, for instance, Fazzari et al. (1988) claim that firms with low dividend payout ratios (likely constrained) display higher investment-cash flow sensitivity. Subsequent studies tend to find supporting evidence using a number of different variables to identify constrained firms (Bond and Meghir, 1994; Gilchrist and Himmelberg, 1995; Chirinko and Schaller, 1995).
The first paper finding opposite results is, to the best of our knowledge, Devereux and Schiantarelli (1990), which reports a higher cash flow coefficient for larger firms, even after controlling for sector heterogeneity. But it is only with the work by Kaplan and Zingales (1997) that the usefulness of investment-cash flow sensitivity as a measure of financial constraint has been definitely questioned. Exploiting qualitative information from financial statements of firms classified as constrained in Fazzari et al. (1988), the authors show that less constrained firms display substantially higher investment-cash flow sensitivity. Hence, they conclude, the latter can no longer be regarded as a useful measure of financial constraint. Since then, other authors have reported evidence of a negative relation between investment-cash flow sensitivity and financial constraints (for instance Kadapakkam et al., 1998; Cleary, 2006).
Although a reference to the above literature is due, in what follows we will try to steer clear of this debate and only review in greater detail the way in which different authors have identified financially constrained firms, irrespective of the specific aim of their study. In other words, we will review the empirical strategies adopted in the literature, keeping in mind our goal of building a time-varying and continuous measure of financial constraint.
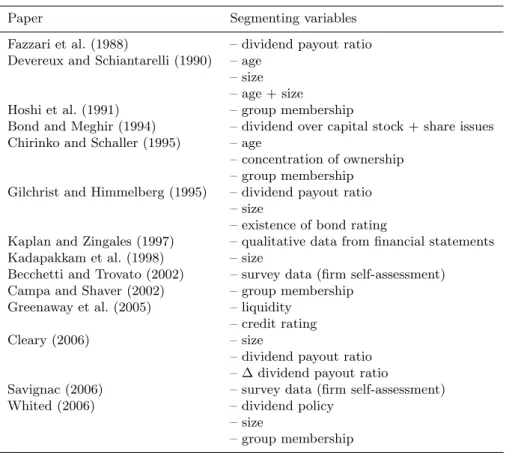
[Table 1 about here.]
Table 1 reports a list of papers in chronological order and the segmenting variables used to distinguish among constrained and unconstrained firms. Often firms are simply placed in two different groups on the basis of some arbitrary threshold, such as median values, or first quartiles (Devereux and Schiantarelli, 1990; Gilchrist and Himmelberg, 1995; Greenaway et al., 2005; Cleary, 2006). Other authors use a finer classification and classify firms in three or more groups (Fazzari et al., 1988; Kadapakkam et al., 1998;
Kaplan and Zingales, 1997). Almost all the papers rely on a limited list of variables such as size, age, dividend policy, membership in a group or conglomerate, existence of bond rating, and concentration of ownership. All these variables are meant to capture sources of informational asymmetries which can potentially constrain access to capital markets. So, for instance, Fazzari et al. (1988) claim that dividends are a residual decision in firm strategy and, under the assumption that external finance is more costly than internal funds, paying high dividends in the presence of profitable investment opportunities is not consistent with profit maximization. Hence, high dividend payout ratios signal the absence of financial constraints. Big and mature firms are likely to find easier access to external funds, as it should be easier to collect information on them compared to young and small enterprises. Similarly, membership in a larger conglomerate should facilitate market access both because of the signaling exercised and because the single firm can likely receive funds from its headquarters. Also, the mere existence of a bond rating (even irrespective of the rating itself) can signal a commitment of the firm vis-`a-vis financial markets. In a similar vein, the existence of a dominant shareholder is seen as a way to reduce the agency problem with management and therefore to act as a guarantee toward external investors. Other papers, namely Becchetti and Trovato (2002) and Savignac (2006), use survey data whereby firms themselves give a self-assessment of their difficulty to access external financial funds.
There are a few weaknesses related to the above strategies. First, Hubbard (1998) notes how most of the chosen criteria tend to be time invariant, whereas one can imagine that firms switch between being constrained or unconstrained depending on overall credit conditions, investment opportunities and idiosyncratic shocks. Second, all works relying on dividend payments are restricted to quoted firms which, at least for what concerns continental Europe, tend to be larger and more mature. As a further potential problem, we add that all the above studies rely on a unidimensional definition of financial constraint, i.e. they assume that a single variable can effectively identify the existence of a constraint, viewing the latter as a clear-cut phenomenon that is either in place or not, without allowing for different degrees. Notable exceptions are the works by Lamont et al. (2001), Cleary (1999, 2006), and Whited and Wu (2006). The first paper proposes a multivariate index that builds on Kaplan and Zingales (1997), whereby five variables are weighted using regression coefficients and collapsed into a single indicator.1 The main difficulty with this
approach is the need to extrapolate results obtained on a small sample of 49 US quoted firms (those used in Kaplan and Zingales, 1997) and apply them to a larger population (and in a different period). Furthermore, one of the variables needed to compute the index is Tobin’s Q, the use of which as a proxy for investment opportunities is rather controversial
1The variables are (i) cash flow to fixed assets, (ii) market to book ratio, (iii) debt to total assets, (iv) dividends to fixed assets, and (v) cash to fixed assets.
and lies at the core of the investment-cash flow debate outlined above. Whited and Wu (2006) take a similar route, but perform their own estimate and base their index on a structural model, whereby they measure financial constraints by means of the shadow price of capital.2
Another interesting attempt to develop a time-varying, continuous measure of financial constraints is due to Cleary (1999), which uses multiple discriminant analysis (in a way similar to Altman, 1968) to compute a score based on six variables.3 The methodology
entails two steps: first, one needs to classify firms as constrained or unconstrained accord-ing to some characteristic, and second, the statistical analysis is performed which delivers a coefficient for each of the (six) control variables.4 The score is then obtained as the
pre-dicted value of the empirical model, and it can be applied also to firms excluded from the first step of the analysis. To separate firms, Cleary (1999) makes the hypothesis that firms reducing dividend payments one year to the next are likely to be financially constrained, whereas those augmenting them are likely not to be constrained. Firms keeping dividend payment constant are not used in the multiple discriminant analysis, but later they are nonetheless attributed a score.5
3
Data and empirical strategy
3.1 Measuring financial constraints
We have two main aims when looking for a new strategy to measure financial constraints: the first is to derive a time-varying index that allows for firms being more or less con-strained in different periods; the second is to account for (possible) different degrees of financial constraints. We claim that one of the main weaknesses of earlier approaches lies in the choice of a single variable to classify firms ex ante.
We therefore build a synthetic index, collapsing information coming from seven dif-ferent variables that we esteem convey important information relative to the existence of financial constraints. They have been selected on the basis of their performance in ex-isting studies, and their perceived importance in determining ease of access to external financial funds. They are: size (measured by total assets), profitability (return on total assets), liquidity (current ratio: current asset over current liabilities), cash flow
generat-2The variables included in the model are (i) the ratio of long-term to total debt, (ii) a dividend dummy, (iii) sales growth (both for the individual firm and the sector), (iv) (the log of) total assets, (v) the number of analysts following the firm, (vi) the ratio of liquid to total assets, (vii) the industry debt to assets ratio. 3There are (i) the current ratio, (ii) the debt ratio, (iii) the fixed charge coverage, (iv) the net income margin, (v) sale growth, and (vi) slack over total assets. See Cleary (1999) for a definition of the variables. 4This is very much similar to what a probit or a logit estimation would do. In fact, multiple discriminant analysis is nothing more than an ancestor of these methodologies, which, because of current computer power, are probably preferable as more robust.
5An obvious requirement of this methodology is working with quoted firms. One could then derive a score for non quoted firms as well, but it is not clear how well the index would behave.
ing ability6, solvency (own funds over total liabilities, measuring the ability by a firm to
meet its long-term financial obligations), trade credit over total assets and repaying ability (financial debt over cash flow).
For each of these seven dimensions, and each year, we first compute the value of the firm relative to the average of all enterprises belonging to the same 2-digit NACE sector, and then place it in one of the quintiles in which the resulting distribution is divided.7
Hence, for each firm/year observation we end up with 7 scores ranging from 1 to 5, with 1 containing the smallest values. This information is then combined in different ways to obtain a synthetic index, which is then rescaled to have a common 1–10 range, with smaller values being associated with more constrained firms. In what follows, we concentrate on two ways to combine the information: (i) a simple sum of the 7 scores (Score A); (ii) the number of dimensions for which the firm/year lies in the first quintile (Score B). Interestingly, the ranking of firm/year observations is very robust to the different ways to aggregate the information from the 7 variables, with a correlation of over 0.78.8
3.2 Data sources: the EAE survey and the DIANE database
We use data from two main sources. Both of them collects information on French firms, though their coverage is somehow different. The first (EAE ) is a survey that gathers information from the financial statements and balance sheets of all individual manufac-turing firms with at least 20 employees, from 1990 to 2004.9 Each unit is endowed at
birth with an identifying number that allows us to track the firm over time. We rely on the following standard definition of continuing and exiting firms (Bellone et al., 2008): an exiting firm is an identifying number that exists in year t, but not in t + 1; a continuing firm is an identifying number that exists in years t, t + 1 and t − 1. The second source of information is the DIANE database published by Bureau van Dijk, which collects data on over 1 million French firms for the period 1996–2005. This database provides us with many financial stock variables absent from the EAE survey. Merging the two datasets yields around 104,000 firm/year observations, stemming from an unbalanced panel of over 16,500 manufacturing enterprises followed over the period 1996–2004.10
In what follows, we compute Total Factor Productivity using the so-called Multilateral
6This is the maximum amount of resources that a firm can devote to self-financing, and corresponds to the French capacit´e d’autofinancement.
7To account for the presence of outliers we trim the top and bottom 0.5% observations for each variable. 8We have tried other ways to combine the information, with identical results. Additional details are available upon request.
9The survey (Enquˆete Annuelle d’Entreprises) is conducted by the French Ministry of Industry. The surveyed unit is the legal (not the productive) unit, which means that we are dealing with firm-level data. To investigate the role of financial constraints on growth and survival, firm, rather than plant level data, seem appropriate.
10Chirinko and Schaller (1995) note that focusing on manufacturing only —as it is often done in the literature— may exaggerate the role played by financial constraints because of the specialized nature of the assets involved in those firms.
Productivity Index, first introduced by Caves et al. (1982) and extended by Good et al.
(1997). This methodology consists of computing the TFP index for firm i at time t as follows: ln T F Pit= ln Yit− ln Yt+ t P τ =2 ¡ ln Yτ − ln Yτ −1 ¢ − N P n=1 1 2 (Snit+ Snt) (ln Xnit− ln Xnt) +Pt τ =2 N P n=1 1 2 (Snτ + Snτ −1) (ln Xnτ − ln Xnτ −1) (1)
where Yit denotes the real gross output of firm i at time t using the set of N inputs Xnit, where input X is alternatively capital stocks (K); labor in terms of hours worked (L); and intermediate inputs (M ). Snit is the cost share of input Xnit in the total cost11.
Subscripts τ and n are indices for time and inputs, respectively. Symbols with an upper bar correspond to measures for the reference point (the hypothetical firm), computed as the means of the corresponding firm level variables, for all firms, in year t. This methodology is particularly well suited to comparisons of within firm-level panel datasets across industries, in that it guarantees the transitivity of any comparison between two firm-year observations by expressing each firm’s input and output as deviations from a single reference point.
Labor Productivity is defined as the log-ratio of real value added on labor (hours worked): ln LPit = ln µ Vit Lit ¶ (2) where Vit denotes the value added of the firm deflated by the sectoral price indexes
pub-lished by INSEE (French System of National Accounts).
4
Results
4.1 Firm survival
In this section, we present results from an empirical model that estimates the hazard of exit controlling for unobserved heterogeneity (for more details see Prentice and Gloeckler, 1978; Jenkins, 1995; Bellone et al., 2008). Suppose there are firms i = 1, . . . , N , which enter the industry at time t = 0. The hazard rate function is defined as the probability of failure in interval t and t + 1 divided by the probability of surviving at least until t. The hazard rate function for firm i at time t > 0 and t = 1, . . . , T is assumed to take the proportional hazard form: θit= θ(t) · X
0
itβ, where θ(t) is the baseline hazard function and 11See Bellone et al. (2008) for more details on the method and a full description of the variables.
Xit is a series of time-varying covariates summarizing observed differences among firms. The discrete time formulation of the hazard of exit for firm i in time interval t is given by a complementary log logistic function such as:
ht(Xit) = 1 − exp n − exp ³ Xit0 β + θ(t) ´o (3) where θ(t) is the baseline hazard function, relating the hazard rate ht(Xit) at the tth
interval to the spell duration. This model can be extended to account for unobserved but systematic differences among firms. Suppose that unobserved heterogeneity is described by a random variable µi independent of Xit. The proportional hazards form with unobserved
heterogeneity can be written as :
ht(Xit) = 1 − exp n − exp ³ Xit0β + θ(t) ´ + µi o (4) where µiis an unobserved individual-specific error term with zero mean, uncorrelated with
the Xs. Model (4) can be estimated using standard random effects panel data methods for a binary dependent variable, under the assumption that some distribution is provided for the unobserved term. In this paper, we assume that µi is distributed Normal.12
Results are reported in Table 2. In Columns (1) to (3), we use Score A, whereas in Columns (4) to (6) we display results obtained using Score B. The probability of exiting the market is assumed dependent on age, size, profitability, productive efficiency (TFP) and our measure of financial constraint. All variables have the expected sign and are strongly significant. The way we build our measure of financial constraint (smaller values associated with a higher degree of constraint) is consistent with the negative sign associated with the estimated coefficient: an easier access to external funds (hence a higher Score) lowers the probability of exiting the market. This results is robust to inclusion of a number of standard controls used in the literature on hazard rates: all regressions control for the age of the firm and for its size (in terms of employment), which display the expected negative sign. In Columns (2) and (3), we also add an index of technical efficiency (TFP) and a measure of profitability (operating income over assets): both play a significant role in reducing the hazard rate, and their inclusion slightly reduces the (absolute value of the) coefficient associated with the index of financial constraint, which nevertheless remains significant and displays the same order of magnitude.
[Table 2 about here.]
Similarly, results are rather robust to the choice of the way we measure financial constraints. Substituting Score B for Score A in fact does not alter the results; the only
12See Chapters 17 and 18 of Cameron and Trivedi (2005) for a discussion on the appropriate choice of distribution for the parameter of unobserved heterogeneity.
minor change is due to the fact that profitability, while retaining the expected negative sign, is no longer significantly different from zero. Remarkably, the size of the of the financial constraints coefficients is very stable and does not depend at all on the choice of the Score included in the regression.
4.2 Firm growth
We move now to investigate the impact of financial constraints on firm growth, both in terms of size and in terms of productivity. To do this, we will focus hereafter on results obtained using Score A only, as this does not alter the resulting picture.
[Table 3 about here.]
In Table 3, we report results obtained investigating the relation between size growth at different time horizons, initial financial constraints, and a set of standard control variables. We measure size growth in terms of (i) output, (ii) employment, and (iii) capital stock. Growth is computed over three different time spans: 1-, 3- and 5-years. Controls include the age of the firm, productive efficiency (TFP), and initial size. Once again, results are very stable across specifications, choice of the dependent variable, and time horizon. Access to external financial resources does have a positive effect on firm growth, even after controlling for productivity, initial size and age. The effect is somewhat smaller over the longer 5-year horizon, and is less significant for employment growth. As our measure of employment is worked hours, we suppose that financial constraints pose fewer problems in this domain: it is reasonably easier to finance an increase in worked hours than the investment needed to enlarge the capital stock. Initial size is negatively related with future growth, meaning that smaller firms tend to grow faster. Also, initial productivity is positively related with growth in employment and in the stock of capital, whereas it displays a negative coefficient in the output regression.
[Table 4 about here.]
Last, in Table 4, we present results based on a regression where the dependent variable is the growth rate of productive efficiency, both in terms of TFP and in terms of average labor productivity. We find that initial size is positively related to future productivity growth, whereas the latter is lower for more productive firms. Interestingly, the presence (and degree) of financial constraints exert a positive effect on the dynamic of efficiency. We read this phenomenon as an indication that constrained firms are forced to improve their efficiency in order to remain on the market. Since by construction we observe future productivity growth of successful firms only, there is an evident self-selection that drives our result. Moreover, such a behavior is consistent with works by Nickell et al. (1997)
and Nickell and Nicolitsas (1999) on the role of financial pressure on firm performance. In particular, Nickell and Nicolitsas (1999) find that financial pressure is associated with gains in productivity, and suggest that financial market discipline helps solving agency problems and therefore improves firm performance. In light of the results displayed in Table 4, it would be interesting to pursue this line of research and test the effect of financial constraints on short- versus long-term efficiency. In fact, it is reasonable to expect that, in the attempt to free financial resources, constrained firms will scale down long-term investment (for instance R&D), with detrimental effects on longer term growth prospects.
5
Conclusions
In this paper, we have proposed a new methodology to measure financial constraints using a synthetic index based on a number of different variables. Our measure has two main advantages over existing methods: first, it accounts for the multifaceted nature of the phenomena under investigation, and, second, it delivers a time-varying, continuous measure. The index is then applied to the study of firm survival and growth. The relation between financial constraints at the firm level and structural issues such as innovation and growth is a long standing issue in the economic arena. It has recently enjoyed renewed interest, as papers by Aghion et al. (2005), Aghion, Askenazy, Berman, Cette and Eymard (2007), and Aghion, Fally and Scarpetta (2007) testify.
We have shown that financial constraints play a significant role in determining the probability of firm survival, even after controlling for size, age, profitability and productive efficiency. Moreover, access to external funds increases firm growth. On the other hand, and consistent with previous results, our measure of financial constraint is associated with positive productivity growth in the short-run. Future work will add R&D and innovation expenditures to the picture, to see whether financial constraints have a different effect on long-term efficiency.
Acknowledgements
The authors blame each other for any remaining mistakes. They nevertheless agree on the need to thank Sylvain Barde, Flora Bellone, Jean-Luc Gaffard, Evens Salies, and above all Lionel Nesta for useful comments and discussions.
References
Aghion, P., Angeletos, G.-M., Banerjee, A. and Manova, K. (2005), Volatility and growth: Credit constraints and productivity-enhancing investment, Working Paper 11349, Na-tional Bureau of Economic Research.
Aghion, P., Askenazy, P., Berman, N., Cette, G. and Eymard, L. (2007), Credit constraints and the cyclicality of R&D investment: Evidence from France, Working Paper 2007-4, Weatherhead Center for International Affairs.
Aghion, P., Fally, T. and Scarpetta, S. (2007), ‘Credit constraints as a barrier to the entry and post-entry growth of firms’, Economic Policy 22(52), 731–79.
Altman, E. (1968), ‘Financial ratios, discriminant analysis and the prediction of corporate bankruptcy’, The Journal of Finance 23(4), 589–609.
Becchetti, L. and Trovato, G. (2002), ‘The determinants of growth of small and medium sized firms. The role of the availability of external finance’, Small Business Economics 19(4), 291–306.
Beck, T., Demirguc-Kunt, A. and Maksimovic, V. (2005), ‘Financial and legal constraints to firm growth: Does firm size matter?’, Journal of Finance LX(1), 137–77.
Beck, T., Demirguc-Kunt, A., Laeven, L. and Levine, R. (2005), Finance, firm size, and growth, Policy Research Working Paper Series 3485, The World Bank.
Bellone, F., Musso, P., Nesta, L. and Qu´er´e, M. (2008), ‘Market selection along the firm life cycle’, Industrial and Corporate Change. forthcoming.
Binks, M. and Ennew, C. (1996), ‘Growing firms and the credit constraint’, Small Business
Economics 8(1), 17–25.
Bond, S. and Meghir, C. (1994), ‘Dynamic investment models and the firm’s financial policy’, Review of Economic Studies 61(2), 197–222.
Cameron, A. and Trivedi, P. (2005), Microeconometrics: Methods and Applications, Cam-bridge University Press.
Campa, J. M. and Shaver, J. M. (2002), Exporting and capital investment: On the strate-gic behavior of exporters, IESE Research Papers 469, IESE Business School.
Carpenter, R. and Petersen, B. (2002), ‘Is the growth of small firms constrained by internal finance?’, Review of Economics & Statistics 84(2), 298 – 309.
Caves, D. W., Christensen, L. R. and Diewert, W. E. (1982), ‘Multilateral comparisons of output, input, and productivity using superlative index numbers’, Economic Journal 92(365), 73–86.
Chirinko, R. and Schaller, H. (1995), ‘Why does liquidity matter in investment equations?’,
Journal of Money, Credit and Banking 27(2), 527–48.
Cleary, S. (1999), ‘The relationship between firm investment and financial status’, Journal
Cleary, S. (2006), ‘International corporate investment and the relationships between fi-nancial constraint measures’, Journal of Banking & Finance 30(5), 1559–80.
Demirguc-Kunt, A. and Maksimovic, V. (1998), ‘Law, finance, and firm growth’, Journal
of Finance LIII(6), 2107–137.
Devereux, M. and Schiantarelli, F. (1990), Investment, financial factors and cash flow: Evidence from U.K. panel data, in G. Hubbard, ed., ‘Information, Capital Markets and Investment’, University of Chicago Press, pp. 279–306.
Fazzari, S., Hubbard, G. and Petersen, B. (1988), ‘Financing constraints and corporate investment’, Brookings Papers on Economic Activity 1, 141–95.
Gilchrist, S. and Himmelberg, C. (1995), ‘Evidence on the role of cash flow for investment’,
Journal of Monetary Economics 36(3), 541–572.
Good, D. H., Nadiri, M. I. and Sickles, R. (1997), Index number and factor demand ap-proaches to the estimation of productivity, in H. Pesaran and P. Schmidt, eds, ‘Hand-book of Applied Econometrics: Microeconometrics’, Blackwell, Oxford, pp. 14–80. Greenaway, D., Guariglia, A. and Kneller, R. (2005), Do financial factors affect exporting
decisions?, GEP Research Paper 05/28, Leverhulme Center.
Holtz-Eakin, D., Joulfaian, D. and Rosen, H. (1994), ‘Sticking it out: Entrepreneurial survival and liquidity constraints’, Journal of Political Economy 102, 53–75.
Hoshi, T., Kashyap, A. and Scharfstein, D. (1991), ‘Corporate structure, liquidity, and investment: Evidence from Japanese industrial groups’, The Quarterly Journal of
Eco-nomics 106(1), 33–60.
Hubbard, G. (1998), ‘Capital-market imperfections and investment’, Journal of Economic
Literature 36(1), 193–225.
Jenkins, S. (1995), ‘Easy ways to estimate discrete time duration models’, Oxford Bulletin
of Economics and Statistics 57, 129–138.
Jeong, H. and Townsend, R. (2005), Discovering the sources of TFP growth: Occupational choice and financial deepening, Working Paper 05.19, IEPR.
Kadapakkam, P.-R., Kumar, P. and Riddick, L. (1998), ‘The impact of cash flows and firm size on investment: The international evidence’, Journal of Banking & Finance 22(3), 293–320.
Kaplan, S. and Zingales, L. (1997), ‘Do investment-cash flow sensitivities provide useful measures of financing constraints?’, The Quarterly Journal of Economics 112(1), 169– 215.
Lamont, O., Polk, C. and Saa-Requejo, J. (2001), ‘Financial constraints and stock returns’,
Review of Financial Studies 14(2), 529–54.
Levine, R. (2005), Finance and growth: Theory and evidence, in P. Aghion and S. Durlauf, eds, ‘Handbook of Economic Growth’, Vol. 1, Elsevier, chapter 12, pp. 865–934.
Modigliani, F. and Miller, M. (1958), ‘The cost of capital, corporation finance and the theory of investment’, The American Economic Review 48(3), 261–97.
Nickell, S. and Nicolitsas, D. (1999), ‘How does financial pressure affect firms?’, European
Economic Review 43(8), 1435–1456.
Nickell, S., Nicolitsas, D. and Dryden, N. (1997), ‘What makes firms perform well?’,
European Economic Review 41(3-5), 783–796.
Prentice, R. and Gloeckler, L. (1978), ‘Regression analysis of grouped survival data with application to breast cancer data’, Biometrics 34, 57–67.
Savignac, F. (2006), The impact of financial constraints on innovation : evidence from French manufacturing firms, Cahiers de la Maison des Sciences Economiques v06042, Universit´e Panth´eon-Sorbonne (Paris 1).
Whited, T. (2006), ‘External finance constraints and the intertemporal pattern of inter-mittent investment’, Journal of Financial Economics 81(3), 467–502.
Whited, T. and Wu, G. (2006), ‘Financial constraints risk’, Review of Financial Studies 19(2), 531–59.
Winker, P. (1999), ‘Causes and effects of financing constraints at the firm level’, Small
Table 1: Segmenting variables used in the literature
Paper Segmenting variables
Fazzari et al. (1988) – dividend payout ratio
Devereux and Schiantarelli (1990) – age – size – age + size
Hoshi et al. (1991) – group membership
Bond and Meghir (1994) – dividend over capital stock + share issues Chirinko and Schaller (1995) – age
– concentration of ownership – group membership Gilchrist and Himmelberg (1995) – dividend payout ratio
– size
– existence of bond rating
Kaplan and Zingales (1997) – qualitative data from financial statements
Kadapakkam et al. (1998) – size
Becchetti and Trovato (2002) – survey data (firm self-assessment)
Campa and Shaver (2002) – group membership
Greenaway et al. (2005) – liquidity
– credit rating
Cleary (2006) – size
– dividend payout ratio – ∆ dividend payout ratio
Savignac (2006) – survey data (firm self-assessment)
Whited (2006) – dividend policy
– size
Table 2: Firm survival Score A Score B (1) (2) (3) (4) (5) (6) fin constr -0.16342 -0.14474 -0.13349 -0.16723 -0.15328 -0.1476 [0.0154]*** [0.0157]*** [0.0164]*** [0.0119]*** [0.0121]*** [0.0128]*** log empl -3.61161 -3.66843 -3.63775 -3.62153 -3.67192 -3.65528 [0.1130]*** [0.1139]*** [0.1143]*** [0.1126]*** [0.1135]*** [0.1140]*** log TFP -1.53346 -1.16557 -1.44053 -1.23854 [0.2566]*** [0.2965]*** [0.2539]*** [0.2940]*** log profit -0.42446 -0.23124 [0.1738]** [0.1710] constant 35.8454 36.30043 36.07551 36.34993 36.76391 36.63507 [1.2410]*** [1.2487]*** [1.2496]*** [1.2367]*** [1.2442]*** [1.2465]*** Observations 75,397 75,397 75,397 75,397 75,397 75,397 Firms 14,963 14,963 14,963 14,963 14,963 14,963
Link function: complementary log-log with unobserved heterogeneity. Non parametric baseline, hazard Function. All models include a full vector of industry dummies, year dummies and an indicator variable for the age of the firm. Standard errors in brackets.
T able 3: Firm size gro wth (Within regression) Output Emplo ymen t Capital sto ck (1) (2) (3) (4) (5) (6) (7) (8) (9) t,t+1 t,t+3 t,t+5 t,t+1 t,t+3 t,t+5 t,t+1 t,t+3 t,t+5 fin constr t=0 0.00225 0.00251 0.00094 0.00072 0.00182 0.00026 0.00336 0.00257 0.00119 [0.00058]*** [0.00037]*** [0.00029]*** [0.00044] [0.00030]*** [0.00024] [0.00053]*** [0.00039]*** [0.00030]*** log TFP t=0 -0.3276 -0.16809 -0.0875 0.18328 0.11817 0.07426 0.18037 0.15251 0.07395 [0.00958]*** [0.00595]*** [0.00478]*** [0.00727]*** [0.00489]*** [0.00399]*** [0.00851]*** [0.00619]*** [0.00489]*** log output t=0 -0.02777 -0.04526 -0.03733 [0.00108]*** [0.00085]*** [0.00075]*** log empl t=0 -0.02874 -0.05258 -0.04473 [0.00100]*** [0.00088]*** [0.00081]*** log capital t=0 -0.02982 -0.0526 -0.05165 [0.00084]*** [0.00079]*** [0.00077]*** constan t 0.37113 0.5072 0.47131 0.37176 0.61124 0.56676 0.24153 0.5025 0.51061 [0.02469]*** [0.01403]*** [0.01161]*** [0.02068]*** [0.01350]*** [0.01191]*** [0.01843]*** [0.01404]*** [0.01166]*** Observ ations 64,261 42,823 25,248 64,261 42,823 25,248 64,261 42,823 25,248 Firms 13,365 11,280 9,485 13,365 11,280 9,485 13,365 11,280 9,485 Standard errors in brac kets * significan t at 10%; ** significan t at 5%; *** significan t at 1% All mo dels include a full vector of time-industry dummies.
Table 4: Firm productivity growth (Within regression) TFP Labor productivity (1) (2) (3) (4) (5) (6) t,t+1 t,t+3 t,t+5 t,t+1 t,t+3 t,t+5 fin constrt=0 -0.00114 -0.00128 -0.00065 -0.00658 -0.00359 -0.00192 [0.0002]*** [0.0001]*** [0.0001]*** [0.0005]*** [0.0003]*** [0.0002]*** log productt=0 -0.30844 -0.21171 -0.13836 -0.12295 -0.11437 -0.07419 [0.0031]*** [0.0016]*** [0.0013]*** [0.0019]*** [0.0012]*** [0.0010]*** log emplt=0 0.00573 0.00414 0.00389 0.02334 0.02013 0.01291 [0.0004]*** [0.0003]*** [0.0002]*** [0.0012]*** [0.0008]*** [0.0006]*** constant -0.0653 -0.02868 -0.04829 -0.32243 -0.29077 -0.18809 [0.0090]*** [0.0040]*** [0.0032]*** [0.0223]*** [0.0125]*** [0.0095]*** Observations 64,261 42,823 25,248 64,261 42,823 25,248 Firms 13,365 11,280 9,485 13,365 11,280 9,485
Standard errors in brackets
* significant at 10%; ** significant at 5%; *** significant at 1% All models include a full vector of time-industry dummies.
![Table 2: Firm survival Score A Score B (1) (2) (3) (4) (5) (6) fin constr -0.16342 -0.14474 -0.13349 -0.16723 -0.15328 -0.1476 [0.0154]*** [0.0157]*** [0.0164]*** [0.0119]*** [0.0121]*** [0.0128]*** log empl -3.61161 -3.66843 -3.63775 -3.62153 -3.67192 -3.](https://thumb-eu.123doks.com/thumbv2/123doknet/12918581.373124/18.892.138.757.173.426/table-firm-survival-score-score-fin-constr-empl.webp)
![Table 4: Firm productivity growth (Within regression) TFP Labor productivity (1) (2) (3) (4) (5) (6) t,t+1 t,t+3 t,t+5 t,t+1 t,t+3 t,t+5 fin constr t=0 -0.00114 -0.00128 -0.00065 -0.00658 -0.00359 -0.00192 [0.0002]*** [0.0001]*** [0.0001]*** [0.0005]*** [0](https://thumb-eu.123doks.com/thumbv2/123doknet/12918581.373124/20.892.130.766.175.422/table-firm-productivity-growth-regression-labor-productivity-constr.webp)
