HAL Id: hal-01523072
https://hal.archives-ouvertes.fr/hal-01523072
Submitted on 16 May 2017
HAL is a multi-disciplinary open access
archive for the deposit and dissemination of
sci-entific research documents, whether they are
pub-lished or not. The documents may come from
teaching and research institutions in France or
abroad, or from public or private research centers.
L’archive ouverte pluridisciplinaire HAL, est
destinée au dépôt et à la diffusion de documents
scientifiques de niveau recherche, publiés ou non,
émanant des établissements d’enseignement et de
recherche français ou étrangers, des laboratoires
publics ou privés.
Distributed under a Creative Commons Attribution| 4.0 International License
Introduction to Conformal Predictors Based on Fuzzy
Logic Classifiers
A. Murari, Jesús Vega, D. Mazon, T. Courregelongue
To cite this version:
A. Murari, Jesús Vega, D. Mazon, T. Courregelongue. Introduction to Conformal Predictors Based
on Fuzzy Logic Classifiers. 8th International Conference on Artificial Intelligence Applications and
Innovations (AIAI), Sep 2012, Halkidiki, Greece. pp.203-213, �10.1007/978-3-642-33412-2_21�.
�hal-01523072�
Introduction to Conformal Predictors based on Fuzzy
Logic Classifiers
By A.Murari1, J.Vega2, D.Mazon3, T.Courregelongue4 and JET-EFDA
Contributors*
JET-EFDA, Culham Science Centre, OX14 3DB, Abingdon, UK
1 Consorzio RFX-Associazione EURATOM ENEA per la Fusione, I-35127 Padova, Italy 2 Asociación EURATOM-CIEMAT para Fusión, CIEMAT, Madrid, Spain 3 Association EURATOM-CEA, CEA Cadarache, 13108 Saint-Paul-lez-Durance, France
4 Arts et Métiers ParisTech Engineering College (ENSAM) 75013 Paris. * See the Appendix of F. Romanelli et al., Proceedings of the 23rd IAEA Fusion Energy
Conference 2010, Daejeon, Korea
Abstract. In this paper, an introduction to the main steps required to develop
conformal predictors based on fuzzy logic classifiers is provided. The more delicate aspect is the definition of an appropriate nonconformity score, which has to be based on the membership function to preserve the specificities of Fuzzy Logic. Various examples are introduced, to describe the main properties of fuzzy logic based conformal predictors and to compare their performance with alternative approaches. The obtained results are quite promising, since conformal predictors based on fuzzy classifiers show the potential to outperform solutions based on the nearest neighbour in terms of ambiguity, robustness and interpretability
Keywords: Fuzzy Logic, Membership Function
1 Introduction
Various machine learning techniques, particularly kernel methods, have been recently developed to handle high dimensional data sets more efficiently [1,2,3,4]. Even if they constitute a significant step forward, these approaches have typically the drawback that they do not provide estimates of the reliability of their predictions. This problem has motivated the development of techniques to hedge the estimates of machine learning tools, by providing statistically sound indicators of the reliability of their results. A new family of techniques, called conformal predictors [5], has very recently started to be adopted in the scientific communities such as Nuclear Fusion research [6]. They have been formalised mainly for classification and they “hedge” their prediction by providing two parameters, credibility and confidence, which can be used to determine the level of trust that can be attributed to their estimates.
In this paper, the approach of conformal prediction is applied to the classification based on Fuzzy Logic methods [7,8]. A supervised fuzzy logic classifier is assumed and then the credibility and confidence estimators are calculated, using the
membership functions provided by the classifier. The proposed approach presents several advantages. First of all the classification can exploit the flexibility of the fuzzy logic formalism and therefore the final system can be optimised for the specific problem at hand (by selecting an appropriate membership function or the level of fuzziness for example). Moreover the fuzzy logic approach can be also tuned to improve the interpretability of the results [9,10], an aspect which can be of particular relevance in scientific investigations of complex systems.
2 Numerical Example of Conformal Predictors
As a reference, in this section a simple traditional conformal predictor based on the nearest neighbour technique is introduced. When a new example zn = (xn, yn) is
available for classification, the nearest-neighbour method finds the xi closest to xn and
uses its label yi as the prediction of yn. At this point, it is natural to measure the
nonconformity of the new example zn with respect to the one of the old examples zi
by comparing x’s distances to old objects with the same label to its distance to old objects with a different label. For example, the nonconformity scores can be calculated as:
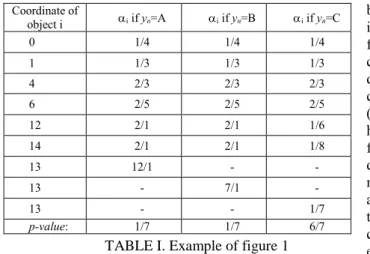
label different a with neighbour nearest s z' to ce an t dis label same the with neighbour nearest s z' to ce an t dis & & 1 : min & & 1 : min j i i j j i i j i y y i j n j x x y y i j n j x x (1)As an intuitive, one dimensional example, the methodology can be applied to a set of points on a straight line, assuming that they belong to three different classes (A, B and C see fig. 1). The aim is to classify the new point Q with confidence and credibility. The points already classified are assumed to be: [0,1,4,6,12,14]. Table I summarizes the results of the required computations. Columns 2-4 give the nonconformity scores calculated according to equation (3). Column 2 (respectively 3 and 4) represents the p-values assuming that the object to classify belongs to class A (respectively B and C).
Therefore, the point Q is classified as class C with a credibility of 6/7 = 0.857 and a confidence of 1 - 1/7 = 0.857. In the next sections, various ways to build conformal predictors based on fuzzy logic systems are presented. The nonconformity scores are based on the membership function.
FIG. 1. Point Q must be classified as class C 12 14 6 4 1 0 Q
Class A Class B Class C
12 14 6 4 1 0 Q
3 Introduction to Conformal Predictors based on Fuzzy Classifiers
The objective of this paper consists of start comparing new conformal predictors based on fuzzy systems with a conformal predictor based on the nearest neighbour [6]. In this section, mainly to exemplify the fundamental aspects of the proposed approach, it is assumed that a fuzzy classifier is available and that new objects have to be classified. For the purpose of this section, this fuzzy classifier can be taken without further discussion, because the objective is to introduce the formulas for the non conformity scores to develop fuzzy based conformal predictors (and not to describe how the membership functions are determined). The membership functions are therefore assumed to be given and do not change when new elements have to be classified. For the sake of simplicity, the one dimensional example, introduced in the previous section, is also considered as the reference to show how a conformal predictor can be based on a fuzzy classifier.
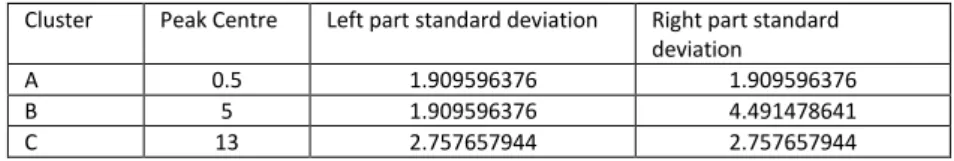
As mentioned, it is assumed that the fuzzy classifier has already been trained. The membership functions are represented as Gaussian-like functions (see equation 2), whose parameters are chosen so that their sum equals 1. The values of the chosen Gaussian functions are reported in table II and their graphical representation is given in figure 2. The partition matrix U, which is associated to these membership functions, contains the membership value of each object to each class and is organised with the columns representing the samples and the rows the clusters. For the points already considered in the example of the conformal classifier based on the nearest neighbour [0,1,4,6,12,14], the partition matrix is the one given by equation 3.
x
e
ii
A
B
C
i c x,
,
,
)
(
2 2 ) (
(2) Coordinate of object i i if yn=A i if yn=B i if yn=C 0 1/4 1/4 1/4 1 1/3 1/3 1/3 4 2/3 2/3 2/3 6 2/5 2/5 2/5 12 2/1 2/1 1/6 14 2/1 2/1 1/8 13 12/1 - - 13 - 7/1 - 13 - - 1/7 p-value: 1/7 1/7 6/7 9364 . 0 9364 . 0 0399 . 0 1343 . 0 2969 . 0 9755 . 0 40 . 1 33 . 1 0158 . 0 0049 . 0 0001 . 0 49 . 1 8719 . 0 1115 . 0 0325 . 0 1864 . 0 9663 . 0 9663 . 0 8 11 5 e e e U (3)
In order to obtain a conformal predictor, the credibility and the confidence of the various classifications must be calculated. Therefore we have to find an expression for the nonconformity score. In order to preserve the specificities of Fuzzy Logic, it has been decided to base the non conformity score on the membership functions. The main point is therefore to express the nonconformity score αik of the new element k to class i in terms of its membership function µik. Two main approaches are conceivable: 1) the evaluation of the nonconformity score can be based only on the membership function of the new element to be classified or 2) the evaluation of the nonconformity score can be based on the comparison between the level of membership of the new element to its class and the membership of the other elements to the same class. These two different approaches are described in more detail in the next two subsections
3.1 Calculation of the nonconformity score based only on the membership function of the new element
The nonconformity score can be based only on the membership values of the new element to be classified and expressed in terms of the difference between the membership of the new elements to one class and its membership to the other classes. Basically the nonconformity score of a new object is low if its membership to a class is much higher than its memberships to all the other classes. In more detail, the nonconformity score of the new object should be low when the difference between the value of the membership to its class and the maximum of the membership values to the other classes is high. On the contrary, the higher the membership values of the new element to classify in the clusters different from its one, the higher its non conformity score should be. The previous considerations can be formalised using the
TABLE II. Characteristics of the three Gaussian-like functions used in the supervised fuzzy classifier
Cluster Peak Centre Left part standard deviation Right part standard deviation
A 0.5 1.909596376 1.909596376 B 5 1.909596376 4.491478641 C 13 2.757657944 2.757657944
FIG. 2. Gaussian-like functions representing the membership functions
resulting from the training of a hypothetical supervised fuzzy classifier.
following equations, which constitute different ways of quantifying the difference between the membership of the new elements to its class and its membership to the others:
ik
1
ik
max
lk:
1
l
c
&
l
i
(4)
ik
lkl
c
l
i
ik
1
*
max
:
1
&
(5) (6)where µik is the membership value of the of the new element k to its class i, αik is its
nonconformity score, c is the number of classes. The fact that equation (6) can diverge is not a problem for conformal predictors since this does not jeopardise the calculation of the p-values on which the entire approach is based. It is worth mentioning that two nonconformity measures similar to equations (4) (and (7) in the following subsection) have already been proposed for a neural network conformal predictor in [11].
3.2 Comparison with membership values of all the elements to the class of the new one
An alternative way to calculate the nonconformity score is based on the comparison of the membership value of the new element to its class and the membership values to the same class of all the other elements, which are not classified in the same class by the fuzzy classifier. Basically the nonconformity score is low if there is a big difference between the membership function of the new point to its assumed class and the membership functions to the same class of the points not in the same class. In more detail, the higher the difference between the membership function of the new element to its class and the highest level of the membership of the elements not classified in the same class, the lower the nonconformity score should be. Again these remarks are quantified by the following equations:
(7) (8)
lkl
c
l
i
ik ik
&
1
:
max
1
1
im m k
ik ik c c N m : max 1 suchas 1 1
ik k m im ik c c N m
max :1 suchas In these relations m is the index of the examples to classify (up to N) and the inequality cm ≠ ck indicates that only the examples with a different class as the one of
the new element are considered. An alternative way of quantifying the difference between the membership of the new element to its class and the membership values of the other elements not in the same class can be based not on the max value but on the sum of the memberships of all the elements not in the same class. This can be expressed in mathematical terms by the next equations:
(9)
ik
im m k
ik 1
*sum
:1mNsuchasc c
(10)Again the fact that equation (8) can in principle diverge is not a problem for conformal predictor since this dos not jeopardise the calculation of the p-values on which the entire approach is based.
3.3 Comparison between the supervised fuzzy system and the nearest neighbour
The same analysis, as the one for the nearest neighbour case, has been performed to obtain the p-values, the credibility and the confidence on the basis of the fuzzy logic based nonconformity scores introduced in the previous two subsections. In order to compute the non conformity scores for the new points, we need to know the classification of the previous ones, which is given by the following Z matrix
T C C B B A A Z 0 1 4 6 12 14 (11)
Using the membership function shown in fig.3, the p-values, the credibility
and the confidence are computed for two
new points, namely x=0.5 and x=2, to
exemplify the differences between the
fuzzy based and nearest neighbour
techniques. According to the theory of
conformal predictors [5], the new points
are assumed to belong alternatively to
each of the possible classes and their
credibility and confidence are calculated.
The new points are then classified in the
class for which their credibility is the
highest.
ik k m im ik c c N m sum :1 suchas FIG. 3. Membership values for the tested points
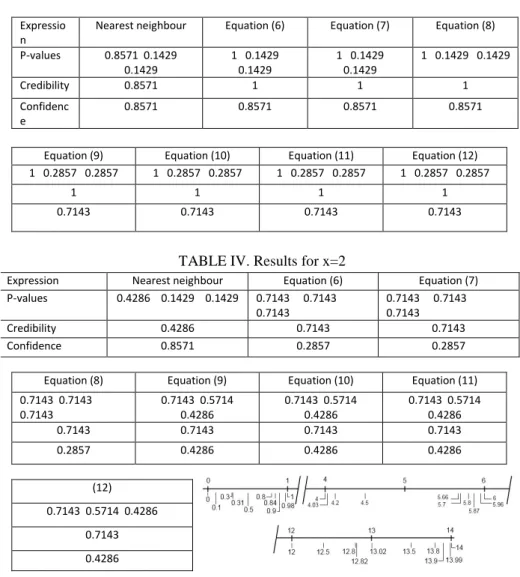
The results reported in tables III and IV show that the credibility values computed by the supervised fuzzy system are higher than the ones of the nearest neighbour. On the other hand, the confidence of the best formulas is no higher than the one of the nearest neighbour. It is noteworthy that for the example x=2, some of the formulas, used to derive the nonconformity score from the membership functions, give the same value of the maximum p-value for more than one class. These are ambiguities which should be avoided. This aspect and more in general a statistical analysis of the various alternatives to assess their performance are discussed in next section.
Expression Nearest neighbour Equation (6) Equation (7) P-values 0.4286 0.1429 0.1429 0.7143 0.7143 0.7143 0.7143 0.7143 0.7143 Credibility 0.4286 0.7143 0.7143 Confidence 0.8571 0.2857 0.2857
Equation (8) Equation (9) Equation (10) Equation (11) 0.7143 0.7143 0.7143 0.7143 0.5714 0.4286 0.7143 0.5714 0.4286 0.7143 0.5714 0.4286 0.7143 0.7143 0.7143 0.7143 0.2857 0.4286 0.4286 0.4286 (12) 0.7143 0.5714 0.4286 0.7143 0.4286 Expressio n
Nearest neighbour Equation (6) Equation (7) Equation (8)
P-values 0.8571 0.1429 0.1429 1 0.1429 0.1429 1 0.1429 0.1429 1 0.1429 0.1429 Credibility 0.8571 1 1 1 Confidenc e 0.8571 0.8571 0.8571 0.8571
Equation (9) Equation (10) Equation (11) Equation (12) 1 0.2857 0.2857 1 0.2857 0.2857 1 0.2857 0.2857 1 0.2857 0.2857
1 1 1 1
0.7143 0.7143 0.7143 0.7143
TABLE III. Results for x=0.5
TABLE IV. Results for x=2
3 Statistical Analysis of the proposed classifiers
In this section, the results of an exhaustive statistical analysis of the fuzzy based conformal predictors are reported. The intention is to compare the results obtained with the various nonconformity measures reported in subsections 3.1 and 3.2. In this perspective, we analyse the interval [-5 18.5] with a step of 0.005, namely a total of 4701 points is considered, and compare the different performance between the various nonconformal predictors. This study relies on the example seen in fig. 2, where membership functions are represented by Gaussians. To increase the accuracy of the results, the algorithm has been implemented starting with 30 initial points, supposed already correctly classified and spread randomly in the three classes. Figure 4 shows these original points and how they are distributed.
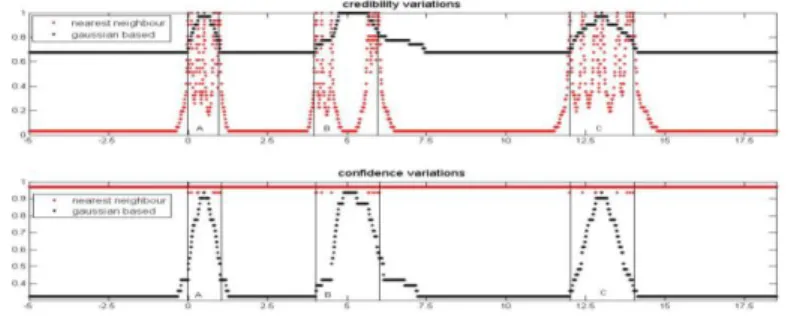
The main criteria to assess the performance of the various conformal predictors involve the values of credibility and confidence. For the objects correctly classified, it is desirable to obtain high values of these two parameters to avoid unnecessary uncertainties. In figure 5 the results obtained with equation (6) are compared with the nearest neighbour. Both credibility and confidence vary more smoothly for the system based on the fuzzy membership and the follow the shape of the classes. They increase in the regions of the predefined classes as would be expected from an intuitive point of view. On the other hand the nearest neighbour presents a confidence which can be zero for points which are at the very centre of the classes. The discriminative power of the fuzzy based conformal predictor is therefore higher than the one of the nearest neighbour. Moreover the conformal predictor based on the fuzzy membership is more conservative, since in general its confidence is lower than the one built on top of the nearest neighbour. These qualities are shared by various conformal predictors based on the Gaussian-type fuzzy memberships as shown in figure 6, where credibility and confidence for the various alternatives are reported. The conformal predictors, based on the nonconformity score expressed by equations (4) and (5), show an evolution very similar to the one obtained from equation (6) just discussed. The others present performance in general less satisfactory. On the other hand, the conformal predictors based on equations (7) and (9) show a positive characteristic, namely an increase of the confidence on the extreme left and right ends of the investigated intervals. In some applications this could be positive since when the new point to classify is located
FIG. 5. Credibility and confidence levels with 30 initials points using the nearest neighbour technique in red and the Gaussian based conformal predictors in black. The numerical
passed one of the two extreme classes (the leftmost or rightmost), it can be sensible to consider low the ambiguity of its classification.
FIG.6. Visual comparison between the computations of the Gaussian based conformal predictors using relations (4) to (10)
A summary of the relative merits of the various fuzzy based conformal predictors is reported in tables V and VI. To make the interpretation of the results easier, the investigation has been particularised for two types of objects, the ones inside and the ones outside the original classes defined in figure 1. The average confidence and
credibility have been then calculated for all the examples falling in each of the category. The fact that equations (5) and (6) provide the best performance is confirmed. Indeed they present the highest level of credibility and confidence once the results are averaged over the outside and inside class analyses. The choice between the two can depend on the application. On the other hand, as already mentioned, if the maximum
TABLE.V. Inside class analysis
Nonconformity expression Credibility mean Confidence mean Nb. of ambiguities Nearest neighbour 0.4801 0.9668 93 Expression (6) 0.8529 0.5562 0 Expression (7) 0.8826 0.5533 0 Expression (8) 0.8903 0.7022 0 Expression (9) 0.8930 0.3493 0 Expression (10) 0.8930 0.3226 0 Expression (11) 0.8930 0.3416 0 Expression (12) 0.8930 0.3226 0
TABLE.VI. Outside class analysis
Nonconformity expression Credibility mean Confidence mean Nb. of ambiguities Nearest neighbour 0.0625 0.9677 3191 Expression (4) 0.6948 0.3368 2906 Expression (5) 0.7487 0.3367 1692 Expression (6) 0.6846 0.3334 3271 Expression (7) 0.6809 0.5031 1703 Expression (8) 0.6838 0.3226 3428 Expression (9) 0.6838 0.4944 1766 Expression (10) 0.6838 0.3226 3428
p-value for one sample appears in more than one class, there is an ambiguity and the algorithm is not able to classify the sample. Nonconformity scores which present less ambiguous cases are to be preferred because they have more refined discrimination capability and in this respect the conformal predictor based on equation (5) clearly outperforms the one based on equation (6).
5 Interpretation of the results and future developments
The results reported in the last two sections indicate that, provided the appropriate equation for the non conformity score is chosen, fuzzy logic classifiers can be a good basis on which to build conformal predictors. In general the obtained performances are quite good. Compared to a simple conformal predictor based on the nearest neighbour, the conformal predictors based on fuzzy classifiers seem to provide results more in agreement with intuition. Credibility is higher for the new objects which fall within the original classes and equal or lower outside (except for the cases using equations (8) and (9) for the nonconformity score which do no perform any better than a conformal predictor based on the nearest neighbour). The fuzzy logic predictors provide a much more discriminating confidence parameter, which is typically lower than the one of the nearest neighbour in the delicate regions at the borders between the two classes. Moreover, both confidence and credibility vary much more smoothly over the input space and this at least increases the interpretability of the results quite a lot.
Acknowledgments
This work, supported by the European Communities under the contract of Association between EURATOM/ENEA/CIEMAT and CEA, was carried out under the framework of the European Fusion Development Agreement. The views and opinions expressed herein do not necessarily reflect those of the European Commission.
References
1. V.N.Vapnik “The nature of statistical learning theory” Springer, New York, 2000 Second edition 2. S.Theodoridis and K.Koutroumbas “Pattern recognition” Elsevier, Academic Press, Canada 2009 3. C.M.Bishop “Pattern recognition and Machine learning” Springer Science+Bussiness Media Singapore
2006
4. R.O.Duda, P.E. Hart, D.G.Stork “Pattern Identification” Wiley-Interscience; 2 edition (October 2000) 5. V.Vovk, A.Gammerman and G.Shafer “Algorithmic learning in a random world” Springer, New York,
(2005)
6. J. Vega, A. Murari, A. Pereira, S. González, and I. Pastor, Review Scientific Instruments 81, 10E118 (2010)
7. T.J.Ross “Fuzzy Logic with Engineering Applications” John Wiley and Sons, Ltd, Singapore, 2004 8. Lambrou, H. Papadopoulos and A. Gammerman. Reliable Confidence Measures for Medical Diagnosis
with Evolutionary Algorithms. IEEE Transactions on Information Technology in Biomedicine 15(1): 93-99. IEEE, 2011.
9. Riid and E. Ruistern, "Transparent Fuzzy Systems in Modelling and Control" in J. Casillas, 0. Cordon, F. Herrera, L. Magdalena (editors) Interpretability Issues in Fuzzy Modeling, Springer, pp. 452-476, 2003. 10. Detlef Nauck and Rudolf Kruse. “How the learning of rule weights affects the interpretability of fuzzy
systems” In Proc. IEEE Int. Conf on Fuzzy Systems 1998, pages 1235-1240, Anchorage, May 1998 11. H. Papadopoulos, V. Vovk and A. Gammerman. Conformal Prediction with Neural Networks. In
Proceedings of the 19th IEEE International Conference on Tools with Artificial Intelligence (ICTAI'07), Volume II, pp. 388-395. IEEE Computer Society, 2007.