HAL Id: insu-01756486
https://hal-insu.archives-ouvertes.fr/insu-01756486
Submitted on 15 Jul 2019HAL is a multi-disciplinary open access archive for the deposit and dissemination of sci-entific research documents, whether they are pub-lished or not. The documents may come from teaching and research institutions in France or abroad, or from public or private research centers.
L’archive ouverte pluridisciplinaire HAL, est destinée au dépôt et à la diffusion de documents scientifiques de niveau recherche, publiés ou non, émanant des établissements d’enseignement et de recherche français ou étrangers, des laboratoires publics ou privés.
Agnès Borbon, Anne Boynard, Thérèse Salameh, Alexia Baudic, Valerie Gros,
Julie Gauduin, Olivier Perrussel, Cyril Pallares
To cite this version:
Agnès Borbon, Anne Boynard, Thérèse Salameh, Alexia Baudic, Valerie Gros, et al.. Is Traf-fic Still an Important Emitter of Monoaromatic Organic Compounds in European Urban Areas?. Environmental Science and Technology, American Chemical Society, 2018, 52 (2), pp.513 - 521. �10.1021/acs.est.7b01408�. �insu-01756486�
This document is confidential and is proprietary to the American Chemical Society and its authors. Do not copy or disclose without written permission. If you have received this item in error, notify the sender and delete all copies.
Is traffic still an important emitter of mono-aromatic organic compounds in European urban areas?
Journal: Environmental Science & Technology Manuscript ID es-2017-01408s.R2
Manuscript Type: Article Date Submitted by the Author: n/a
Complete List of Authors: BORBON, Agnès; CNRS, Laboratoire de Météorologie Physique LaMP/CNRS Boynard, Anne; LATMOS Site de Paris
Salameh, Therese; IMT Lille Douai Baudic, Alexia; AIRPARIF
Gros, Valerie; Institut Pierre Simon Laplace Gauduin, Julie; AIRPARIF
Perrussel, Olivier; AIRPARIF Pallares, Cyril; ATMOS ALSACE
Is traffic still an important emitter of mono-aromatic organic
1
compounds in European urban areas?
2
Agnès Borbon1*, Anne Boynard2, Thérèse Salameh3ǂ, Alexia Baudic4,5 Valérie Gros4, 3
Julie Gauduin5, Olivier Perrussel5, Cyril Pallares6 4
5
1. Université Clermont Auvergne, CNRS, LaMP, F-63000 Clermont-Ferrand, France 6
2. LATMOS/IPSL, UPMC Univ. Paris 06 Sorbonne Universités, UVSQ, CNRS, Paris, 7
France 8
3. Laboratoire Inter-Universitaire des Systèmes Atmosphériques (LISA), UMR CNRS 9
7583, Université Paris Est Créteil et Université Paris Diderot, Institut Pierre Simon 10
Laplace, Créteil, France 11
4. Laboratoire des Sciences du Climat et de l’Environnement (LSCE), UMR CNRS 12
8212, Commissariat à l’Energie Atomique et aux énergies alternatives, Université 13
Versailles Saint-Quentin, Institut Pierre-Simon Laplace, Gif sur Yvette, France. 14
5. AIRPARIF, Association Agréée de Surveillance de la Qualité de l’Air en Île-de-15
France, 75004 Paris, France 16
6. Agence de surveillance de la qualité de l’air (ASPA), F-67300, Schiltigheim, France 17
ǂ
now at : IMT Lille Douai, Univ. Lille, SAGE - Département Sciences de l'Atmosphère et 18
Génie de l'Environnement, 59000 Lille, France 19
* corresponding author a.borbon@opgc.univ-bpclermont.fr 20
Abstract 22
Trends of long-term observations and emission inventories suggest that traffic emissions will 23
no longer dominate the concentrations of mono-aromatic compounds (i.e. TEX - Toluene, 24
Xylenes and Ethylbenzene) in European urban areas. But the split limit between traffic and 25
other emission sector contributions such as solvent use remains tenuous. Here long-term 26
observations of an extensive set of hydrocarbons, including TEX, at traffic and urban 27
background sites in London, Paris and Strasbourg were combined to estimate the relative 28
importance of traffic emissions on TEX in every city. When analyzing the urban enhancement 29
emission ratios of TEX-to-benzene on a seasonal basis, two potential source signatures other 30
than traffic could be differentiated in all cities (1) summertime evaporation from fuel and/or 31
solvent and (2) wintertime domestic heating. However, traffic emissions still unambiguously 32
dominate the concentration levels of TEX in every city despite the reduction of their 33
emissions at exhaust pipe over the last two decades. Traffic explains between 60% and 96% 34
(at ±20%) of TEX levels while it is less clear for xylenes at some locations. Our results 35
provide a basis to evaluate regional emission inventories. The method is applicable at any 36
urban area where speciated hydrocarbon monitoring is available. 37
38
Toc Art 39
Key points: 40
• Emission inventories and multi-year trends of long-term observations raise the 41
question of the impact of traffic emissions on TEX concentration levels in European 42
urban areas 43
• One decade of hourly observations of hydrocarbons at traffic and urban stations in 44
Paris, London and Strasbourg is used to estimate the traffic fraction of TEX 45
concentrations 46
• The seasonal signature of TEX sources is rather due to seasonal changes in traffic 47
emission composition and additional wintertime domestic combustion for benzene 48
• It is demonstrated that traffic emissions still account for more than 60% of most TEX 49
concentrations regardless of the season while is less clear for xylenes at some urban 50
locations 51
Introduction 53
BTEX (Benzene, Toluene, Ethylbenzene and (m+p) and o-Xylenes), a sub-group of Volatile 54
Organic Compounds (VOC), still constitute a significant fraction of VOCs in urban 55
atmospheres up to 47% in volume of total Non-Methane Hydrocarbons (NMHC) after C2
-56
C9 alkanes1; 2; 3; 4, 5. BTEX are released into the atmosphere by either fossil fuel related
57
emission sources (transport, storage and distribution of fossil fuels, industrial and residential 58
combustion, processes) and solvent use6. For only benzene, which is known to be 59
carcinogenic7, the European air quality objective for health protection of 5 µg.m-3 (1.57 ppb 60
STP) per year is still exceeded in the center of Paris close to major roadways8. Apart from 61
their abundance and adverse health effects, BTEX have significant implications on 62
atmospheric chemistry. Together with alkenes, they show the highest ozone-forming 63
potential9,10. They have therefore been considered as key target compounds by ozone policy 64
reduction measures, especially in urban areas where ozone is usually VOC-limited11. BTEX 65
oxidation also contributes to the formation of Secondary Organic Aerosols (SOA). While high 66
uncertainties persist on SOA yields depending on smog-chamber experimental conditions, 67
BTEX show SOA yields as significant as the one of α-pinene, the most emitted and reactive 68
biogenic precursor being currently the dominant SOA source at the global scale: yield values 69
range from 1181 (benzene) to 1578 µg.m-3.ppm-1 (xylenes), respectively12,13 against 70
1826 µg.m-3.ppm-1 for α-pinene14. Recent results have suggested that BTEX could explain 71
34% of SOA production in summer15 in Paris megacity whereas such acontribution would be 72
lower when taking into account a larger set of VOC of intermediate volatility (IVOC) in Los 73
Angeles16. Like terpenes, oxidation of mono-aromatics would also lead to the rapid formation 74
of highly oxygenated molecules as recently suggested by Molteni and coworkers17. 75
VOC emission reduction measures, such as emission reduction at vehicle exhaust pipe, have 76
successfully reduced their anthropogenic concentrations in cities like London18, Paris and 77
other medium-sized cities in France6, Los Angeles19 and at rural stations 20,6. The multi-year 78
trends of monthly average concentrations of toluene (Figure 1) and other aromatics (Figures 79
S1, S2, S3 in Supplement Information) at both urban background and traffic sites in three 80
European metropolitan areas (London, Paris and Strasbourg) support these findings. 81
Regardless of the city, all concentrations have consistently shown a clear decline at traffic 82
sites since 2000, especially in the first half of the decade. However, aromatic levels at urban 83
background sites have stayed almost constant since 2008 and concentrations at traffic sites 84
tend towards the urban background levels. This raises the question whether traffic emissions 85
still dominate TEX emissions. Up-to-date emission inventories in all three cities (see pie-86
charts on the right hand panel of Figure 1 and Figures S1 to S3 in SI) show various features. It 87
should be noted that no local emission inventory is available for London megacity and the 88
emission distribution is adapted from the National Atmospheric Emission Inventory in UK 89
(NAEI) for the year 2000 (D. Derwent and S. Beevers’ personal communication). For toluene, 90
the road-transport sector accounts for half of its emissions in London and Paris and only 10% 91
in Strasbourg. For xylenes (Figures S1 and S2), the road-transport contribution drops down to 92
4%-33% except for o-xylene in London (57%). The solvent use and/or residential sector 93
appear as the other major source explaining between 28% and 56% of toluene emissions and 94
44 to 77% especially for xylenes. Only ethylbenzene would be still largely emitted by the 95
road-transport sector (44 – 68 %) (see Figure S3). Regional emission inventories for two 96
European cities, Paris and Zurich in 2005, also pointed to the use of solvents from all source 97
categories as the new dominant source of total VOCs at the urban scale. Finally, the 98
homogeneity of aromatic multi-year trends depicted in observations is not reflected in 99
regional emission inventories. However emission inventories for VOCs still show high 100
uncertainties up to a factor of 4 21 and observations provide useful constraints for their 101
evaluation22; 23 24; 21;25. Source-receptor models like PMF (Positive Matrix Factorization) 102
usually point to the contribution of various sources to total measured VOC ambient levels26; 27; 103
24
. BTEX usually show significant contributions in the source profiles of vehicle exhaust, 104
solvent use-related activities and wood combustion for benzene26, 27, 24, 28. Mathematics 105
supporting source-receptor models directly imply an estimation of source/factor contributions 106
to total measured VOC concentrations rather than individual species. Towards the complexity 107
of TEX emission sources, there is still no consensus on the importance of BTEX source and 108
for traffic in particular. Moreover, the seasonality of emission changes has been poorly 109
studied for BTEX. 110
In this study, we combine long-term and continuous in-situ measurements of NMHC, 111
including BTEX, carried out in European urban areas by air quality monitoring network 112
programs over the past decade to investigate the importance of traffic emissions on mono-113
aromatic levels at the urban scale. Due to its stringent regulation in fossil fuel and solvent 114
formulation compared to other mono-aromatic compounds, benzene will be treated here as a 115
combustion source tracer rather than a target species for the quantification of traffic 116
contribution. This study provides a scientific basis to evaluate the accuracy of regional 117
emission inventories. 118
Experimental 119
Data analysis mostly relies on continuous hourly observations of a large set of NMHC, 120
including BTEX, performed by European air quality networks in the megacities of London 121
(UK by DEFRA), Paris (France by AIRPARIF) and Strasbourg (Eastern France by ASPA). 122
The chosen period for data analysis covers the years 2008 to 2013. Special care was put on 123
data quality checks. The description of quality assurance tests is provided in Boynard et al. 124
(2014)2 and Waked et al. (2016) 6 for French data and Dollard et al. (2007)29 for UK data. The 125
purpose here is to evaluate the importance of traffic emissions relative to other anthropogenic 126
emissions. Data analysis has therefore combined observations collected at both traffic and 127
urban background sites in each city to provide perspectives from contrasted urban situations 128
non-influenced by industrial emissions. Traffic sites represent those locations under the direct 129
influence of nearby traffic emissions, usually a roadway tolerating traffic greater than 10,000 130
vehicles per day. Urban background sites are under the influence of multi-emitters, at a 131
distance of major traffic lanes of 40 m on average and are more likely representative of the 132
urban mixing of all anthropogenic emissions. Details on the database are reported in Table 1. 133
A description of the sites, meteorology and analytical devices is provided in the Supplement 134
Information (pages S5-S6). Note that the Paris data has been completed by tunnel 135
measurements performed during the PREQUALIF project 28. The number of missing data is 136
usually lower than 25% over the six-year period. 137
Results and discussion 138
Concentration levels of BTEX 139
Average concentration levels of mono-aromatics including benzene in the three metropolitan 140
areas are reported in Table S1 (2nd to 5th column) in the Supplement Information for the year 141
2011. BTEX concentration levels range between 0.03 ppb (ethylbenzene at Strasbourg Ouest 142
and 1,74 ppb (toluene at Paris-Auteuil), i.e. two orders of magnitude. Concentration levels are 143
2 to 4 times higher at the traffic sites compared to urban background sites. Concentrations of 144
benzene are quite similar between the three cities at ±0.040 ppb at traffic sites and ±0.070 ppb 145
at urban background sites. This is consistent with its stringent regulation policy at European 146
level to achieve the air quality standard of 5 µg.m-3 per year by, for instance, limiting its 147
presence at 1% vol. in fuels (Directives 98/70/EC replace by 2009/30/EC and 2003/17/EC). 148
On the opposite, the sum of BTEX load is higher in Paris by 1.4 at traffic sites to 2.4 at urban 149
background sites while concentration levels in London and Strasbourg are surprisingly quite 150
comparable. However, the atmospheric composition in BTEX is very similar between near-151
traffic and urban background atmospheres. Together with (m+p)-xylenes, toluene (which is 152
the dominant species among BTEX) explains 70% of BTEX load. This suggests that BTEX 153
concentrations are driven by emissions with a non-visible effect of photochemical processing 154
at the background sites. For the latter we would have expected an enrichment of air mass 155
composition in longer-lived mono-aromatics like benzene given that BTEX reactivity towards 156
OH radical spans one order of magnitude30. For benzene, a domestic heating source is highly 157
suspected, especially in Strasbourg (see following sections) and as recently shown by Baudic 158
and co-workers28. 159
Seasonal source signature on TEX 160
The magnitude of TEX concentrations is affected by the proximity of emission sources, the 161
extent of photochemical processes and boundary layer conditions. To minimize those effects, 162
we use the TEX-to-benzene enhancement emission ratio (ER = ∆[TEX]/∆[benzene]) at urban 163
background sites to identify the TEX source signature on a seasonal basis in order to index 164
seasonal changes in urban enhancement ratios to potential changes in the nature and intensity 165
of their sources. The TEX-to-benzene enhancement ratio equals the slope of a linear 2-sided 166
fit of a TEX-to-benzene correlation plot. An illustration of summertime (July) and wintertime 167
(January) scatterplots is provided in Figure 2a over the six-year period at the urban 168
background sites. Urban enhancement ER of toluene-to-benzene representative of traffic, 169
domestic wood combustion and gasoline evaporation emissions are also reported to provide a 170
comparison basis, which is rather qualitative than quantitative regarding the numerous factors 171
modifying the emission composition. These three emission categories have been usually 172
identified as TEX major sources in urban areas21; 24; 28. The determination of the reported 173
values of ER is described in the Supplement Information (pages S7-S8). Emissions from 174
solvent use cannot be excluded but representative ER relative to benzene can hardly be 175
determined. The main reason is due to the diversity of solvents. Speciated emission profiles 176
usually show great variability with, for instance, toluene-to-benzene ratios spanning two 177
orders of magnitude31. Moreover, benzene, due to its toxic and carcinogen nature, has been 178
strongly limited in solvent formulations. Current standards in Europe haveestablished limits 179
in benzene at 0.1% in cleaning products. 180
Remarkably, scatterplots show similar multiform patterns in all urban areas (Figure 2a). The 181
scatterplots lie within a domain delimited by the evaporative source ER in its upper part and 182
the domestic wood combustion ER in its lower part. Within these limits, the wintertime and 183
summertime scatterplots roughly split along the traffic ER line, suggesting the additional 184
influence of sources during both seasons despite expected seasonal changes in the 185
composition of traffic emission. In summer, the scatterplot equals (Strasbourg) or is above the
186
traffic ER line (Paris and London) and tends to the one of evaporative emissions. This would 187
suggest the presence of fugitive evaporative processes in addition to traffic. In winter, the 188
scatterplot lies between the traffic ER in its upper part and the domestic wood combustion ER 189
in its lower part. This would suggest an additional source of wood combustion for benzene27, 190
28
. Note that the observed multiform patterns are rather driven by the seasonal variability of 191
benzene mixing ratios than the ones of toluene especially in Strasbourg, a city submitted to 192
well-marked continental climatic conditions. For Strasbourg this is consistent with the 193
emission inventory (Figure 1). Note also that the multiform pattern is temperature-dependent 194
as seen in Paris and Strasbourg when color-coded with temperature (Figure S4 in Supplement 195
Information). Toluene mixing ratios stay rather constant between both seasons. One cannot 196
exclude that the correlation slope can be affected by photochemical processing for most 197
reactive VOCs21,22 especially in summer. When applying the nighttime and daytime filters 198
values following Borbon et al. (2013)30, no significant difference is depicted suggesting that 199
emissions mainly control TEX concentrations (not shown here). It is consistent with 200
observations during MEGAPOLI-2010 30.in Paris. The effect of photochemistry on TEX 201
concentrations was only visible in the Paris plume explored by the French ATR-42 aircraft 202
during the MEGAPOLI campaign in the summer 2009 at a distance above 50 km, at least, 203
from the urban center30.. 204
The correlation slopes have been determined on a monthly basis at traffic and urban 205
background sites. The toluene-to-benzene ERs are reported in Figure 2b for Paris and 206
Strasbourg. As expected, a clear seasonal variability is depicted on ER time series with a 207
higher variability at urban background sites. However, both cities show an opposite pattern. In 208
Paris, ERs are similar in winter and the urban background ER significantly increases in 209
summer compared to the traffic ER. In Strasbourg, the summertime ERs are similar while the 210
urban background ER decreases compared to the traffic ER in winter. Such temporal and 211
spatial variability also suggests the potential gaining importance of summertime sources other 212
than traffic as in Paris (evaporation) and the potential gaining importance of wintertime 213
sources other than traffic as in Strasbourg (residential wood combustion). 214
Finally, seasonal scatterplots of TEX mixing ratios versus benzene mixing ratios and time 215
series of TEX-to-benzene ER suggest a seasonal change in traffic emission composition and 216
the potential influence of sources other than traffic to BTEX concentrations. The importance 217
of these additional source contributions is going to be evaluated in the next section. 218
Contribution of traffic emissions to TEX concentrations 219
The method consists in estimating the fraction of each TEX originating from traffic emissions 220
at the urban background sites which are representative of the urban emission mixing. This 221
fraction is calculated by dividing the TEX concentration originating from traffic emissions to 222
the measured concentration. The TEX concentration originating from traffic emissions 223
([TEX]traffic) is expressed as follows:
224
[TEX]traffic = ([tracer]traffic – [tracer]bckgd )× ERtraffic (equation 1)
225
where [tracer]traffic is the concentration of a traffic tracer subtracted by its regional background
226
concentration ([tracer]bckgd) which could be significant for longer-lived compounds like
227
benzene28 and ERtraffic is the urban enhancement emission ratio from traffic between TEX and
228
the traffic tracer. This equation is derived from the one developed by Borbon et al. (2003)21. 229
Acetylene has been commonly used as a traffic exhaust tracer21, 32. However, a non-exhaust 230
combustion source cannot be excluded especially during the winter season regarding domestic 231
heating as for benzene 28. In past studies, acetylene and ethylene have already shown 232
significant contributions in the wood burning factor solution calculated by PMF 27, 28. To take 233
into account potential additional sources to traffic and seasonal changes in their relative 234
importance, five hydrocarbon tracers have been selected in order to derive an uncertainty of 235
the TEX traffic fraction. These tracers include: four combustion products/tracers (ethylene, 236
propene, acetylene and benzene) for which a wintertime domestic heating combustion source 237
cannot be excluded and an unburned-fuel VOC (isopentane) for which a gasoline evaporation 238
source has been demonstrated in summer21, 3. In addition, source attributions for the five 239
tracers by the AIRPARIF (Paris) and NAEI (UK) emission inventories are reported in the 240
Supplement information (figure S8). 241
ERtraffic is determined from the slope of a two-sided linear regression fit between TEX at
242
traffic rush hours and the tracer measured at the traffic sites. For Paris, the determination of 243
ERtraffic for TEX combines ERs relative to benzene at the traffic site (Auteuil) and ER of
244
benzene relative to other tracers from the Prequalif tunnel experiment (see 6th column of 245
Table S1). While the ERtraffic from the PREQUALIF experiment was only determined during
246
the fall period (September-October 2012), it is representative of the average of expected 247
monthly ERs, the maxima and minima usually being observed in summer and winter (see 248
discussion below). While the contribution at the traffic site of additional sources can be 249
neglected, some seasonal changes in vehicle fuel composition can be expected as a result of 250
seasonal changes in fuel composition regulation and temperature-dependent evaporative 251
emissions. ERtraffic was therefore determined on a monthly basis. ERtraffic relative to the five
252
tracers values are reported in Table S1 at the three traffic sites. The monthly variability of 253
ERtraffic is significant showing minimum and maximum values in winter and summer,
254
respectively. Minimum values from near-traffic measurements found in the literature are also 255
reported for comparison. All TEX are highly correlated with the five tracers at the traffic sites 256
with an R2 higher than 0.80 and a narrow distribution along the regression slope as an 257
evidence of the traffic origin for TEX (see the example in figure S7 for toluene versus 258
benzene at traffic sites). Values of TEX-to-benzene ER are in the same range among the three 259
cities. It should be noted that ER in Paris and London are in the upper range compared to 260
Strasbourg (only toluene-to-benzene ER reported) and other ER derived from tunnel 261
measurements in Europe. This enrichment has been first pointed out by Borbon et al. (2013) 262
and would be due to two-wheeler powered vehicles (Salameh et al., to be submitted in 2017). 263
Note that the ER relative to benzene is quite similar and the greatest variability is usually 264
observed for toluene and (m+p)-xylenes. Values of ER of TEX relative to other tracers are 265
also consistent between Paris and London. 266
[tracer]bckgd is determined on an hourly basis and is derived from a linear interpolation of
267
minimum concentrations observed over a 4-day period between 2008 and 2013. The method 268
was validated by comparing the time series of interpolated background concentrations to the 269
ones observed at European rural sites in the frame of the EMEP monitoring network and 270
extracted from the EBAS database (http://ebas.nilu.no). VOC data collected twice a week is 271
available from 2008 to 2013 during a 4-hour sampling by canisters. For France, two rural sites 272
have been selected: La Tardière (LT, Western France) and Peyrusse-Vieille (PV, Southern 273
France)20. As an example, a comparison is provided on Figures S5 and S6 in the Supplement 274
Information for the five tracers for Paris and Strasbourg. Except forsome periods when local 275
influences at the rural areas cannot be excluded, especially under a continental influence and 276
analytical uncertainties, the time series of interpolated urban background minimum 277
concentrations are consistent with the ones at rural background sites. Median ratios between 278
calculated backgrounds and the ones at Peyrusse-Vieille and La Tardière equal 1.25 and 0.76, 279
respectively. 280
In Figure 3, we have compared the average mixing ratios derived from the traffic 281
(ERtrafic×[tracer]) and background ([TEX]bkgd) terms to the observed mixing ratios in the case
282
of toluene at the three urban background sites. TEX background concentration was determined 283
following the 4-day minima interpolation method described previously for the five tracers. The 284
summertime average contributions of traffic, background and non-traffic terms are illustrated 285
by pie charts and the values of annual traffic contributions to measured concentrations are 286
reported below. 287
Regardless of the location, toluene concentrations show the typical seasonal variability of 288
anthropogenic VOC with maximum concentrations in winter and minimum concentrations in 289
summer. On an annual basis and regardless of the location, traffic emissions unambiguously 290
dominate toluene mixing ratios by explaining more than 70% of the observed concentrations. 291
Given the use of five tracers, the standard deviation of traffic fraction was estimated to be 292
within a ± 13-24 % range. The background contribution is significant with an annual average 293
of 7% in Strasbourg, 16% in London and 20% in Paris. Contrary to other mono-aromatics, a 294
high background level was found for toluene in Paris exceeding by almost 0.40 ppb the rural 295
ones. We suspect the background concentration being overestimated by our method. We 296
cannot exclude that the estimated background include a non-traffic source term. However, 297
when substracting the background term, traffic emissions explains more than 90% of toluene 298
concentrations. In summer, the traffic contribution remains higher than 58% (Paris, 2013) and 299
higher than 78% without accounting for the background term. This is not significantly different 300
from the annual contribution. The expected additional contribution of summertime evaporative 301
sources (like gasoline evaporation from Figure 2) is not depicted. Firstly, our apportionment 302
method (see equation 1) takes into account the seasonal variability of traffic emission 303
composition by the determination and the use of monthly ER values (Table S1). Secondly, this 304
suggests that the shape of the scatterplots reported in Figure 2a is drivenrather by the seasonal 305
change of traffic emission composition and additional non-traffic sources in winter like 306
domestic combustion for the tracers. It should be noted that the sum of the traffic and 307
background terms in winter is usually higher than observed concentrations, indicating that 308
combustion sources other than traffic contribute to the tracer mixing ratios. The strongest 309
evidence is seen at the continental background site of Strasbourg. When only considering 310
isopentane as a traffic tracer in winter in Strasbourg, the traffic contribution falls by 20% 311
compared to the one by combustion tracers but remains above a 50%-contribution (not shown 312
here). However, our results suggest that the traffic source contribution has decreased by 31% 313
in Paris over the last six years. This trend is not depicted in Strasbourg and London. Further 314
analysis for the years following 2013 should be performed to confirm this trend. On an annual 315
basis, these results are consistent with emission inventories in the megacities of Paris and 316
London (Figure 1) even if the observed traffic contribution is higher. For Strasbourg, the 317
emission inventory only allocates 10% of toluene emissions to traffic (Figure 1) which would 318
be largely underestimated as suggested by our results. 319
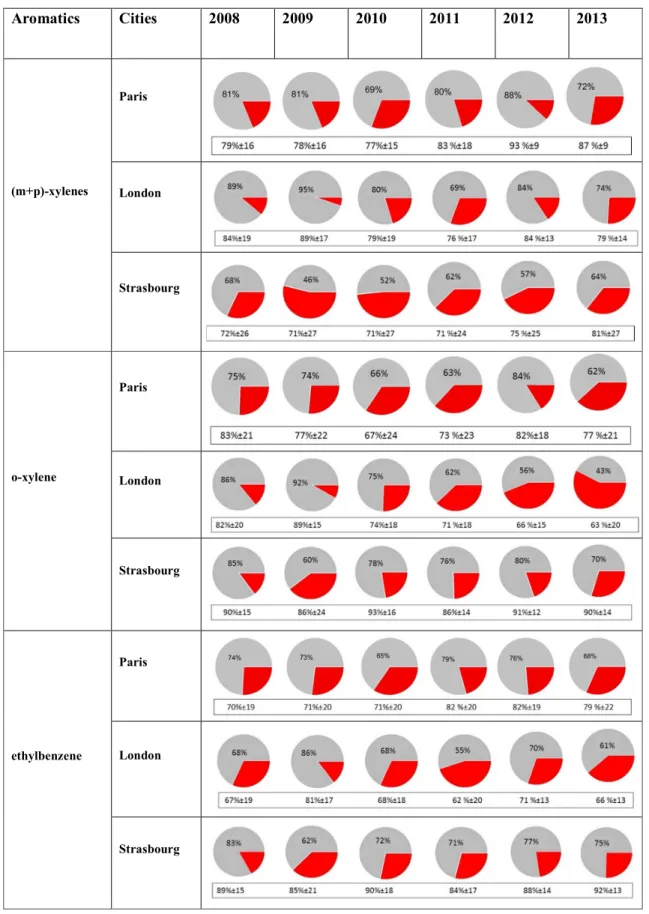
Annual values and summertime pie charts of the traffic contribution are compiled for all other 320
mono-aromatic compounds in Table 2. The values of summertime traffic contribution are 321
usually within the standard deviation of the annual ones. While the split limit between traffic 322
and non-traffic contribution is more tenuous for >C7-aromatics (e.g. (m+p)-xylenes in
323
Strasbourg), traffic emissions would still dominate the concentrations of >C7-aromatics. The
324
summertime (and annual) contribution of traffic is usually higher than 60% and up to 96% over 325
the last six years in the three cities. One exception is the 2013-contribution with a 43%-value 326
to o-xylene concentrations in London and a 46%-contribution for (m+p)-xylenes in Strasbourg 327
in 2009. In London, the summertime traffic contribution to o-xylene concentrations has 328
decreased from 86% to 43%. The decreasing trend for (m+p)-xylenes in London is surprisingly 329
not as clear as for o-xylene. This finding is consistent with the observed change at Eltham in 330
the o-xylene-to-(m+p)-xylenes when looking at the shape of the scatterplot (not shown here) 331
Further analysis should be performed after 2013 to confirm. These results are qualitatively 332
consistent with emission inventories for ethylbenzene but usually disagree for xylenes in the 333
French cities of Paris and Strasbourg, for which the solvent use dominates by far their 334
emissions (Figure 1). 335
In Paris, the traffic contribution for the year 2010 is compared to the one extracted from a PMF 336
source-receptor study by Baudic et al.28 for the same reference year. Baudic and co-workers28 337
performed a PMF analysis on a one-year hourly VOC dataset, including the NMHC data used 338
here. They found an optimized solution of 6 factors, including a Motor Vehicle Exhaust, an 339
Evaporative Sources and a Solvent Use factor. The Evaporative Source factor is related to 340
gasoline evaporation as well as other fossil fuel storage and distribution activities. The 341
contribution of BTEX to this factor being less than 1% , the following discussion will only 342
focus on the two other factors. From the fraction of each TEX in the factor profiles and the 343
modelled concentration of each factor, the modelled contribution of the Motor Vehicle Exhaust 344
(MVE) Factor was calculated to TEX concentrations predicted by the PMF model. This 345
comparison should be interpreted with caution since (i) the MVE contribution is calculated on 346
TEX predicted concentrations (ii) PMF source profiles are assumed to be constant during the 347
whole year in the PMF calculation (iii) assumptions regarding factor identification. For the 348
latter, factor identification is consolidated by comparing to near-source measurement profiles 349
and independent source tracer such as BCff (Black Carbon from fossil fuel combustion) for the
350
MVE factor. Regarding item (i), note that observed concentrations are 30% higher than the 351
ones predicted by the PMF 6-factor solutions for toluene and higher than 20% for C8
-352
aromatics. Regarding item (ii) ER calculations have shown a clear seasonal variability 353
implying that traffic emission profiles change during the year. PMF allocates 39%±13% of 354
Motor Vehicle Exhaust and 38%±17% to Solvent Use to toluene concentrations while our 355
study allocates 79%±19% to traffic emissions on an annual basis. For C8-aromatics, PMF
356
allocates 39%±16% to Solvent Use and 36%±13% to MVE against 72%±24% to traffic 357
emissions in our study. While traffic emissions include bothexhaust and gasoline evaporative 358
losses in our study, the approach developed here shows a higher contribution of traffic source 359
to aromatic emissions for all ≥C7 aromatics than the one suggested by the PMF. Given the
360
limitations of such a comparison (see above), it is expected that the factor-of-two difference of 361
traffic is the upper limit and should be lower and within the uncertainties of both approaches. 362
Except the study by Baudic (2016), there is almost no recent study reporting on VOC source 363
apportionment in European urban areas for a direct comparison. As VOC emission regulation 364
is decided at European level, we expect our results to be extrapolated to other tertiary 365
metropolitan areas in Europe which have the same anthropogenic activity pattern. However, at 366
lower latitude cities like the ones on the Mediterranean border, higher ambient temperature 367
should favor the contribution of evaporative losses. 368
Acknowledgements 369
Nadine Locoge, Stéphane Sauvage and Antoine Waked from IMT Lille Douai (France) were 370
very helpful for consolidating VOC observations from AASQA and EMEP stations. 371
Stéphane Bonneau and Alexandre Probellet at AIRPARIF and ASPA, respectively, were 372
efficient in providing the NMHC and BTEX original data from the AASQA. The authors 373
would like to thank Roy Harrison, Dick Derwent and Sean Beevers (Kings College) for the 374
information they provided on the status of VOC emission inventories for the UK and London. 375
Thérèse Salameh benefitted from an Ile de France – R2DS postdoctoral grant (2015-2016) 376
and Anne Boynard benefitted from a financial support from CNES. The authors would like to 377
thank Cathy Clerbaux for allowing the preparation of the present work. 378
Supplement Information Available. Time series of TEX concentrations in the three cities. 379
Source contributions to TEX emissions from emission inventories. Description of the sites 380
and analytical devices for VOC measurements. Determination of the toluene-to-benzene ER 381
representative of traffic, wood combustion and gasoline evaporation emissions. Time series of 382
hydrocarbon tracer concentrations at urban and rural sites for background determination. 383
BTEX average concentrations at traffic and urban background sites and ERtraffic used in source
384
apportionment calculation. Correlation plots for the determination of ERtraffic. Source
385
contributions to tracer emissions. 386
References 388
[1] Gros, V., Gaimoz, C., Herrmann, F., Custer, T., Williams, J., Bonsang, B., Sauvage, S., 389
Locoge, N., D'Argouges, O., Sarda-Estève, R., Sciare, J., Volatile organic compounds sources 390
in Paris in spring 2007. Part I: qualitative analysis, Environ. Chem., 2011, Vol. 8, N°1, pp 74-391
90 392
[2] Boynard, A., Borbon, A., Leonardis, T., Barletta, B., Meinardi, S., Blake, D.R., Locoge, 393
N., Spatial and seasonal variability of measured anthropogenic non-methane hydrocarbons in 394
urban atmospheres : Implication on emission ratios. Atmos. Environ., 82, 2014 pp.258-267. 395
<10.1016/j.atmosenv.2013.09.039>, 396
397
[3] Salameh, T., Sauvage, S., Afif, C., Borbon A., Leonardis, T., Brioude, J., Waked, A., 398
Locoge, N., Exploring the seasonal NMHC distribution in an urban area of the Middle East 399
during ECOCEM campaigns: very high loadings dominated by local emissions and dynamics, 400
Environ. Chem., 2015, 12(3), 316-328, http://dx.doi.org/10.1071/EN14154. 401
402
[4] Dominutti P.A., Nogueira, T., Borbon, A., de Fatima Andrade, M., Fornaro, A., One-year 403
of NMHCs hourly observations in São Paulo megacity: meteorological and traffic emissions 404
effects in a large ethanol burning context, Atmos. Environ., 2016, 142, 371-382, 405
http://dx.doi.org/10.1016/j.atmosenv.2016.08.008. 406
407
[5] Wang, G., Cheng, S., Wei, W., Zhou, Y., Yao, S., Zhang, H., Characteristics and source 408
apportionment of VOCs in the suburban area of Beijing, China, Air. Poll. Res. 2016, 7(4), 409
711-724, http://dx.doi.org/10.1016/j.apr.2016.03.006. 410
411
[6] Waked, A., Sauvage, S., Borbon, A., Gauduin, J., Pallares, C., Vagnot, MP., Léonardis, 412
T., Locoge, N., Multi-year levels and trends of non-methane hydrocarbon concentrations 413
observed in ambient air in France, Atmos. Environ., 2016, 263-275, 141, 414
https://doi.org/10.1016/j.atmosenv.2016.06.059. 415
416
[7] Cocheo, V., Sacco, P., Boaretto, C., De Saeger, E., Perez Ballesta, P., Skov, H., Goelen, 417
E., Gonzalez, N., Baeza Caracena, A., Urban benzene and population exposure, Nature Brief 418
Communication, 2000, vol. 404, 419
420
[8] AIRPARIF, Air quality annual report Surveillance et information sur la qualité de l’air en 421
Ile de France en 2015, April 2016, 93 pages, 422
http://www.airparif.asso.fr/_pdf/publications/bilan-2015.pdf 423
424
[9] Carter W.P.L., Development of ozone reactivity scales for volatile organic compounds. 425
Journal of Air and Waste Management Association, 1994, 44, pp. 881-899. 426
427
[10] Carter W.P.L., Updated Maximum Incremental Reactivity scale for regulatory 428
applications, Air Pollution Ressource Center and College of Engineering, Center for 429
Environmental Research and Technology, University of California, Preliminary Report, 1998, 430
Contract n° 95-308, Riverside, USA, 73 p. 431
[11] Deguillaume, L., Beekmann, M., Derognat, C., Uncertainty evaluation of ozone 433
production and its sensitivity to emission changes over the Ile-de-France region during 434
summer periods, J. Geophys. Res. Atmos., 2008, 113, 1–13, doi: 10.1029/2007JD009081. 435
436
[12] Odum, J. R., Jungkamp, T. P. W., Griffin, R. J., Flagan, R. C. and Seinfeld, J. H.: The 437
Atmospheric Aerosol-Forming Potential of Whole Gasoline Vapor, Science, 1997, 276(5309), 438
96–99, doi:10.1126/science.276.5309.96. 439
440
[13] Ng, N. L., Kroll, J. H., Chan, A. W. H., Chabra, P. S., Flagan, R. C. and Seinfeld, J. H.: 441
Secondary organic aerosol formation from m-xylene, toluene, and benzene, Atmos. Chem. 442
Phys., 2007, 7(14), 3909–3922, doi:10.5194/acp-7-3909-2007. 443
444
[14] Lee, A., Goldstein, A. H., Kroll, J. H., Ng, N. L., Varutbangkul, V., Flagan, R. C. and 445
Seinfeld, J. H.: Gas-phase products and secondary aerosol yields from the photooxidation of 446
16 different terpenes, J. Geophys. Res., 2006, 111(D17), D17305, 447
doi:10.1029/2006JD007050. 448
[15] Ait-Helal, W., Borbon, A., Sauvage, S., de Gouw, J. A., Colomb, A., Gros, V., Freutel, 449
F., Crippa, M., Afif, C., Baltensperger, U., Beekmann, M., Doussin, J.-F., Durand-Jolibois, 450
R., I. Fronval, , N. Grand, N, Leonardis, T., Lopez, M., Michoud, V., Miet, K., Perrier, S., 451
Prévôt, A. S. H., Schneider, J., Siour, G., Zapf, P., and Locoge, N., Volatile and intermediate 452
volatility organic compounds in suburban Paris: variability, origin and importance for SOA 453
formation, Atmos. Chem. Phys., 2014, 14, 10439–10464, doi:10.5194/acp-14-10439-2014 454
455
[16] Zhao, Y., Hennigan, C. J., May, A. A., Tkacik, D. S, de Gouw, J. A., Gilman, J. B., 456
,Kuster, W., Borbon, A., and Robinson, A.L., Intermediate-volatility organic compounds: a 457
large source of secondary organic aerosol, Env. Sc. Tech., 2014, 48(23) Pages: 13743-13750, 458
DOI: 10.1021/es5035188. 459
460
[17] Molteni, U., Bianchi, F., Klein, F., El Haddad, I., Frege, C., Rossi, MJ., Dommen, J., 461
Baltensperger, U., Formation of highly oxygenated organic molecules from aromatic 462
compounds. Atmos. Chem. Phys. Discuss., 2016, doi: 10.5194/acp-2016-1126, under review. 463
[18] von Schneidemesser, E., Monks, P. S. and Plass-Duelmer, C., Global comparison of 464
VOC and CO observations in urban areas, Atmos. Environ., 2010, 44(39), 5053–5064, 465
doi:10.1016/j.atmosenv.2010.09.010. 466
467
[19] Warneke, C., de Gouw, J.A., Holloway, J.S., Peischl, J., Ryerson, T.B., Atlas, E., Blake, 468
D., Trainer, M., Parrish, D.D., Multiyear trends in volatile organic compounds in Los 469
Angeles, California: Five decades of decreasing emissions, J. Geophys. Res. Atmospheres, 470
2012, 117, D00V17, doi:10.1029/2012JD017899 471
472
[20] Sauvage, S., Plaisance, H., Locoge, N., Wroblewski, A., Coddeville, P., Galloo, J.C., 473
Long term measurement and source apportionment of non-methane hydrocarbons in three 474
French rural areas, Atmos. Environ., 2009, 43, 2430–2441. 475
[21] Borbon A., H. Fontaine, N. Locoge, M. Veillerot, J.C. Galloo, Developing receptor-477
oriented methods for non-methane hydrocarbon characterisation in urban air. Part II: source 478
apportionment, Atmos. Environ., 2003, 37 4065–4076. 479
480
[22] Warneke, C S., McKeen, A., de Gouw, J.A., Goldan, P.D., Kuster, W. C., Holloway, 481
J.S., Williams, E.J., Lerner, B. M, Parrish, D. D., Trainer, M., Fehsenfeld, F.C., Kato, S., 482
Atlas, E. L., Baker, A., and Blake, D. R., Determination of urban volatile organic compound 483
emission ratios and comparison with an emissions database. J. Geophys. Res., 2007, 112, 484
D10S47. http://dx.doi.org/10.1029/2006JD007930. 485
486
[23] Coll, I., Rousseau, C., Barletta, B., Meinardi, S., and Blake, D.R., Evaluation of an urban 487
NMHC emission inventory by measurements and impact on CTM results, Atmos. Env., 2010, 488
44(31), 3843-3855. 489
490
[24] Gaimoz, C., Sauvage, S., Gros, V., Herrmann, F., Williams, J., Locoge, N., Perrussel, O., 491
Bonsang, B., d'Argouges, O., Sarda-Estève, R., Sciare, J., 2011. Volatile Organic Compounds 492
Sources in Paris in Spring 2007. Part II: Source Apportionment Using Positive Matrix 493
Factorisation. Environ. Chem., 2011, 8, no. 1, 91–103. 494
[25] Salameh, T., Borbon, A., Afif, C., Sauvage, S., Leonardis, T., Gaimoz, C., and Locoge, 495
N.: Composition of gaseous organic carbon during ECOCEM in Beirut, Lebanon: new 496
observational constraints for VOC anthropogenic emission evaluation in the Middle East, 497
Atmos. Chem. Phys., 2017, 17, 193-209, doi:10.5194/acp-17-193-2017, 2017. 498
499
[26] Niedojadlo, A., Becker, K. H., Kurtenbach, R., Wiesen, P., The contribution of traffic 500
and solvent use to the total NMVOC emission in a German city derived from measurements 501
and CMB modelling, Atmos. Environ., 2007, 41, 7108. doi:10.1016/J.ATMOSENV. 502
503
[27] Lanz, V. A., Hueglin, C., Buchmann, B., Hill, M., Locher, R., Staehelin, J. and Reimann, 504
S.: Receptor modeling of C2–C7 hydrocarbon sources at an urban background site in Zurich, 505
Switzerland: changes between 1993–1994 and 2005–2006, Atmos. Chem. Phys., 2008, 8(9), 506
2313–2332, doi:10.5194/acp-8-2313-2008. 507
[28] Baudic, A., Gros, V., Sauvage, S., Locoge, N., Sanchez, O., Sarda-Estève, R., Kalogridis, 508
C., Petit, J.-E., Bonnaire, N., Baisnée, D., Favez, O., Albinet, A., Sciare, J., and Bonsang, B.: 509
Seasonal variability and source apportionment of volatile organic compounds (VOCs) in the 510
Paris megacity (France), Atmos. Chem. Phys., 2016, 16, 11961-11989, doi:10.5194/acp-16-511
11961-2016 512
513
[29] Dollard, G. J., Dumitrean, P., Telling, S., Dixon, J. and Derwent, R. G., Observed trends 514
in ambient concentrations of C2–C8 hydrocarbons in the United Kingdom over the period 515
from 1993 to 2004, Atmos. Environ., 2007, 41, 2559–2569. 516
[30] Borbon, A., Gilman, J.B., Kuster, W. C., Grand, N., Chevaillier, S., Colomb, A., 517
Dolgorouky,C., Gros, V., Lopez, M., Sarda-Esteve, R., Holloway, J., Stutz, J., Perrussel, O., 518
Petetin, H., McKeen, S., Beekmann, M., Warneke, C., Parrish, D.D., and de Gouw, J., 519
Emission ratios of anthropogenic VOC in northern mid-latitude megacities: observations vs. 520
emission inventories in Los Angeles and Paris. J. Geophys. Res., 2013, vol. 118, 2041–2057, 521
doi:10.1002/jgrd.50059 522
523
[31] Yuan, B., Shao, M., Lu, S., Wang, B., Source profiles of volatile organic compounds 524
associated with solvent use in Beijing, China, Atmos. Environ., 2010, 44, 1919-1926. 525
526
[32] Salameh, T., Afif, C., Sauvage, S., Borbon, A., and Locoge, N.: Speciation of Non-527
Methane Hydrocarbons (NMHC) from anthropogenic sources in Beirut, Lebanon, Environ. 528
Sci. Pollut. Res., 2014, 21, 10867–10877, doi:10.1007/s11356-014-2978-5. 529
530 531
Figures and Tables
532 533 534 535 536Figure 1 : Time series of toluene monthly mean concentrations in Paris, Strasbourg and 537
London at traffic and urban background sites since 2000 (left panel). The grey shaded area 538
corresponds to the standard deviation of the monthly mean concentrations at the background 539
sites. Associated apportioned emissions of toluene extracted from local emission inventories 540
are reported on right panel (grey: road transport ; red: solvent use or residential for 541
Strasbourg; dark blue: extraction and distribution of fossil fuel; yellow: non-industrial 542
combustion and industrial activities for Strasbourg; light blue: other activities. 543
544 545
546
b) 547
Figure 2: (a) Scatterplots of toluene versus benzene concentrations in January (blue) and July 548
(red) months at London, Paris and Strasbourg urban background sites (2008-2013). Dotted 549
lines are average toluene-to-benzene ERs representative of traffic (Aït-Helal et al., 2015), 550
domestic wood combustion (Gaeggeller et al. 2008; Evtyugina et al., 2014; Baudic et al., 551
2016) and gasoline evaporation emissions (Salameh et al., 2017). (b) Time series of monthly 552
toluene-to-benzene urban enchancement ratios (ER) derived from the slopes of correlation 553
plots for Paris and Strasbourg at traffic and urban background sites 554
555
556 a)
557 558 559 560 561 562 563 564 565 566 567 568 569 570 571 572 573 574 575 576 577 578 579 580 581 582 583 584 585 586 587 588 589 590 591 592 593 594 595 596 597 598 599 600 601
Figure 3 : Time series of toluene concentration terms in Paris, Strasbourg and London 602
between 2008 and 2013. Data are smoothed a 30-day basis. Below time series, pie charts 603
represent the average summertime (JJA) percent contribution of the traffic term (in grey), 604
background term (in blue) and non-traffic term (in red) to toluene concentrations. Framed 605
numbers are the annual average contribution of traffic and its standard deviation. 606
Table 2: 608 Aromatics Cities 2008 2009 2010 2011 2012 2013 (m+p)-xylenes Paris London Strasbourg o-xylene Paris London Strasbourg ethylbenzene Paris London Strasbourg
Table 2: Mean contribution in % of traffic emissions (in grey) to (m+p)-xylenes, o-xylene and 609
ethylbenzene concentrations in summer (JJA) in Paris, London and Strasbourg between 2008 610
and 2013. Non-traffic contribution (in red) includes the background. Framed numbers 611
represent the annual mean contribution of traffic emissions 612
613 614
Table 1: VOC data used for this study 615 616 617 618 619 620
Location Site Type Coord. Network Period % missing data Reference
London Marylebone Road Traffic 51.52 N, -0.1546 W Hydrocarbon Automatic Network 2008 - 2013 23% Dollard et al., 2007 Eltham Urban 51.45 N, 0.071 E Hydrocarbon Automatic Network 2008 - 2013 19% Dollard et al., 2007
Paris Auteuil Traffic 48.85N 2.25E AIRPARIF 2008 - 2011 24%
Les Halles - Crillon Urban 48.86N 2.34 E AIRPARIF 2008 - 2013 6% Waked et al., 2016 Guy Moquet tunnel Tunnel 48.01N 2.65E PREQUALIF experiment Sept-Oct. 2012 2% Baudic et al., 2016
Strasbourg Clémenceau Traffic 48.35N 7.44E ASPA 2008 - 2013 3%