HAL Id: hal-02371133
https://hal.archives-ouvertes.fr/hal-02371133
Submitted on 19 Nov 2019
HAL is a multi-disciplinary open access
archive for the deposit and dissemination of
sci-entific research documents, whether they are
pub-lished or not. The documents may come from
teaching and research institutions in France or
abroad, or from public or private research centers.
L’archive ouverte pluridisciplinaire HAL, est
destinée au dépôt et à la diffusion de documents
scientifiques de niveau recherche, publiés ou non,
émanant des établissements d’enseignement et de
recherche français ou étrangers, des laboratoires
publics ou privés.
An Open-Source Hardware-In-The-Loop Virtualization
System for Cybersecurity Studies of SCADA Systems
Stéphane Mocanu, Maxime Puys, Pierre-Henri Thevenon
To cite this version:
Stéphane Mocanu, Maxime Puys, Pierre-Henri Thevenon. An Open-Source Hardware-In-The-Loop
Virtualization System for Cybersecurity Studies of SCADA Systems. C&esar 2019 - Virtualization
and Cybersecurity, Nov 2019, Rennes, France. pp.1-16. �hal-02371133�
An Open-Source Hardware-In-The-Loop Virtualization
System for Cybersecurity Studies of SCADA Systems
?St´ephane Mocanu1, Maxime Puys2, and Pierre-Henri Th´evenon2
1
Univ. Grenoble Alpes, CNRS, Inria, Grenoble INP, LIG, 38000 Grenoble, France [email protected]
2
Universit´e Grenoble Alpes, CEA, LETI, DSYS, Grenoble F-38000, France [email protected]
Abstract. Industrial control systems are targeted by cyberattacks since Stuxnet in 2010 and attacks have increased in the past years wtr. interconnection with IT systems. Due to their contact with the real world, industrial systems must be pro-tected and engineers must be trained accordingly. In this paper, we present a scal-able physical process virtualization platform for cybersecurity study of SCADA systems. Our virtualization platform includes electronic interfaces and a software physical processes simulator, directly connected with the input/output cards of industrial control system hardware. Our system is entirely open source including electronic card schematics, printed circuit boards, embedded software and physi-cal process simulation software and provides a reasonable real-time performance. Keywords: Hardware in the loop simulation, Cybersecurity, SCADA.
1
Introduction
Industrial control systems (ICS), also called SCADA are used to monitor and control physical industrial processes. They are composed by hardware and software elements interconnected by communication networks and interacting with the physical world via sensors and actuators. ICS cybersecurity became one of the fastest growing cybersecu-rity fields after the Stuxnet attack in 2010. Consequences of cyberattacks on SCADA systems are very costly in terms of money but also in terms of environment and citizen integrity. That forced government agencies, hardware manufacturers, and researchers to develop cybersecurity measures once the vulnerability of ICS exposed by mediatic events. There are two main challenges when dealing with ICS cybersecurity:
1. Industrial systems are a proprietary world. Thus, working on a programmable logic controller (PLC) and protocols requires to obtain the actual controller as the hard-ware. Operating system and hardware are yet to be replicated in a softhard-ware. 2. Impact on physical process. A threat may use legitimate communications to send
malevolent commands to the physical process. In other words, there is no violation of the security policy, however the safety properties of the process are violated.
?
This work has been partially funded by the French national program ”Programme d’Investissement d’Avenir IRT Nanoelec” 10-AIRT-05), the SACADE project (ANR-16-ASTR-0023) and by the LabEx PERSYVAL-Lab (ANR–11-LABX-0025).
To handle these two aspects of industrial systems cybersecurity, studies have to be vali-dated on real control hardwares used in conjunction with a physical process. Obviously pentesting or firewall calibration cannot be validated on a real plant as they may endan-ger the plant safety. Therefore, one of the intense activity fields in SCADA cybersecurity is the realization of realistic scale testbeds. In this paper, we propose a testbed providing a low-cost open-source physical system simulation solution, with reasonable real-time performance for teaching and research.
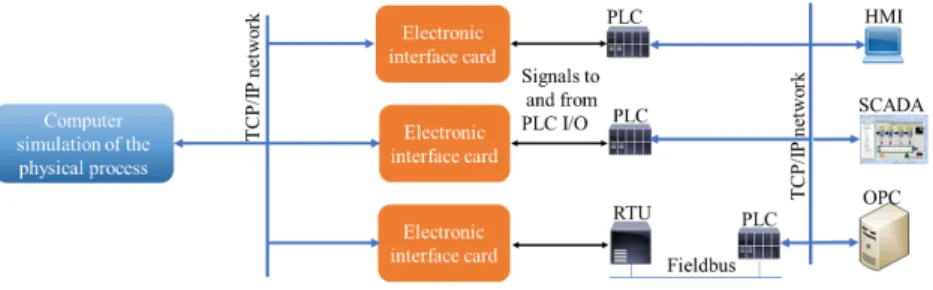
Our approach: Our main goal is to provide a testbed that allows the use of real con-trol devices in a realistic environment. Our hardware and software are therefore similar to the material used in Factory Acceptance Test. We provide electronic cards able to connect the software process simulator to PLCs. We also intend to reproduce SCADA systems of a size close to real industrial cases. Our symbolic target is one hundred in-dustrial equipments and one thousand sensors and actuators. Thus, the interfacing board needs to scale up to targeted number of inputs and outputs. Therefore a network com-munication with the process simulation allows to easily add more boards. The global architecture is represented in Figure 1.
Fig. 1. Global simulation architecture
Outline: In section 2, we describe the interface board. In section 3, we detail how in-dustrial processes are simulated. In section 4, we present our virtualized testbed named G-ICS and some experimental results and we conclude in section 6.
2
Interface Board
As explained in section 1, the interface board allows communication between the phys-ical process simulator and industrial hardware components. To do so, it requires:
Versatility: We target mainly manufacturing and smart-grids applications fields. Hard-ware control devices such as Programmable Logic Controllers (PLC), Remote Termi-nal Units (RTU), Human Machine Interfaces (HMI) and embedded regulators interact with the physical process via a variety of I/O modules and interfaces. The logical na-ture of the signal is mainly digital or sampled analog The electrical nana-ture of the input and output signals might vary a lot. We limit our study to the most common electrical
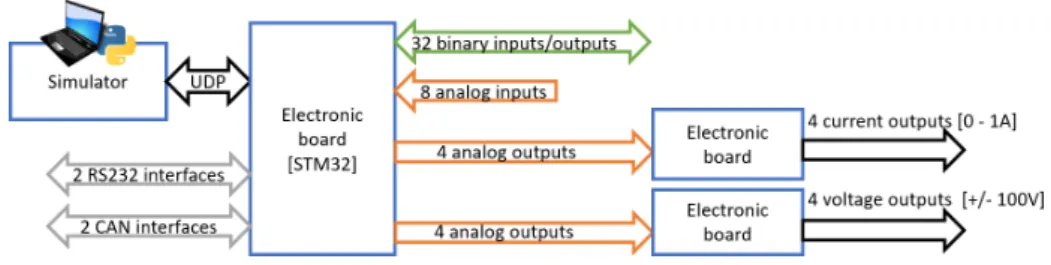
signals, i.e. 0/24 V digital signals and -10/+10 V analogs. The current version of the interface board does not support specialized signals (pulse train or Pulse Width Modu-lation) or 4/20 mA current loops. Smart-grid hardware controllers are mostly Intelligent Electronic Devices (IED) preprogrammed with electrical protection functions. All these devices are using digital signals and specialized analog inputs for current and voltage measurement in power networks. Two normalized current levels are used: 0/1A and 0/5 A. Voltage sensors are issuing signals in the range 0/100 V AC. Usually a protec-tion relay will measure at least a group of three current inputs (triphasic point) plus a fault current to the ground. Some relays will also measure voltage or two triphasic points (transformer protections for example). Figure 2 displays a synoptic of the board, compatible with these requirements.
Fig. 2. Interface board synoptic
Scalability: We don’t want to limit the number of interface cards connected to a soft-ware simulation. Therefore, the cards are connected to the process simulation through an Ethernet network.
Real-time performance: Controllers in manufacturing application are usually running with cycle times in the range of 10 to 250 ms. The notable exceptions are regulators whose sampling period may be around 1 ms even for simple applications. Smart-grid protection relays on the other hand are more demanding. Power measures in Europe are sampled at 4 KHz, i.e. a 250µs cycle time. Obviously, Ethernet communication is not compatible with the 250µs real-time period. Therefore, we developed two versions of the embedded program of the card: a simple one that copies value between card I/O and network for applications with low real-time demands and a second version which includes the generation of the triphasic measurement point signals on the card. Characteristics of the signals (amplitude, phase and frequency) are sent through the network. Regulation loops with fast sampling rates are not handled for the moment while embedding a process model on the card will be considered in the future.
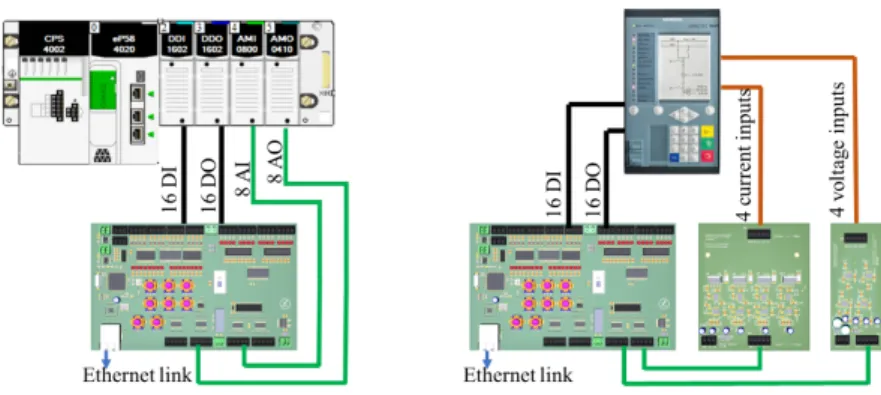
Price: There is an obvious trade-off between price and performance. A professional high-precision FAT system for IED may cost as high as 40.000e for a single mea-surement point signal generator. We want to keep the price affordable for research and education. We fixed a target objective cost of 400e per interface card and another 400e for a couple of power cards (current transformer and voltage transformer). Figure 3 presents the two use cases of the interface cards.
Fig. 3. Interface board connection : PLC (left) protection relay (right)
3
Industrial Process Simulator
The physical process simulator is a software able to reproduce the behavior of an in-dustrial process (e.g., a chemical factory). This simulator needs to be easily adaptable to any use case, thus being able to reproduce various process from a manufacturing factory to an electrical grid. Moreover, it needs to be able to communicate with both indutrial and IT components. For instance, in a realistic plateform such as G-ICS, in-cluding real industrial devices such as programmable automata, the simulator may need to understand either eletrical inputs or serial buses through interface boards presented in Section 2, or directly industrial protocols over TCP/IP such as MODBUS or OPC-UA. We propose a physical process simulator written in Python and revolving around the simpy3module. It is a process-based discrete-event simulation framework allowing to
model and schedule components such as valves or coolers. In our simulator we chose to model components as independent tasks, scheduled on a shared clock.
That is, each component is woken up at each – multiple of a – clock tick and can compute its outputs given its inputs. More formally, each component type (e.g., a valve) is described as a Python class implementing a process method. This method is the one called by simpy every tick, computing outputs using inputs. This way, components can be reused in multiple process models. In a main script, these classes are instantiated with their inputs specified as lambda functions (or Python properties). This allows the attribute of the component to be physically the same variable as the one in the main script and not a copy needing synchronization. Then, the process method is registered by simpy alongside any other component or method needed by the process (e.g., input control or output monitoring). A working toy example is given for a valve in Listing 1.1 with the main script in Listing 1.2.
Multiple interfaces are available for the simulator to communicate with other com-ponents. First, a UDP library is used to handle the domain-specific communication pro-tocol with the interface board. This propro-tocol allows to read digital and analog inputs and to respectively write outputs. Depending on the context, real industrial protocol servers can also be started. Obviously, as the simulator runs on a computer, a matching physical
3
interface will be needed to handle connections (e.g., an Ethernet port for TCP/IP or a FTDI cable for serial protocols). The simulator implements a REST API allowing to synchronize inputs and outputs with databases for data persistency. Moreover, it allows interaction with other programs such as a visualization of the values of the simulated components or direct modifications of variables with a presentation tablet. The process simulator’s code is available on demand on a GIT repository4.
1 c l a s s V a l v e ( ) : 2 o p e n e d = None 3 i n p u t F l o w = None 4 o u t p u t F l o w = None 5 6 d e f i n i t ( s e l f , opened , i n p u t F l o w ) : 7 s e l f . o p e n e d = o p e n e d 8 s e l f . i n p u t F l o w = i n p u t F l o w 9 10 d e f p r o c e s s ( s e l f , env ) : 11 w h i l e T r u e : 12 i f s e l f . o p e n e d ( ) : 13 s e l f . o u t p u t F l o w = s e l f . i n p u t F l o w ( ) 14 e l s e: 15 s e l f . o u t p u t F l o w = 0 16 y i e l d env . t i m e o u t ( 1 )
Listing 1.1. A valve component
1 i m p o r t s i m p y 2 3 o p e n e d = T r u e 4 i n p u t F l o w = 50 5 env = s i m p y . E n v i r o n m e n t ( ) 6 7 d e f c o n t r o l V a l v e ( ) : 8 g l o b a l opened , i n p u t F l o w 9 w h i l e T r u e : 10 # Code c o n t r o l l i n g t h e 11 # v a l v e d u r i n g s i m u l a t i o n 12 y i e l d env . t i m e o u t ( 1 ) 13 14 v a l v e = V a l v e ( 15 env , 16 o p e n e d =l a m b d a: o pened , 17 i n p u t F l o w =l a m b d a: i n p u t F l o w 18 ) 19 20 env . p r o c e s s ( c o n t r o l e V a l v e ( ) ) 21 env . p r o c e s s ( v a l v e . p r o c e s s ( env ) ) 22 env . r u n ( )
Listing 1.2. Main script
4
Evaluation on the G-ICS Industrial Cybersecurity Testbed
GreEn-ER5Industrial Control systems Sandbox (G-ICS) is a university testbed started
in 2015 and hosted by ENSE36 engineer school. It contains around 100 industrial
de-vices (PLC, IED, HMI and RTU) and SCADA servers, connected with the interface boards to the process simulator presented in sections 2 and 3. A monitoring VLAN al-lows capture of the testbed traffic. Industrial firewalls and IDS are deployed and secure architectures may be built. The testbed is used for teaching automation, supervisory control, communication networks, cybersecurity and for research. It was used for the experimental validation of three PhD thesis [11, 14, 3] and as a demonstrator for the Grenoble Alpes Cybersecurity Institute and Nanoelec Research Technological Institute. Two experimental setups were deployed and used for testing and validation of intru-sion detection algorithms. One was related to research developed in [15] and is a freely adapted version of the Tennesee-Eastman process. The physical process simulation and the PLC programs are available on the project GIT repository. Experimental data-sets were published on PerSCiDO7 data-sets platform. The second one is an electrical pro-tection scheme and was used to demonstrate the exploitation of the vulnerabilities in
4
https://gforge.inria.fr/projects/eastman/
5
Grenoble ´Energie - Enseignement et Recherche
6 ´
Ecole Nationale Sup´erieure de l’ ´Energie, l’Eau et l’Environnement of Grenoble INP
7
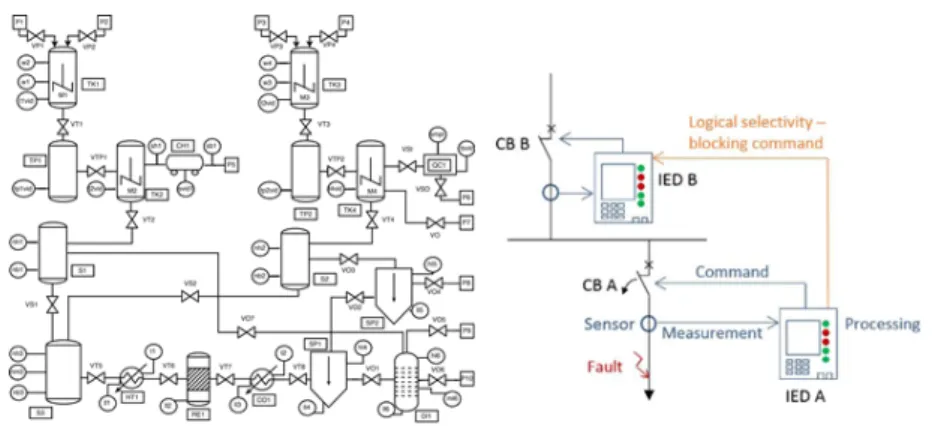
real-time control protocols in electrical substation communications [12]. The IED pro-grams, the traffic data-sets and the Bro detector module are available on the project repository. Both physical processes are presented in Figure 4.
Fig. 4. Physical processes: Tennessee-Eastman (left) and electrical protection scheme (right) On the considered examples the interface cards performed well from the point of view of real-time performance. The electrical protection use case proved that the qual-ity of the signal provided by the interface card together with the power cards is sufficient to be used in conjunction with real protection relay. We confirmed the signal quality on 10 different IED. Scalability is still to be experimentally validated. The two cited ex-amples were relatively simple. The Tennessee-Eastman process needed three interface cards (three PLC and three RTU were used). The logical protection scheme employed two interfaces. A more complex example was developed in an industrial partnership and employed seven interfaces. The UDP communication protocol between the process simulation and the card is easy to implement. This allows to interface the card with any simulation software like Modelica or Matlab alongside our Python process simulator.
4.1 Protocol implementation and real-time performance evaluation
The UDP communication between the simulation and the card is very loosely inspired from Modbus and used a variable length application protocol data unit ( Figure 9).
Fig. 5. Application protocol data unit (APDU)
The function code defines the operation (read inputs, write outputs, card configura-tion). The magic number is used to detect the protocol version and distinguish between requests and responses. A write request of all the outputs of the card (8 analog and 16 digital) will use 18 bytes of data then the total length of the APDU is 22 bytes. In our implementation the write request is unacknowledged. The read request does not require
any data then the APDU is 4 bytes long. The answer of the read request will transmit 18 bytes of data then the APDU is 22 bytes long for the 8 analog and 16 digital inputs. At the Ethernet level all these frames will fit in the minimal size Ethernet frame, i.e. 64 bytes including all the protocol headers.
The regular process simulator loop will read periodically the inputs for the card, compute the new state then write the outputs to the card. The network bandwidth re-quired per simulation loop is of 3 minimal size Ethernet frames, i.e. 192 bytes/period.
A first limit of the capabilities of our hardware-in-the-loop system is given by the relation : (192 × N umber of cards)/Simulation period ≤ N etwork Bandwidth. For example, on a FastEthernet network, using 100 cards the minimal achievable simu-lation period is less than 200 µs.
A second limitation of the simulation capability comes from the card response time. In the previous example it is questionable if at 200 µs time interval between two requests the card will be able to respond. In order to address this question we experimentally measured the rough response time of the interface card. The experimental setup uses a direct Ethernet connection between a computer and the interface card. We studied statistically the response time of the sequences READ request/READanswer and
W RIT E request/READ request/READ answer between the computer and the interface card. The requests were repeated at 10 ms interval in order to have independent samples. The statistical sample size is of 4300 exchanges. Measures were made with Wireshark.
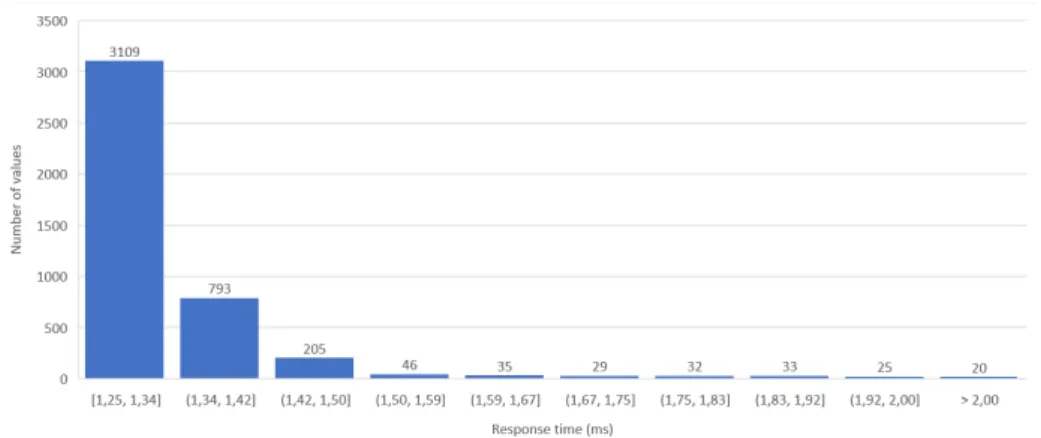
For the READ request/READ answer response time the average value is of 1.322 ms with a confidence interval at 99% of 178µs. However for the real-time perfor-mance the measure of interest is the worse case response time. For our sample this value is of 6.635 ms. The Figure 10 shows the histogram of the response time experimental values.
Fig. 6. Read request response time distribution
We can notice that only less than 0.5% of the response times are superior to 2 ms and more than 80% are into the interval (1.25ms...1.5ms). However, this performance is not adequate for a hard real-time application. The variability in the response time
comes from the communication between the STM32 processor and the two MCP23016 I/O expander chips. We experimentally found that at random time intervals the commu-nication timeouts and the I2C has to be reset. This is a point that has to be explored in the future.
For the duration of the W RIT E request/READ request/READ answer, as there is no acknowledgment for the W RIT E request only the complete sequence length and the time between W RIT E request and READ request may be mea-sured. The time between W RIT E request and READ request depends only on the computer and does not concern the card. On the computer used for the experiment (a Xeon E-2186M with 128Go RAM running Windows 10) the measured time between the W RIT E and READ requests is averaging at 23µs. The total length of the sequence is 1.345 ms with a worse case at 6.651. The histogram of the response time experimental values is shown in Figure 11.
Fig. 7. Write/Read sequence response time distribution
We may conclude that the shortest achievable simulation period is around 7 ms and we may advise to further increase it to 10 ms in order to insure that the response time of the card will follow. Clearly the 10 ms minimal simulation period is not enough to directly generate high rate samples for the PLC inputs (for the instance the 4 kHz sample rate for the electrical network measures). Then for demanding applications like smart-grid simulation the samples are generated by a code embedded on the card. The simulation will only refresh every 10 ms the parameters of the signal.
When using multiple cards a dedicates network or a vlan is suggested. At 10 ms simulator period the required bandwidth per card is 19.2 kbps. While this may seem ridiculous for 100 cards it will raise to 2 Mbps which will interfere with the SCADA traffic biasing the experiment.
4.2 Cybersecurity applications
The hardware-in-the-loop system allows the visualization of cyberattacks effects on the physical process. We are using it to visualize the consequences of ICS CVE8
ex-ploitation in cybersecurity awareness classes for computer science and control system students.
Nevertheless the main application field of the virtualization system is the study of the attack scenarios in the cyber domain whose effects are visible in the physical do-main. Such attacks called process-oriented attacks or process-aware attacks will inject malicious commands into the industrial communication flows but will not violate pro-tocol specifications and, therefore, are difficult to detect [18]. Based on our hardware-in-the-loop system we developed studies of process oriented attacks in two application fields : industrial automation and power grid protection.
In industrial automation field we were interested in sequence attacks [19, 16]. In a sequence attack an attacker may manipulate the relative order of commands to produce an incorrect behavior of the process (qualitative attacks) or alter the timing between commands (quantitative attacks). The plant description (Tenesee-Eastman process from Figure 4.), the attacks and the detection methodology are described in [14]. The normal (attack-free) datasets used for IDS training and the datasets containing the attacks are available online: [20].
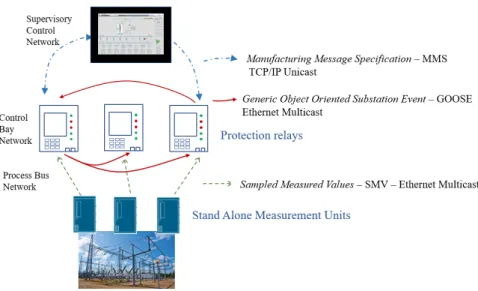
The electrical networks automation and protection application domain is more spe-cific in the sense that it will relay on three communication protocols from the IEC 61850 stack: Sampled Measured Values (SMV) for current and voltage sensor samples val-ues transmission Generic Object Oriented Substation Event (GOOSE) for controller-to-controller event (process or discrete state change) transmission an Manufacturing Mes-sage Specification (MMS) for SCADA-to-controller communication. SV and GOOSE communications are non-IP (Ethertype) protocols. SMV is supposed to be used on a dedicated high availability network (usually HSR9) called the process bus. GOOSE
frames are transmitted in the local network (called bay network) and a higly available network is also recommended (preferably PRP10). MMS may be used for remote
con-nections between control room and protection devices. The different communication levels and flow types are represented in Figure 12.
Process-oriented attacks in 61850 networks will aim to disturb the power grid by ac-tuator manipulation. The acac-tuators in a power grid are the electrical switches and they are controlled by the protection relays. Therefore manipulation of the electrical switches can be achieved either from SCADA through MMS protocol (what CrashOverride at-tack did [7]) or triggering protection functions related events at bay or process level (generation of a trip signal).
Our smart-grid cybersecurity studies were targeted to the triggering of protection functions either by injection of false sampled measures in the SMV flow (a false elec-trical flow) either by injecting false controller state events (a false command sent to a protection relay via GOOSE protocol). We were also able to inhibit legitimate trip
sig-8Common Vulnerabilities and Exposure 9
High-availability Seamless Redundancy
10
Fig. 8. Communication flows in an IEC 61850 substation
nals via GOOSE protocol corruption. Results on GOOSE protocol were published in [11–13]. The SMV attack part together with the datasets will be soon available.
5
Evaluation
On the considered examples the interface cards performed well from the point of view of real-time performance. The electrical protection use case proved that the quality of the signal provided by the interface card together with the power cards is sufficient to be used in conjunction with real protection relay. We confirmed the signal quality on 10 different IED. Scalability is still to be experimentally validated. The two cited ex-amples were relatively simple. The Tennessee-Eastman process needed three interface cards (three PLC and three RTU were used). The logical protection scheme employed two interfaces. A more complex example was developed in an industrial partnership and employed seven interfaces. The UDP communication protocol between the process simulation and the card is easy to implement. This allows to interface the card with any simulation software like Modelica or Matlab alongside our Python process simulator.
5.1 Protocol implementation and real-time performance evaluation
The UDP communication between the simulation and the card is very loosely inspired from Modbus and used a variable length application protocol data unit ( Figure 9).
The function code defines the operation (read inputs, write outputs, card configura-tion). The magic number is used to detect the protocol version and distinguish between requests and responses. A write request of all the outputs of the card (8 analog and 16
Fig. 9. Application protocol data unit (APDU)
digital) will use 18 bytes of data then the total length of the APDU is 22 bytes. In our implementation the write request is unacknowledged. The read request does not require any data then the APDU is 4 bytes long. The answer of the read request will transmit 18 bytes of data then the APDU is 22 bytes long for the 8 analog and 16 digital inputs. At the Ethernet level all these frames will fit in the minimal size Ethernet frame, i.e. 64 bytes including all the protocol headers.
The regular process simulator loop will read periodically the inputs for the card, compute the new state then write the outputs to the card. The network bandwidth re-quired per simulation loop is of 3 minimal size Ethernet frames, i.e. 192 bytes/period.
A first limit of the capabilities of our hardware-in-the-loop system is given by the relation : (192 × N umber of cards)/Simulation period ≤ N etwork Bandwidth. For example, on a FastEthernet network, using 100 cards the minimal achievable simu-lation period is less than 200 µs.
A second limitation of the simulation capability comes from the card response time. In the previous example it is questionable if at 200 µs time interval between two requests the card will be able to respond. In order to address this question we experimentally measured the rough response time of the interface card. The experimental setup uses a direct Ethernet connection between a computer and the interface card. We studied statistically the response time of the sequences READ request/READanswer and
W RIT E request/READ request/READ answer between the computer and the interface card. The requests were repeated at 10 ms interval in order to have independent samples. The statistical sample size is of 4300 exchanges. Measures were made with Wireshark.
For the READ request/READ answer response time the average value is of 1.322 ms with a confidence interval at 99% of 178µs. However for the real-time perfor-mance the measure of interest is the worse case response time. For our sample this value is of 6.635 ms. The Figure 10 shows the histogram of the response time experimental values.
We can notice that only less than 0.5% of the response times are superior to 2 ms and more than 80% are into the interval (1.25ms...1.5ms). However, this performance is not adequate for a hard real-time application. The variability in the response time comes from the communication between the STM32 processor and the two MCP23016 I/O expander chips. We experimentally found that at random time intervals the commu-nication timeouts and the I2C has to be reset. This is a point that has to be explored in the future.
For the duration of the W RIT E request/READ request/READ answer, as there is no acknowledgment for the W RIT E request only the complete sequence length and the time between W RIT E request and READ request may be mea-sured. The time between W RIT E request and READ request depends only on the computer and does not concern the card. On the computer used for the experiment (a Xeon E-2186M with 128Go RAM running Windows 10) the measured time between the
Fig. 10. Read request response time distribution
W RIT E and READ requests is averaging at 23µs. The total length of the sequence is 1.345 ms with a worse case at 6.651. The histogram of the response time experimental values is shown in Figure 11.
Fig. 11. Write/Read sequence response time distribution
We may conclude that the shortest achievable simulation period is around 7 ms and we may advise to further increase it to 10 ms in order to insure that the response time of the card will follow. Clearly the 10 ms minimal simulation period is not enough to directly generate high rate samples for the PLC inputs (for the instance the 4 kHz sample rate for the electrical network measures). Then for demanding applications like smart-grid simulation the samples are generated by a code embedded on the card. The simulation will only refresh every 10 ms the parameters of the signal.
When using multiple cards a dedicates network or a vlan is suggested. At 10 ms simulator period the required bandwidth per card is 19.2 kbps. While this may seem
ridiculous for 100 cards it will raise to 2 Mbps which will interfere with the SCADA traffic biasing the experiment.
5.2 Cybersecurity applications
The hardware-in-the-loop system allows the visualization of cyberattacks effects on the physical process. We are using it to visualize the consequences of ICS CVE11 ex-ploitation in cybersecurity awareness classes for computer science and control system students.
Nevertheless the main application field of the virtualization system is the study of the attack scenarios in the cyber domain whose effects are visible in the physical do-main. Such attacks called process-oriented attacks or process-aware attacks will inject malicious commands into the industrial communication flows but will not violate pro-tocol specifications and, therefore, are difficult to detect [18]. Based on our hardware-in-the-loop system we developed studies of process oriented attacks in two application fields : industrial automation and power grid protection.
In industrial automation field we were interested in sequence attacks [19, 16]. In a sequence attack an attacker may manipulate the relative order of commands to produce an incorrect behavior of the process (qualitative attacks) or alter the timing between commands (quantitative attacks). The plant description (Tenesee-Eastman process from Figure 4.), the attacks and the detection methodology are described in [14]. The normal (attack-free) datasets used for IDS training and the datasets containing the attacks are available online: [20].
The electrical networks automation and protection application domain is more spe-cific in the sense that it will relay on three communication protocols from the IEC 61850 stack: Sampled Measured Values (SMV) for current and voltage sensor samples val-ues transmission Generic Object Oriented Substation Event (GOOSE) for controller-to-controller event (process or discrete state change) transmission an Manufacturing Mes-sage Specification (MMS) for SCADA-to-controller communication. SV and GOOSE communications are non-IP (Ethertype) protocols. SMV is supposed to be used on a dedicated high availability network (usually HSR12) called the process bus. GOOSE
frames are transmitted in the local network (called bay network) and a higly available network is also recommended (preferably PRP13). MMS may be used for remote con-nections between control room and protection devices. The different communication levels and flow types are represented in Figure 12.
Process-oriented attacks in 61850 networks will aim to disturb the power grid by ac-tuator manipulation. The acac-tuators in a power grid are the electrical switches and they are controlled by the protection relays. Therefore manipulation of the electrical switches can be achieved either from SCADA through MMS protocol (what CrashOverride at-tack did [7]) or triggering protection functions related events at bay or process level (generation of a trip signal).
11Common Vulnerabilities and Exposure 12
High-availability Seamless Redundancy
13
Fig. 12. Communication flows in an IEC 61850 substation
Our smart-grid cybersecurity studies were targeted to the triggering of protection functions either by injection of false sampled measures in the SMV flow (a false elec-trical flow) either by injecting false controller state events (a false command sent to a protection relay via GOOSE protocol). We were also able to inhibit legitimate trip sig-nals via GOOSE protocol corruption. Results on GOOSE protocol were published in [11–13]. The SMV attack part together with the datasets will be soon available.
6
Conclusion and related work
There was an intense activity in testbed construction in the last years. A survey is pro-vided in [9]. Depending on the virtualization degree, there are three kinds of testbeds:
Full virtualization:Those approaches will virtualize the process and the control equipment using a simulation of the PLC. These approaches differ from ours since our goal is to rely on the real hardware equipment (which are yet to be realistically reproduced by software simulation).
Physical process virtualization:Our testbed fits in this category. Many approaches will rely on commercial simulation software like Matlab/Simulink, OPAL-RT, Lab-VIEW, Power-World. Several other works will develop, like us, an industrial process simulator. Most of them are dedicated to a certain kind of process (e.g., chemical indus-try) and are mainly used for productivity forecasting [8, 26, 17, 27, 21, 5]. They are not designed to communicate with other components such as PLCs and thus do not have any network interface such as MODBUS. Other are sparsely configurable and are not meant to reproduce an industrial process [25, 2, 6, 22]. Rather, they are used to test and stress SCADA by populating data. Some are not open-source software, making them
costly to use for research and/or student projects [23, 4]. Finally, some open-source al-ternatives exist but are abandoned and relying on outdated languages or modules [1, 24] making them difficult to extend.
Concerning the connection between the physical process simulator and the hard-ware PLC most of the solutions will either use a communication protocol to read and write variable in the PLC memory or use commercial high precision hardware (like Omicron, OPAL-RT, Megger or Doble). The first solution (direct memory read/write) has zero cost but it is not realistic. The second one has a professional precision but a tremendous cost. Closest works to our solution are Factory I/O Advantech USB 4750 sold by RealGames14and the one sold by Schneider15. Both solutions are are USB con-nected so they will not scale and they provide digital I/O only. In general, commercial interface boards (Arduino shields, Raspberry Pi modules or specialized data acquisi-tion modules) are limited to digital I/O and, sometime analog input. Analog outputs are rare, and available in small numbers : one or two. Our card, able to provide eight analog outputs (for IED interfacing) is the only one available at the moment.
No virtualization:These testbeds are real size processes, built especially for cyber-security studies. These are moreover nation wide projects, the most well known being the Idaho National Laboratory [10] which is a full industrial systems. Yet, changing the physical process in these solutions is indeed costly.
In this paper, we proposed a low-cost open-source physical system simulation so-lution, with reasonable real-time performance allowing cybersecurity studies both for teaching and research and including real control devices. We provided electronic cards and a Python process simulator, allowing to reproduce realistic and easily customiz-able industrial processes, connected to real industrial hardwares. Regarding the two challenges introduced in section 1, our testbed allows teaching and research on real in-dustrial hardwares rather than simulated components. Due to the criticality of inin-dustrial systems, this allows more trustworthy studies to be performed on the platform. Regard-ing the impact of cybersecurity on the physical process, our process simulator allows to easily implement various physical processes and train cybersecurity experts to the specificities of industrial systems. Future works aim at characterizing the scalability of the testbed on real use-cases.
References
1. Modrssim: Modbus PLC simulator (2010), http://www.plcsimulator.org/
2. Modbuspal - a Java Modbus simulator (2013), https://sourceforge.net/p/modbuspal/ 3. Altaher, A.: Implementation of a dependability framework for smart substation automation
systems : application to electric energy distribution. Ph.D. thesis, U. Grenoble Alpes (2018) 4. Berutti, M.: Virtual plant using mimic for Schneider electric control systems (2019) 5. Borshchev, A.: The big book of simulation modeling: multimethod modeling with AnyLogic
6. AnyLogic North America Chicago (2013)
6. Dogan, T.: MSS Modbus-TCP server simulator 1.0 (2019), http://tdogan.net/mss.html 7. Dragos: Crashoverride: Analysis of the threat to electric grid operations.,
https://dragos.com/blog/crashoverride/
14
https://realgames.co
15
8. Hammann, J.E., Markovitch, N.A.: Introduction to arena. In: Winter Simulation’15 (1995) 9. Holm, H., and al.: A survey of industrial control system testbeds. In: Secure IT Systems. pp.
11–26 (2015)
10. INL: Control system automated vulnerability assessment study. Technical report, Idaho Na-tional Laboratory (2013)
11. Kabir-Querrec, M.: Cyber security of smart-grid control systems : intrusion detection in IEC 61850 communication networks. Ph.D. thesis, U. G. A. (2017)
12. Kabir-Querrec, M., and al.: A Test bed dedicated to the Study of Vulnerabilities in IEC 61850 Power Utility Automation Networks. In: 21st ETFA (2016)
13. Kabir-Querrec, M., Mocanu, S., Bellemain, P., Thiriet, J.M., Savary, E.: Corrupted GOOSE Detectors: Anomaly Detection in Power Utility Real-Time Ethernet Communications. In: GreHack 2015. Verimag, Grenoble, France (Nov 2015), https://hal.archives-ouvertes.fr/hal-01237725
14. Koucham, O.: Intrusion detection for industrial control systems. Ph.D. thesis, U. G. A. (2018) 15. Koucham, O., and al.: Efficient Mining of Temporal Safety Properties for Intrusion Detection
in Industrial Control Systems. In: SAFEPROCESS’18. pp. 1–8. Warsaw, Poland (2018) 16. Larsen, J.: Breakage - black hat, https://www.blackhat.com/presentations/
bh-dc-08/Larsen/Presentation/bh-dc-08-larsen.pdf 17. Lavery, E., et al.: Introduction to Flexsim DS (2008)
18. Li, W., Xie, L., Deng, Z., Wang, Z.: False sequential logic attack on SCADA system and its physical impact analysis. Computers & Security (58), 149 – 159 (2016)
19. Marsh, C.R.T.: Critical foundations: Protecting America’s infrastructures. Technical report, The Report of the President’s Commission on Critical Infrastructure Protection (October 1997)
20. Mocanu, S.: GICS intrusion detection datasets, https://persyval-platform.univ-grenoble-alpes.fr/DS236/detaildataset
21. Pakonen, A., and al.: A toolset for model checking of PLC software. In: ETFA’13 (2013) 22. Path, W.: Modmultisim, a programmable Modbus slave simulator,
http://wingpath.co.uk/modbus/modmultisim.php
23. Riera, B., and al.: HOME I/O et FACTORY I/O: 2 logiciels innovants de simulation de PO pour la formation `a l’automatique. In: CESTIS’17 (2017)
24. Seidl, J.: Virtuaplant (2015), https://wroot.org/projects/virtuaplant/ 25. Toolbox, C.: Modbus TCP plant simulator. Tech. rep. (2009)
26. Vacher, A.: Prosimplus: New cape-open capabilities. In: The 2006 Annual Meeting (2006) 27. Wagner, D.: Dwsim - open source process simulator. Tech. rep. (2013),