HAL Id: hal-02276549
https://hal.inria.fr/hal-02276549
Submitted on 2 Sep 2019
HAL is a multi-disciplinary open access
archive for the deposit and dissemination of
sci-entific research documents, whether they are
pub-lished or not. The documents may come from
teaching and research institutions in France or
abroad, or from public or private research centers.
L’archive ouverte pluridisciplinaire HAL, est
destinée au dépôt et à la diffusion de documents
scientifiques de niveau recherche, publiés ou non,
émanant des établissements d’enseignement et de
recherche français ou étrangers, des laboratoires
publics ou privés.
Multi-Task Deep Learning for Satellite Image
Pansharpening and Segmentation
Andrew Khalel, Onur Tasar, Guillaume Charpiat, Yuliya Tarabalka
To cite this version:
Andrew Khalel, Onur Tasar, Guillaume Charpiat, Yuliya Tarabalka. Multi-Task Deep Learning for
Satellite Image Pansharpening and Segmentation. IGARSS 2019 - IEEE International Geoscience and
Remote Sensing Symposium, Jul 2019, Yokohama, Japan. �hal-02276549�
MULTI-TASK DEEP LEARNING
FOR SATELLITE IMAGE PANSHARPENING AND SEGMENTATION
Andrew Khalel
1,2, Onur Tasar
1, Guillaume Charpiat
3, Yuliya Tarabalka
11
TITANE team, Inria Sophia Antipolis - M´editerran´ee;
2Cairo University;
3TAU team, LRI, Inria Saclay
Email: [email protected]
ABSTRACT
In this work, we propose a novel multi-task framework, to learn satellite image pansharpening and segmentation jointly. Our framework is based on the encoder-decoder architecture, where both tasks share the same encoder but each one has its own decoder. We compare our framework against single-task models with different architectures. Results show that our framework outperforms all other approaches in both tasks. Index Terms— segmentation, pansharpening, multi-task, joint learning
1. INTRODUCTION
Recently, deep learning methods succeeded in getting detailed segmentation maps from aerial images. However, when ap-plying deep learning methods to images acquired by Earth observing satellites, the resulting segmentation maps are of-ten not very precise. This is partially due to the fact that most satellite imaging sensors capture separately a panchromatic image PAN (which has a high spatial resolution but consists only of a single band) and a multispectral image MS (which has more spectral bands but with lower spatial resolution). Most approaches start by creating a high resolution multispec-tral image HRMS, by “pansharpening”, i.e. merging the PAN and MS images. All further analysis, such as segmentation or detection, is then performed on this pansharpened image; therefore the quality of the pansharpening process is crucial.
Pansharpening methods can be divided into two cate-gories: classical and learning-based. The classical methods are usually generic statistical methods that can be applied to images from any satellite, without specific parameters. Some examples are: Bayesian fusion [1] and Local Mean and Variance Matching (LMVM) [2]. On the other hand, learning-based methods can tune parameters to each scenario to achieve better results. For instance, a three-layer network architecture (proposed earlier for super resolution) is used in [3] for pansharpening. PanNet [4] utilizes pansharpening domain knowledge by processing input data in a high pass domain instead of the image domain.
Semantic segmentation is the process of labeling each pixel of an image. Deep neural networks took over all classi-cal methods in this field due to their excellent performance.
Convolutional neural networks are used in [5] to segment aerial images. U-nets, initially introduced for biomedical image segmentation [6], prove to achieve good results on remote sensing images too [7]. Finally, FuseNet architec-tures directly segment MS and PAN images with no need of pansharpening [8].
Multi-task learning (MTL) consists in training for several tasks simultaneously. Learning a single task can be very effi-cient and concentrated; however, the knowledge gained by the model during training does not guarantee to generalize well to new data, whereas developing features useful for several different tasks helps in picking more robust ones. Multi-task deep learning is usually implemented by hard or soft shar-ing of intermediate layer parameters. Hard parameter sharshar-ing consists in using the same layers for different tasks. It is the most common method and it has been proved to reduce over-fitting risk significantly [9]. On the contrary, in soft parameter sharing, each task has its own model, and model similarity is encouraged by penalizing the distance between the parame-ters of each model.
In this paper, we introduce a framework that uses MTL to learn pansharpening and segmentation tasks jointly from MS and PAN images.
2. METHODOLOGY
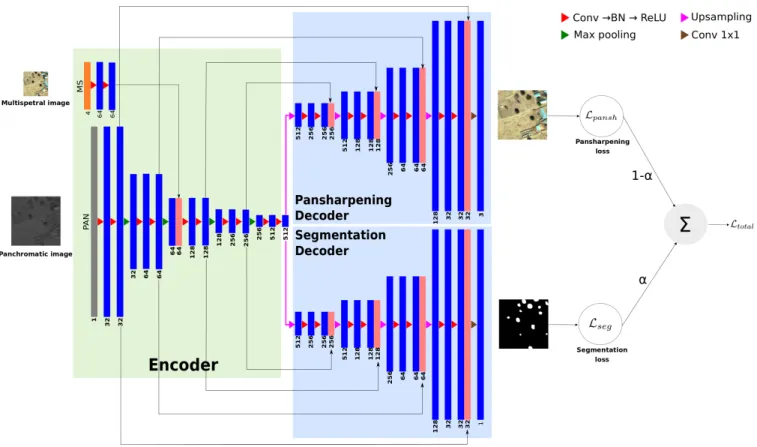
We consider a single-encoder multi-decoder architecture, as shown in Fig. 1 . A common encoder takes panchromatic (PAN) and multispectral (MS) images as input, and finds a data representation that satisfies all tasks. Each task is solved by a different decoder, plugged after the common encoder. The whole system is trained jointly from end to end.
The encoder consists of 4 convolution blocks, where each block comprises twice the sequence: convolution / batch-normalization / ReLU. Each convolution filter is of size 3 × 3. In the encoder, the MS image goes through a convolution block, and gets concatenated with the output of the PAN branch’s second block, which has then the same resolution (thanks to the different number of maxpoolings in the two branches, see Fig. 1).
The encoder and the decoders are connected with a con-volution block with 512 filters. Each task has a separate
de-Fig. 1: The overall pansharpening and segmentation framework.
coder. The architecture of all decoders is the same: the one of the encoder’s PAN branch, but in reverse order. At the end of each decoder, a 1 × 1 convolution layer is added, with a sigmoid activation. Finally, skip connections are added from each block of the encoder to the ones with similar resolution in the decoders.
Our loss function is a weighted sum of a segmentation loss (Lseg) and a pansharpening loss (Lpansh):
Ltotal= α Lseg+ (1 − α)Lpansh (1)
where α ∈ [0, 1] adjusts the relative importance of Lseg and
Lpansh. The segmentation loss is defined as:
Lseg= H − log(J )
where H is the cross-entropy between ground-truth (yi) and
predicted (ˆyi) pixel class probabilities, averaged over all n
pixels i: H(y, ˆy) = −1 n n X i=1 yilog(ˆyi) + (1 − yi) log(1 − ˆyi)
and J is the soft intersection over union loss [10]:
J (y, ˆy) = P i yiyˆi P i yi+ ˆyi− yiyˆi .
The pansharpening loss Lpanshis defined as a combination of
the Universal Image Quality Index (Q) [11] and of the Peak Signal-to-Noise Ratio (PSNR):
Lpansh = (1 − Q(y, ˆy)) + (1 −
PSNR(y, ˆy) 50 ) . Since the maximum value of Q is 1, we normalized PSNR by a typical value, to enforce fairness in optimization. The source code of this work is publicly available on github1.
3. EXPERIMENTS
Our dataset2 consists of 25 images, each covering an area of 1 km2. These 11-bits images have been captured by the WorldView-3 satellite, with panchromatic and multispectral sensors of 0.31m and 1.24m resolution, respectively. The dataset has PAN, MS and HRMS images, together with seg-mentation masks for trees. Samples from the dataset are shown on Fig. 2 .
We split our dataset into two sets: training set (75%) and validation set (25%). We took the top left quarter of each image as validation set, and the rest for training. To evalu-ate performance, Intersection over Union (IoU) [12] is used
1https://github.com/andrewekhalel/MTL_PAN_SEG 2Dstl Satellite Imagery Feature Detection - https://www.kaggle.
(a) MS (b) PAN (c) HRMS (d) Mask
Fig. 2: Example images from the WorldView-3 dataset.
for segmentation. Universal Image Quality Index (Q) [11], Peak noise-to-signal ratio (PSNR) and Erreur Relative Glob-ale Adimensionnelle de Synth`ese (ERGAS) [13] are used for pansharpening evaluation.
Table 1 shows the experimental setup parameters. During training and testing, data augmentation is used, to yield more robust models. The transformations used are: rotations (with angles 90, 180 and 270) and flips (horizontally and vertically).
hyper-parameter value optimizer Adam initial learning rate 10−3
decay rate 0.1 decay epoch 10th
batch size 16 patch size 256 x 256
epochs 40 iterations per epoch 5000
Table 1: Parameter values.
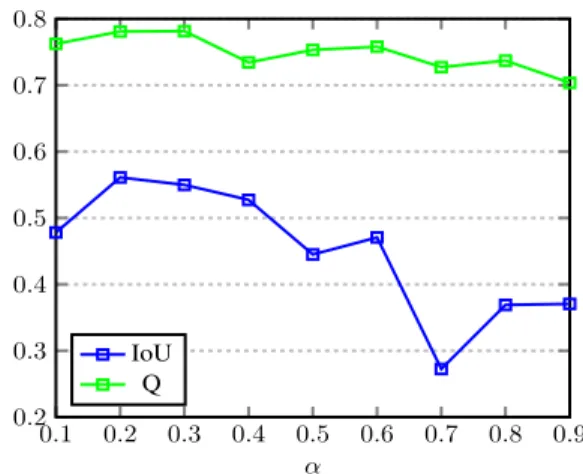
We run a set of experiments to optimize the value of the weighing factor α in Eq. 1. Each experiment uses a different value for α, starting from 0.1 to 0.9 with 0.1 linear step. To avoid fluctuations in the results (caused by weights initializa-tion), we perform each experiment 3 times independently and average the results. We run each experiment for 10 epochs. The results shown in Fig. 3 suggest that α = 0.2 is a reason-able value. Therefore, we used this value for training our final multi-task model.
Table 2 shows the results of different architectures for both tasks. We can see that our model outperforms FuseNet [8] and PanNet [4] on the segmentation and pansharpening tasks, respectively. Furthermore, our multi-task model sur-passes all single-task models. Multi-task learning improves results in the two tasks.
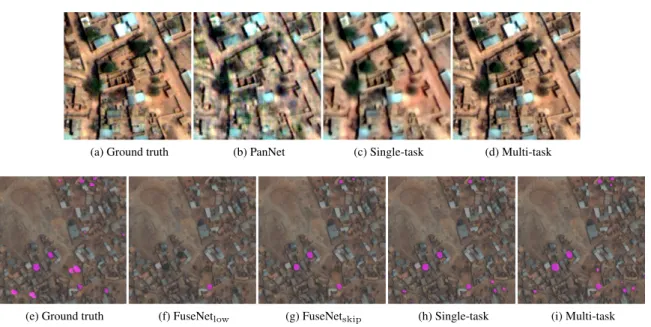
On Fig. 4, sub-figures (a-d) compare different pansharp-ening techniques. One can see that PanNet produces many artifacts, and that single-task outputs are blurry. On the other hand, our multi-task pansharpening output is visually closer to the ground truth. Sub-figures (e-i) illustrates tree segmen-tation (colored in magenta). FuseNetlow and FuseNetskip
0.1 0.2 0.3 0.4 0.5 0.6 0.7 0.8 0.9 0.2 0.3 0.4 0.5 0.6 0.7 0.8 α IoU Q
Fig. 3: Universal Image Quality Index (Q) and Intersection over Union (IoU) values on the validation set, for different α.
produce many false negatives (many trees are missed). Our single-task and multi-task segmentation results are very close but the multi-task model produces more true positives.
4. CONCLUSION
In this paper, we introduced a framework that learns two different remote sensing imagery tasks simultaneously: pan-sharpening and segmentation. The experimental results showed that this multi-task model surpasses all single-task models (including different architectures) in both tasks. MTL proved to be able to enhance generalization performance, by representing data in a form that can be utilized by different tasks.
5. REFERENCES
[1] Dominique Fasbender, Julien Radoux, and Patrick Bo-gaert, “Bayesian data fusion for adaptable image pan-sharpening,” IEEE Transactions on Geoscience and Re-mote Sensing, vol. 46, no. 6, pp. 1847–1857, 2008. [2] Stanislas de B´ethune, Fabrice Muller, and Jean-Paul
Donnay, “Fusion of multispectral and panchromatic im-ages by local mean and variance matching filtering tech-niques,” Fusion of Earth Data, pp. 28–30, 1998. [3] Giuseppe Masi, Davide Cozzolino, Luisa Verdoliva, and
Giuseppe Scarpa, “Pansharpening by convolutional neu-ral networks,” Remote Sensing, vol. 8, no. 7, pp. 594, 2016.
[4] Junfeng Yang, Xueyang Fu, Yuwen Hu, Yue Huang, Xinghao Ding, and John Paisley, “Pannet: A deep net-work architecture for pan-sharpening,” in Proc. IEEE Int. Conf. Comput. Vis.(ICCV), 2017, pp. 1753–1761. [5] Emmanuel Maggiori, Yuliya Tarabalka, Guillaume
Method Tasks Seg. metrics Pansharpening metrics IoU [↑] Q [↑] PSNR [↑] ERGAS [↓] FuseNetlow[8] Segmentation 0.319 N/A N/A N/A
FuseNetskip[8] Segmentation 0.325 N/A N/A N/A
Our single-task model Segmentation 0.599 N/A N/A N/A PanNet [4] Pansharpening N/A 0.633 39.6 19.4 Our single-task model Pansharpening N/A 0.793 41.5 15.5 Our multi-task model Pansharpening + Segmentation 0.610 0.961 48.0 7.8
Table 2: The results of different methods on the validation set.
(a) Ground truth (b) PanNet (c) Single-task (d) Multi-task
(e) Ground truth (f) FuseNetlow (g) FuseNetskip (h) Single-task (i) Multi-task
Fig. 4: Visual results of different models on the validation set. Sub-figures (a-d) show pansharpening close-ups, while sub-figures (e-i) show the segmentation of trees (colored in magenta).
Charpiat, and Pierre Alliez, “Convolutional neural net-works for large-scale remote-sensing image classifica-tion,” IEEE Transactions on Geoscience and Remote Sensing, vol. 55, no. 2, pp. 645–657, 2017.
[6] Olaf Ronneberger, Philipp Fischer, and Thomas Brox, “U-net: Convolutional networks for biomedical image segmentation,” in International Conference on Med-ical image computing and computer-assisted interven-tion. Springer, 2015, pp. 234–241.
[7] Bohao Huang, Kangkang Lu, Nicolas Audebert, An-drew Khalel, Yuliya Tarabalka, Jordan Malof, Alexan-dre Boulch, Bertrand Le Saux, Leslie Collins, Kyle Bradbury, et al., “Large-scale semantic classification: outcome of the first year of inria aerial image labeling benchmark,” in IGARSS, 2018.
[8] John Ray Bergado, Claudio Persello, and Alfred Stein, “Fusenet: End-to-end multispectral vhr image fusion and classification,” in IGARSS, 2018, pp. 2091–2094.
[9] Jonathan Baxter, “A bayesian/information theoretic model of learning to learn via multiple task sampling,” Machine learning, vol. 28, no. 1, pp. 7–39, 1997. [10] Md Atiqur Rahman and Yang Wang, “Optimizing
intersection-over-union in deep neural networks for im-age segmentation,” in International Symposium on Vi-sual Computing. Springer, 2016, pp. 234–244.
[11] Zhou Wang and Alan C Bovik, “A universal image qual-ity index,” IEEE signal processing letters, vol. 9, no. 3, pp. 81–84, 2002.
[12] Gabriela Csurka, Diane Larlus, Florent Perronnin, and France Meylan, “What is a good evaluation measure for semantic segmentation?.,” in BMVC, 2013, vol. 27. [13] Lucien Wald, “Quality of high resolution synthesised
images: Is there a simple criterion?,” in Third con-ference” Fusion of Earth data: merging point mea-surements, raster maps and remotely sensed images”. SEE/URISCA, 2000, pp. 99–103.