HAL Id: hal-03117190
https://hal.archives-ouvertes.fr/hal-03117190
Submitted on 21 Jan 2021
HAL is a multi-disciplinary open access
archive for the deposit and dissemination of
sci-entific research documents, whether they are
pub-lished or not. The documents may come from
teaching and research institutions in France or
abroad, or from public or private research centers.
L’archive ouverte pluridisciplinaire HAL, est
destinée au dépôt et à la diffusion de documents
scientifiques de niveau recherche, publiés ou non,
émanant des établissements d’enseignement et de
recherche français ou étrangers, des laboratoires
publics ou privés.
Detailed analysis of the isotopic composition of CO and
characterization of the air masses arriving at Mount
Sonnblick (Austrian Alps)
Valérie Gros, Maya Bräunlich, T. Röckmann, P. Jöckel, P. Bergamaschi, C.
Brenninkmeijer, W. Rom, W. Kutschera, A. Kaiser, H. Scheel, et al.
To cite this version:
Valérie Gros, Maya Bräunlich, T. Röckmann, P. Jöckel, P. Bergamaschi, et al.. Detailed analysis of
the isotopic composition of CO and characterization of the air masses arriving at Mount Sonnblick
(Austrian Alps). Journal of Geophysical Research: Atmospheres, American Geophysical Union, 2001,
106 (D3), pp.3179-3193. �10.1029/2000JD900509�. �hal-03117190�
JOURNAL OF GEOPHYSICAL RESEARCH, VOL. 106, NO. D3, PAGES 3179-3193, FEBRUARY 16, 2001
Detailed analysis of the isotopic composition of CO
and characterization of the air masses
arriving
at Mount Sonnblick (Austrian Alps)
Valerie Gros,
• Maya Br•iunlich,
• T. R6ckmann,
• P. J6ckel,
• P. Bergamaschi,
•,2
C.A.M. Brenninkmeijer,
• W. Rom,
TM
W. Kutschera,
3 A. Kaiser,
s H. E. Scheel,
6
M. Mandl, 7 J. van der Plicht, 8 and G. Possnert
9
Abstract. Air sampling
for analysis
of CO and its isotopic
composition
(•3C, •80, and 14C)
has
been performed at the alpine station Sonnblick (47øN, 13øE, 3106 m above sea level) since
September
1996. A high degree of variability is observed,
which is due to the wide variation in the
origin of air masses
sampled.
On the basis of the CO and isotope
results, a classification
of the
different
samples
is performed.
Other data such
as 7Be, 03, relative humidity, and back trajectories
are used to give additional
information about the air mass origin. Background
values,
representative
of the NH midlatitudes
free troposphere,
are observed
about 50% of the time and
are used to define seasonal
cycles. CO and its isotopes
show a minimum in summer and a
maximum in winter with extreme values of 90 and 160 ppb for CO, -30 and -25 %0 for •5•3C,
0 and
8 %o
for •5•80,
and 8 and 20 molecules
cm
'3 STP for •4CO.
CO and stable
isotope
data are compared
with results
from a three-dimensional
model (TM2). Generally
good agreement
supports
the CO,
•5•3CO,
and •5C'•O
source/sink
distributions
inferred
by the model.
According
to model
calculations,
fossil fuel combustion contributes 35% in summer and 50% in winter of total CO for such a
midlatitude
location.
Other categories
of sampled
air are "subtropical,"
"polluted," and
"stratospheric"
and are observed
24%, 18%, and 4% of the time. Corresponding
signatures
of CO
and its isotopic
variations
are presented,
and some specific events are discussed.
1. Introduction constraints on the global CO cycle and can improve our
understanding
of the more detailed
processes,
although
at present
As the
main
reaction
partner
of the
hydroxyl
radical
(OH), inverse
modeling
still
seems
to require
substantial
improvements
carbon
monoxide
(CO)
influences
indirectly
the abundance
of [Bergamaschi
et al.,
2000b].
several
important
atmospheric
trace
gases
like
methane
or ozone Isotopic
analysis,
although
only
applied
on
a limited
scale,
can
[Intergovernmental Panel on Climate Change (IPCC), 1995]. The
existing measurement networks allow one to derive the global background distribution of CO and to determine its seasonal cycle
for the lower atmosphere [Novelli et al., 1998, and references
therein]. Furthermore, satellite data, now becoming available, will
provide information about the vertical distribution [Edwards et
al., 1999; Bovensmann et al., 1999]. Still, the quantification of the different CO sources and sinks will need a variety of approaches.
Recent development of an inverse model for CO allows one to
adjust source strengths according to observations [Bergamaschi et al., 2000a]. The isotopic composition of CO imposes further
'Air Chemistry Division, Max Planck Institute for Chemistry, Mainz, Germany.
2Now at Kirchzarten, Germany.
•Vienna Environmental Research Accelerator, Institute for Isotope
Research and Nuclear Physics, University of Vienna, Vienna, Austria. 4Now at •4C Dating Laboratory, Aahrus, Denmark.
•Centtal Institute for Meteorology and Geodynamics, Vienna, Austria. 6Fraunhofer Institute, Garmisch-Partenkirchen, Germany.
7Central Institute for Meteorology and Geodynamics, Salzburg,
Austria.
8Centre for Isotope Research, University of Groningen, Netherlands.
9,/mgstr6m Laboratory, University of Uppsala, Uppsala, Sweden.
Copyright 2001 by the American Geophysical Union. Paper number 2000JD900509.
0148-0227/01/2000JD900509509.00
help to study
sources,
whereas
the isotope
fractionation
occurring
during
its reaction
with OH gives
information
on the degree
of
removal in the atmosphere. For a recent review on CO isotopes, see Brenninkmeijer et al. [1999]. Here we only recall the isotopic
signatures
for the main CO sources,
that is, fossil fuel
combustion, oxidation of methane (CH4) and nonmethane
hydrocarbons
(NMHC), and biomass
burning
(Table 1). Other
estimates
are given by Bergamaschi
et al. [2000b]. The main
features are (1) the very depleted /5•-•C values for CO from methane oxidation, (2) the well defined /5•80 signature for the
fossil fuel combustion source, and (3) the considerable
uncertainty
of/5•80 associated
to the secondary
sources
of CO
(oxidation of CH4 and NMHC). Knowing the isotopic
composition of the sources is necessary but not sufficient. One also has to know the fractionation occurring during CO sink
processes, most importantly oxidation by OH. Kinetic isotope
effects (KIEs) enrich the remaining CO in '3C and deplete it in '80 [Stevens and Wagner, 1989; ROckmann et al., 1998].
Concerning '4CO, this ultra trace gas can be considered to a large degree as independent of CO itself. Indeed, approximately 3A of all '4CO in the atmosphere is of direct cosmogenic origin; that is, '4C is produced by the neutron-proton exchange reaction in nitrogen •N (n,p) •C, after which it is rapidly oxidized to '4CO [MacKay et al., 1963; Pandow et al., 1960]. The remaining ¬ is referred to as "recycled" •4C, and is of biogenic origin. For instance, the oxidation by OH of CI-I4, which is mainly biogenic
and
contains
x•C,
produces
'4CO.
The average
abundance
of •4CO
3180 GROS ET AL.: ISOTOPIC COMPOSITION OF CO AT MT. SONNBLICK
Table 1. Inferred and Measured Isotopic Composition for the
Main Sources of CO
õ,3C (Y,,) V-PDB /51'O 0h) V-SMOW
Fossil fuel combustion -27.4' 23.5 'J'
Biomass burning -21.3' --16 s -24.5 a --18' CI-I4 oxidation -52.6' O s" 15' NMHC oxidation -32' • 15' ß Stevens et al. [1972] b Brenninkmeijer [1993] c Conny et al. [ 1997] • Conny [1998]
' Stevens and Wagner [1989]
• Based on õ'3C of CI-h, 47.2•h [Quay et al., 1991] and on the
fracfionation in CI-h + OH of 5.4 •h [Cantrell et al., 1990], assuming quantitative conversion of CI-h into CO.
s Brenninkmeijer and ROckmann [ 1997]
in the troposphere is very low, in the range of 5 to 30 molecules cm --•. The total source of •4CO being largely independent from
human
activities
makes
•4CO
an excellent
tracer
for investigating
long-term changes in the atmosphere. However, •4CO has the OH and soil sink in common with CO. It has been proposed that •CO may track changes in OH, but also differences in Stratosphere- Troposphere Exchange (STE) [Brenninkmeijer et al., 1992; JOckel et al., 2000].
Over the last few years, data from an increasing number of stations, where air sampling for CO isotope measurements is performed, have allowed a first picture of CO isotopic changes
and seasonal cycles to be drawn. Most of these stations are located at remote locations, often in marine environments, where the long distances from the main CO source areas allow
background
air to be sampled
most
of the time. Only few specific
studies have been performed in continental areas [Volz et al.,
1981; Huff and Thiemens, 1998; Kato et al., 1999; Tyler et al.,
1999; Mak and Kra, 1999; Kato et al., 2000]. Measurements in
continental areas are quite difficult to interpret because of the mixing of emissions from surrounding sources into the background air. The risk is that the recorded signal is partly local and therefore not representative on the regional/continental scale. This is especially critical for CO which is emitted by various technological sources. In contrast, •CO measurements, largely independent from anthropogenic emissions, can also be used at
continental sites. The alpine station Sonnblick, located in the
lower free troposphere, has the advantage of giving access to
clean
air as well as polluted
air when the station
is influenced
by
boundary
layer air. The Alps are situated
between
areas
of major
pollution, in particular Munich and the Po Basin which affect the air masses arriving at Mount Sonnblick [Seibert et al., 1998]. The
objective
of this paper
is to analyze
CO and its isotope
variations
for this continental station.
2. Experiments
2.1. Station
The Sonnblick Observatory is located in the Austrian Alps
(47ø03'N, 12ø57'E) in a national park at the top of Mount Sonnblick (3106 m above sea level (asl)). The surrounding area
consists of a glacier to the south and a very steep 500 m drop to
the north. The nearest town, Zell am See (10,000 inhabitants.), is 40 km to the north. The larger cities Salzburg (150,000) in the northeast and Klagenfurt (100,000) in the southeast are about 125 km away. The observatory is nearly free from local pollution
sources. It was established in 1886, and some meteorological
records go back over 100 years. 2.2. CO and Isotopes Measurements
Air sampling for the CO isotopes started at Mt. Sonnblick in
September 1996. Usually, a sample was collected once every 2
weeks. This frequency has fluctuated due to the restricted access in case of bad weather. At times, duplicates were collected and on
several occasions sampling was repeated over 1 or more days.
One hundred five samples were collected and analyzed, of which
37 were duplicates or repeated samples. In the next sections the
total number of samples refers to 68; duplicates and repeated
samples are not counted in the statistics.
Air is collected, via a 10 m, V2 inch diameter PFA line, by a modified three-stage RIX oil-free piston compressor [Mak and
Brenninkmeijer, 1994]. The sample is dried at the inlet (Drierite),
and the overall contamination of the system is less than 1 ppb. In this paper we will use "ppb" to express molar fractions,
nmole/mole. For a typical sample, 600 L of air are collected
within 1 hour and compressed into aluminum cylinders of 5 L
volume (Scott Marrin, California). Time elapsed between
sampling and analysis is a few weeks, without significant change
in CO concentration.
The method used for the isotope analysis is based on the quantitative conversion of CO to CO2 [Brenninkmeijer, 1993; ROckmann, 1998; Brenninkmeijer et al., 1999, 2000]. The first step involves the complete removal of CO2, N20 and other
condensable gases by Russian doll traps at liquid nitrogen
temperature. The next step consists of the quantitative conversion
of CO to CO2 by Schtitze reagent (I205 on acidified silica gel). The
CO2 formed is trapped, and the amount of CO-derived CO2 is
manometrically determined with an absolute uncertainty of routinely less than 2% and a relative error below 1%. Finally, the
CO2 sample is assayed on a dual inlet mass spectrometer for the
determination of/5•3C and/5•80 with an uncertainty of less than 0.2 • and 0.4 •'00, respectively. The/5 notation stands for/5= (Rsa/Rst-
1) with R denoting the ratio considered (i.e., •3C72C or •O/'•O) for a sample (sa) or a standard (st). The reference standards are Vienna-PeeDee Belemnite (V-PDB) and Vienna-Standard Mean
Ocean Water (V-SMOW) for/5•3C and •5•O, respectively.
For analysis of the •C content, the CO2 is accurately diluted using a nearly •4C free gas and then submitted for Accelerator Mass Spectrometry. The Vienna Environmental Research Accelerator (VERA) laboratory provided most of the •4CO results reported here. Additional analyses were performed in the
Jkngstr6m
laboratory
(University
of Uppsala,
Sweden)
and in the
Centre for Isotope Research (University of Groningen,
Netherlands). The •CO is determined with an overall uncertainty
of 2 to 3 % [Rom et al., 2000a].
To check the reproducibility of the measurement, at times a second air sample was collected within 4 hours. The differences
measured between the two samples depend on the reproducibility of sampling, storage, and analysis. Ten pairs were sampled at Sonnblick, and standard deviations calculated from the repeats were 2.1 ppb for CO, 0.1 •'00 for /5'3C, 0.3 • for /5•O, and 0.2 molecules cm -3 for •CO. These results confirm the good
reproducibility of the measurements [cf. Rom et al., 2000a].
GROS ET AL.: ISOTOPIC COMPOSITION OF CO AT MT. SONNBLICK 3181
conditions, these data also prove the low variability of CO over periods of several hours during background conditions.
2.3. Other Measurements
On each air sample collected, mixing ratios of methane (CI-h),
carbon dioxide (COO, nitrous oxide (N20), and sulfur hexafluoride (SF6) were measured [Bergamaschi et al., 2000c]. These gases can help to track the origin of the air masses. SF6 is entirely produced by human activities [Maiss et al., 1996; Maiss and Brenninkmeijer, 1998] and is a good indicator of polluted air.
Among the other parameters available for Sonnblick, we are especially interested in indicators of stratospheric air; namely, beryllium 7 (7Be), ozone (O3), and relative humidity (RH). Beryllium 7 is a cosmogenic radionuclide with a radioactive decay half-life of 53.3 days. It is mainly produced in the stratosphere, and values higher than 8 mBq m -3 in the lower troposphere are generally indicative of a stratospheric influence [Stohl et al., 2000, and references therein]. Daily filter samples were collected at Sonnblick by the Federal Institute for Food Control, Linz, Austria (W. Ringer, personal communication,
1999). Continuous measurements of 03 were performed by the
"Umweltbundesamt," Vienna, Austria. Finally, the meteorological parameters temperature, RH, wind speed and direction, and air pressure were provided by the Central Institute for Meteorology and Geodynamics.
2.4. Back Trajectories
Back trajectories were calculated using two methods. The Central Institute for Meteorology and Geodynamics (Vienna,
Austria) calculated 4-day back trajectories with the
"EUROPAMODELL" of the Deutscher Wetter Dienst (Fay et al., 1995). Further, we used the HYSPLIT 4.0 (Hybrid Single-Particle Lagrangian Integrated Trajectory) program from the National Oceanic and Atmospheric Administration (NOAA) to calculate 10-day back trajectories (Draxler and Hess, 1997). When calculating trajectories with both methods, we found a good
agreement.
quite different origin. After a careful examination of CO and isotopes measurements and of the available supplementary data, we classified all samples in four different categories:
Background air is free tropospheric air originating from the mid-latitudes of the Northern Hemisphere. It is difficult to construct rigid criteria for selecting air samples representing background conditions. Typically, background air represents air
that had not been recently affected by one of the following three
sources (subtropics, pollution, stratosphere). The backward
trajectories corresponding to the selected background samples
supported this classification, indicating an origin of the air masses in the latitude range 35øN - 65øN.
Subtropical air is air from low latitudes. These samples were
characterized by low values of 14CO, CO, and fi•80.
Polluted air is air partly originating from the boundary layer. These samples were identified based on their simultaneously
elevated CO and •5•80 values.
Stratospheric air is air that had a recent contact with the
stratosphere or air which was affected by a stratospheric intrusion.
The corresponding signature is a concomitant elevation of •4CO,
7Be, and 03 values combined with low RH.
One sample (August 22, 1997) was excluded from the study due to local contamination (high CO and high •5•O corresponding
to a diesel generator start at the station [Rom et al., 2000b].
Finally, four samples showing unexpectedly high values of •4CO without concomitant elevation of •Be and 03 and therefore a priori
not linked to stratospheric influence were not classified in the four previous categories. One of them, collected on November 12, 1998, was likely due to human error. The three others are
associated with quite high CO and high •5•O suggesting polluted air from the boundary layer. We do not explain the high '4CO
associated to these samples; however, one cannot rule out the
possible effects of nuclear power plant emissions. Nevertheless,
very little information is available concerning emissions of •4CO
by the nuclear power industry.
4. Background Air
2.5. 3-D Modeling
Data for CO, •13C, and ;5•O are compared to the output of a
three-dimensional atmospheric transport model TM2 described by Bergamaschi et al. [2000a, 2000b]. The horizontal resolution of the model is 8 ø latitude by 10 ø longitude. The strengths of the sources used in the model were calculated using an inversion technique. The model uses the "a priori" contribution of each source and determines the corresponding distribution of CO. By comparing calculated and observed distributions, the inversion determines the "a posteriori" contribution of each source. Bergamaschi et al. [2000a, 2000b] have used different scenarios in order to test the sensitivity of the model to several parameters.
We have extracted the model data of the base scenario S2 for the
Sonnblick station.
3. Results and Discussion
The measurements are presented in Figure 1 for the whole period (September 1996 to August 1999). The striking feature is,
except for •5•3C, the large scatter observed. The first task is to identify the main processes causing this high degree of variability. Sonnblick's location at more than 3000 m altitude, well above the
boundary layer height, should see background tropospheric air at
most times. However, the scatter observed indicates air masses of
4.1. Seasonal Variations
The results of the background data, which represent nearly 50% of the whole data set, are given in Figure 1 along with a curve fitting and results from the TM2 model [Bergamaschi et al., 2000a, 2000b]. The curve fitting was calculated by applying a low-pass convolution filter [JOckel, 2000]. Sensitivity tests were performed to determine the adequate filter time window using 1, 2
or 4 weeks. We selected a 2-week time window; nevertheless, one
should keep in mind the uncertainty associated with the minimum and the maximum of the curve fitting, due to the few corresponding data points. We estimated these uncertainties by
calculating the difference observed for the maximum and
minimum points for the different time window calculations. The
uncertainties are _+ 5 ppb for CO, _+ 0.5 Y,, for •5•O, _+ 0.3 Y,, for
•5'3C,
and _+
0.6 molecules
cm
-3
for •4CO.
As indicated
in Figure
1,
three data points have not been considered for the curve fitting of
CO and •5•80,
and
they will be discussed
separately.
The seasonal cycle of the background CO mixing ratio observed at Sonnblick has a minimum in summer of about 90 ppb and a maximum in late winter of about 160 ppb. This seasonal variation is mainly controlled by the seasonality of its main sink, that is, OH oxidation, OH concentrations being maximum in
summertime. No significant interannual variation can be
3182 GROS ET AL.' ISOTOPIC COMPOSITION OF CO AT MT. SONNBLICK 25O 200 150 100 5O -22 -24 • -26 -3O J j J 1996 1997 1998 1999
Figure 1. Complete data set of CO and isotopes (14CO, •13C, •180) obtained at Sonnblick between September 1996
and August 1999. The label J indicates January 1 of each year. Open triangles stand for background data; solid
squares represent three outliers which are not taken into account in the curve fitting of CO and •5•80 (see text).
Curve fittings (solid line) and results of the 3-D model TM2 (dotted line) are also represented. Solid triangles stand for nonbackground data.
As the model calculations from Bergarnaschi et al. [2000a] are
based on meteorological data from 1987 and CO observations
from 1993 to 1995, they can only give a typical seasonal cycle. Results of the TM2 model vary from 75 ppb in summer to 165
ppb in winter. These values are slightly lower than the
observations for summer and fall, but actually the agreement with the observations is quite good, especially when considering the coarse grid of the model as well as the uncertainties associated with the curve fitting. We also want to point out here that we
compare two curves using different criteria because the model calculations take into account all kinds of air masses, whereas our background signal excludes all data affected by pollution, subtropics, and stratosphere. However, we suggest that our
background curve is, within the uncertainty, a good representation
of the annual mean signal and therefore that it is adequate to
compare
it with model
outputs.
This assumption
is consistent
with
the fact that almost the same number of subtropical and polluted
events are observed (see section 2) and that their opposite effects
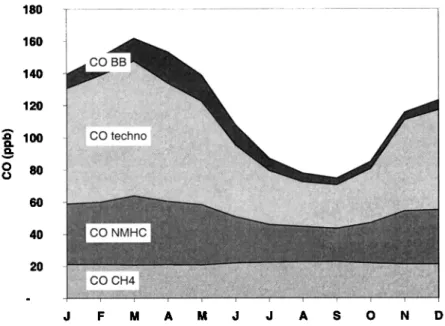
on CO and isotope compensate, at least partly, each other. The contributions of the different CO sources derived from the model results are presented in Figure 2. Fossil fuel combustion contributes about 35% in summer and 50% in winter to the total
CO. In contrast, the contribution from methane oxidation peaks in
summer (30%) and decreases in winter (15%). The nonmethane
hydrocarbon
oxidation
source
has a constant
contribution
of 25 to
30% over the year. The contribution from the biomass burning source, 8% in yearly average, is at a maximum between April and June. We compared this partitioning of CO sources with those
GROS ET AL.: ISOTOPIC COMPOSITION OF CO AT MT. SONNBLICK 3183 180 160 140 120 100 80 6O J F M A M J J A S O N D
Figure 2. Contributions of CO sources to total CO according to TM2 model results.
from different stations of the Northern Hemisphere (Alert, 82øN;
Cold Bay, 55øN; Tenerife, 28øN; Barbados, 13øN; Christmas Island, 2øN) [Bergarnaschi et al., 2000a]. We note that the fossil
fuel contribution is almost the same (35% on annual average) for
the mid and high latitudes of the Northern Hemisphere, whereas this contribution is significantly lower in the tropics (25% and 15% on annual average for Barbados and Christmas Island,
respectively).
The CO mixing ratios may be compared with results from the
Zugspitze,
another
alpine
station
(47øN, 11øE,
2962 m asl, at 150
km distance from Sonnblick), where CO has been monitored since1990 [Scheel et al., 1998]. Despite the high degree of variability observed at the Zugspitze, there is a good agreement. A comparison between Sonnblick and Zugspitze is given in Figure 3
for 1997. Except for the sample collected on April 24, which is
one of the three outliers to be discussed later, we note the
excellent agreement between the two data sets. Thus specific events of low CO (corresponding to clean air from southern latitudes, see section 2a) or high CO (corresponding to polluted
air from the boundary layer, see section 2b) are captured nearly
simultaneously by the two stations; large-scale advection yields similar trace gas variations at the two high-altitude alpine sites.
For Mace Head (Ireland, 53øN), Derwent et al. [1998] have
determined a seasonal cycle of CO representative of "Northern
Hemisphere
Mid Latitudes Background
(NHMLB)" with a
maximum in April of 160 ppb and a minimum in July-August of
90 ppb. These variations are in good agreement
with the
background
CO at Sonnblick,
although
the two stations
have
320 270 220 •,• 170 0
e
*
i .ZUGSPITZE
I
ß $ß ß ß t IDSONNBLICK.t
IPolluted air I 120 70ISubtropical
air]
• ß
J F M A M J J A S O N D dateFigure 3. CO measurements at Sonnblick and Zugspitze in 1997. During the pollution event observed on
3184 GROS ET AL.: ISOTOPIC COMPOSITION OF CO AT MT. SONNBLICK
different characteristics (boundary layer of the western extreme of
Europe for Mace Head versus lower free troposphere of central
Europe for Sonnblick). The similar signals derived from these two sites confirm the assumption that our "background" cycle
observed at Sonnblick is reasonably representative of the midlatitudes of the NH troposphere.
The NOAA/CMDL sampling site in Hungary (47øN, 16øE, 240
m asl)
is one
of the
few locations
in continental
Europe
where
CO
is measured in the boundary layer. Despite a high degree of variability in the measurements, a significant seasonal cycle can be discerned with lowest values of 100 ppb observed in summer
and up to 500 ppb found in winter [Novelli et al., 1998]. The amplitude observed, about 3 times larger than the background
signal derived at Sonnblick, reflects the effects of local and regional pollution.
The shape of the/5'80 seasonal cycle is similar to that of the
CO cycle, with a maximum of 7 to 8 • in winter and a minimum
of-2 to 0 • in summer.
This cycle is mainly controlled
by two
factors, one of which is the OH seasonality. The '80 kinetic
isotope effect of approximatly -10 • leads to a preferential removal of the C•80 isotopomer inducing a/5280 minimum near the maximum in OH. The effect is enhanced by the winter
maximum in the relative contribution from the fossil fuel
combustion source, which is a source with a/5280 value of +23.5 Y0•
[Stevens et al., 1972; Brenninkmeijer, 1993] and the main CO
source in the midlatitudes of the NH [Bergamaschi et al., 2000a].
Comparing the /5•80 data to model results shows generally good agreement (Figure 1), with model results varying from-1• in summer to 7 • in winter. Model calculations are slightly lower
than the observations between September and March. As modeled
CO mixing ratios are also lower than the observations (see
above), this suggests that the technological source is slightly
underestimated in the model for the fall period.
The measured/5'3C signal does not show much scatter, and the annual average is-27.1 _+ 1.5 •. Two samples, with a •5•3C value of-22•, are considered as outliers and no explanation can be given. Like CO and /5'80, the /5•3C seasonal cycle has also a
minimum (-30• to -29•) in summer, but here the maximum
(around -25 •) is slightly delayed toward spring. This shift of about 1 month is due to the fact that the major sink and source
effects are not in phase. Concerning the sources, the most significant effect comes from the methane oxidation source which
is very depleted
in •5•3C
(presumably-52• [Brenninkmeijer,
1993]) and thus leads to lower/5•3C in summer. In contrast, the '3C KIE in the sink reaction (2 • at 500 hPa and 5 • at 1000 hPa) causes an increase in •3CO in spring and summer [Smit et al.,
1982; Stevens and Wagner, 1989]. Thus in spring, when fossil fuel combustion sources are still important and when OH begins
to increase,/5•3C increases and reaches its maximum. In summer, despite persistent high levels of OH, the source effect, linked to
the very depleted methane oxidation source, predominates, and •5•3C reaches a minimum [Brenninkmeijer, 1993].
Modeled/5•3C presents a seasonal cycle with a maximum in May (-25.5 •) and a minimum in September (-29.5•), in good
agreement with the observed cycle. The model captures well the
shift of the maximum from winter to spring; however, it also slightly shifts the minimum from August to September, which is not observed in the measurements. The highest discrepancy between model and data is observed between January and April, when model calculations are lower than the observations by 1.5500.
Carbon monoxide 14 displays a seasonal cycle similar to CO
with a winter maximum of 20 molecules cm -3 and a summer minimum of 8 molecules cm -3. On the basis of the CO source
contributions obtained by the model, we can calculate the
contribution of "recycled" •4CO. Knowing that sources emitting
recycled •4CO, that is, hydrocarbon oxidation and biomass
burning, have the equivalent of 0.038 •CO molecules cm -3 per ppb CO [Brenninkmeijer, 1993], we calculate that recycled CO contributes about 28% of total •CO in summer and only 15% in
winter.
As the main source of •CO is cosmogenic and hardly exhibits a seasonal cycle, the observed seasonal variation is mostly controlled by the OH sink [Volz et al., 1981]. The existing observations showed that '•CO has a strong latitudinal gradient in the NH, with values increasing with increasing latitudes. The
range of concentrations measured at different stations is: 10-25 molecules cm -3 at Spitzbergen, 79øN (T. Rrckmann et al., manuscript in preparation, 2000), 7-17 molecules cm -3 at Izafia, 28øN (M. Br•iunlich et al., manuscript in preparation, 2000), 5-10
molecules cm -3 at Barbados, 13øN [Mak and Southon, 1998]. The results of 8-20 molecules cm -3 observed at Sonnblick, 47øN, are in
the expected range. This gradient is due to the OH distribution, with higher values in the tropics than in the polar regions, and due to the latitudinal effect of the source as '4CO production rates also depend on latitude, with highest values north of 60øN
[Lingenfelter, 1963; Jrckel et al., 1999].
4.2. Interannual Variations
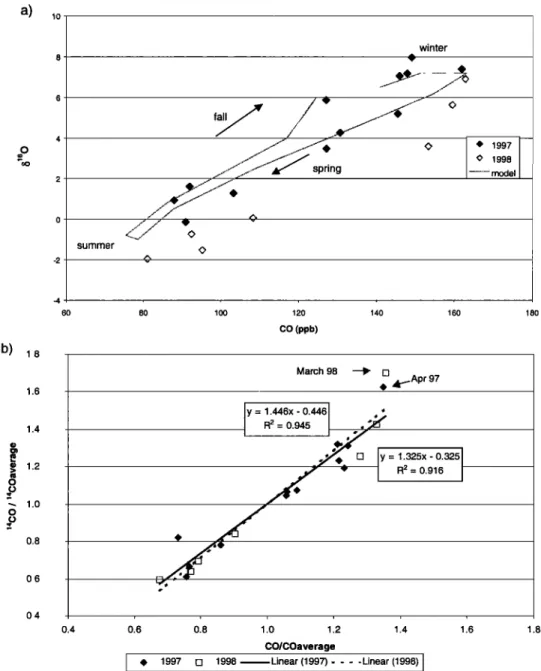
/5•80 and •CO are plotted against CO in Figures 4a and 4b for
1997 and 1998 (1996 and 1999 are incomplete and therefore not presented), including model results for C•80. In Figure 4a we note the following:
1. For each year we observe an ellipsoid-shape curve which is well reproduced by the model. It shows that the transition from winter to summer and from summer to winter are slightly
different. For a given value of CO, •5•80 is higher by 2?'00 in fall
than in spring. The structure observed here is due to a small phase shift of the seasonality of CO and C•80 sources and sinks.
2. For a given value of CO, •5•80 is lower by 1• in 1998. If this
difference were due to a sink effect, this would imply significantly higher concentrations of OH in 1998. A calculation with a box model, assuming a OH concentration of 10 ø molecules m -3, shows that the increase in OH should be about 15% to explain a 1•'00 decrease of/5•80. However, as interannual variations in OH concentrations are expected to be only about 0.5 % [Krol et al.,
1998] and as no major atmospheric changes have been reported
either, this hypothesis is not realistic. Thus a change in CO sources must have occurred between these 2 years.
Lower/5•80 for an identical CO value, or conversely higher CO for an identical/5•80 value, points to different contributions of the
CO sources for the years considered. Among the different sources of CO, biomass burning is the one most likely to have led to this
change of CO composition. Indeed, this source, which is known
to significantly fluctuate from one year to another [Cooke et al., 1996], has been reported to be especially intense in the tropics in late 1997-early 1998 [Levine, 1999]. As biomass burning is a source moderately enriched in C•80 and as Sonnblick is located far away from the source regions, the long time of transport/mixing leads to the removal of proportionally more C•80
than C•60 (for a reduction to l/e, a 10•'00 depletion occurs). This
assumption is consistent with the observations at Izana (28øN)
which present the same feature of lower /5'80 (for a same CO
value) in 1998 compared to 1997 (M. Br•iunlich et al., manuscript in preparation, 2000).
In Figure 4b, •CO and CO have been normalized to compare their relative seasonal change. The near linear relationship
GROS ET AL.' ISOTOPIC COMPOSITION OF CO AT MT. SONNBLICK 3185
a)
•o
o 1.6 1.4 1.2 1.0 0.8 0.6 0.4 -4 60 summer winterß 1997
c, 1998
... model 80 1 O0 120 140 160 CO (ppb) 180 March 98 --• []ß •....Apr
97
y = 1.446x
- o.4461
, ß
,*. _ ß R 2 = 0.916 0.4 0.6 0.8 1.0 1.2 1.4 1.6 1.8 CO/COaverage ß 1997 [] 1998Linear
(1997)
.... Linear
(1998)
Figure
4. (a) •5•O
and
(b) '4CO
plotted
versus
CO for 1997
and 1998.
Most
of the 1998
data
were
taken
in spring
and summer.
indicates that both seasonal cycles are mainly driven by the OH seasonality [Volz et al., 1981]. However, the slopes of 1.3 and 1.4 observed for 1997 and 1998, respectively, show that ]4CO seasonal gradients are considerably stronger. Therefore the sinks and sources have to be considered in more detail. The reaction rate in the main sink, CO + OH, is slightly lower for ]4CO. If it is
assumed that the fractionation for •3CO averaged over the pressure
range of the troposphere is 3 %o, the concomitant fractionation for •4CO is 6 %0. Thus the rate of removal of •4CO is 0.6 % slower [Brenninkmeijer et al., 1999], and this cannot explain the large
difference shown in Figure 4b. Concerning the source effect, for
•4CO the import from the stratosphere peaks in spring, and this
will indeed lead to a steeper slope in Figure 4b. The elevated •4CO levels observed in April 1997, and March 1998 may be indicative of this. There are also seasonal changes in CO sources. In summer the input of CO from the oxidation of methane and nonmethane hydrocarbons increases. This implies that during summer, the CO
inventory may not decline as rapidly as the •4CO inventory. The
fact that when CO is produced from biogenic sources, also some
'4CO is produced is of minor importance because of the low
content of biogenic CO compared to the atmospheric mix. Finally,
we conclude that both CO and •4CO seasonal cycles are mainly
driven by OH but that the CO minimum is partly offset by the
increased summer sources.
There is little difference between the years 1997 and 1998 in Figure 4b. It is not expected that increased CO from biomass
burning in the tropics, which is concluded form the •5•aO data
would affect the •4CO/CO relationship significantly. Another conclusion is that the stratosphere-troposphere exchange for the 2 years most likely has not been very different.
4.3. CO and •5•sO Outliers
As mentioned before, CO and •5•aO were unexpectedly low for
3186 GROS ET AL.: ISOTOPIC COMPOSITION OF CO AT MT. SONNBLICK
Table 2. Results of CO and 15180 for the Three Outliers (See Text).
CO
Observed Residual' Observed Residual'
Feb. 18, 1997 139 ppb - 15 ppb 6.4 Y. - 1.3 Y.
April 24, 1997 129 ppb - 29 ppb 4.2 Y. - 2.8 Y.
Feb. 2, 1998 130 ppb - 26 ppb 4.5 Y. - 2.5 Y.
ß Residual represents the difference between the observed value and the background value, as defined by the curve fitting.
and April 24, 1997, and February 2, 1998. The corresponding
deviations from the background level are listed in Table 2. Coincident low values of CO and /5•80 can have two origins: either transport from southern latitudes, or transport from the
stratosphere. The last hypothesis is unlikely because observed
•4CO values are not elevated. To explain these events, we propose that air advected from southern latitudes was sampled, with low
CO, low /5•80 and low •4CO. This hypothesis is consistent with
CI-h results, which show relatively low values (1794 ppb, 1784
ppb, 1788 ppb) in agreement with the latitudinal gradient of this compound [Dlugokencky et al., 1994]. The air has then traveled through the upper troposphere and has reached higher latitudes, as
confirmed by trajectories which show (for April 24, 1997 and February 2, 1998) that the air was at 65øN-70øN four days prior to
the arrival at Sonnblick. The low RH of 30% associated with the
three samples also is consistent with transport through the upper
troposphere. Further, we conclude that the air mass has entrained
some additional •4CO at high altitude, the upper troposphere being enriched in •4CO compared to the lower troposphere
[Brenninkmeijer and Rtckmann, 1997]. Other compounds having
a significant positive vertical gradient in the troposphere, like 7Be or O3 [Zanis et al., 1999; WMO, 1999, and references therein] would also be enriched by such a mixing, which is confirmed by
high 7Be for two of the three samples. The high variability of 03
does not allow one the use of this tracer for these events.
Concerning CO, which has lower values in the upper troposphere
than in the lower troposphere in the high latitudes of the Northern Hemisphere [Herman et al., 1999], the mixing of southern latitude air with polar upper tropospheric air would have kept CO at low
levels.
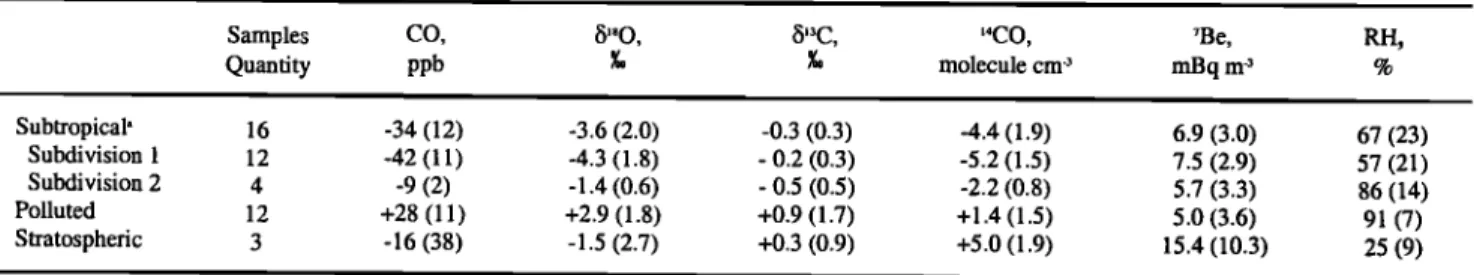
5. Nonbackground Air
For the three categories of non-background air, namely,
"subtropical,"
"polluted,"
and "stratospheric,"
we have calculated
the corresponding "residual" values and all signatures for each
sample. The residual value is defined as the difference between the sample value and the corresponding background curve value. Table 3 gives the different results for CO and its isotopes along
with results for 7Be and RH. Note that when repeated samples were taken within a short time, only the sample most
characteristic of the event, that is, associated with the highest residual absolute value, was taken into account in the statistics. The results for the different categories will be discussed in the following sections. The absence of a/5•3C specific signature can partly be attributed to its quite homogeneous distribution in the middle and high latitudes of the Northern Hemisphere. Indeed, the difference of the /5•3C minimum and maximum annual levels
observed between 79øN and 28øN are at most 2 • to 3 • (T.
R0ckmann et al., manuscript in preparation, 2000; M. Braunlich et al., manuscript in preparation, 2000). Therefore the gradient
observed between Sonnblick and other NH locations is at most 1 • to 1.5 •.
5.1. Subtropical Air Masses
The observations of concurrent low CO, low/5•80 and low •4CO are most likely related to air mass transport from southern
latitudes. The lower values of CO and /5•80 reflect both the
remoteness from the technological sources of CO (enriched in
C'aO) and the sink effect, the strength of which increases with
decreasing latitude, following the OH latitudinal gradient. As
mentioned above, lower •4CO associated with lower latitudes is due to the combined effects of more OH and less cosmogenic
•4CO. We also note that during these events, CI-I4 and SF6 were
significantly lower than the background level supporting a low
latitude origin of the sampled air masses.
Sixteen samples (24% of the total) fall in this subtropical
category and were taken between December and June. Table 3
summarizes the characteristics of the data belonging to this subtropical category. Compared to background levels, the results are lower by 32 ppb for CO, 3.5 • for/5•80 and 4.4 molecules cm -3
Table
3. Residuals,
Representing
the
Deviation
From
the
Background
Signal,
Calculated
for CO,/5•80,/5•3C,
and
14CO
for
the Different
Categories,
Subtropical,
Polluted
and
Stratospheric.
Samples CO, /5'80, /513C, 14CO, 7Be, RH,
Quantity
ppb
Y,,
Y•
molecule
cm
-3
mBq
m
-3
%
Subtropical"
16
-34 (12)
-3.6
(2.0)
-0.3
(0.3)
-4.4
(1.9)
6.9 (3.0)
67 (23)
Subdivision
1
12
-42 (11)
-4.3
(1.8)
- 0.2 (0.3)
-5.2
(1.5)
7.5 (2.9)
57 (21)
Subdivision
2
4
-9 (2)
-1.4
(0.6)
- 0.5 (0.5)
-2.2
(0.8)
5.7 (3.3)
86 (14)
Polluted
12
+28
(11)
+2.9
(1.8)
+0.9
(1.7)
+1.4
(1.5)
5.0
(3.6)
91 (7)
Stratospheric
3
-16
(38)
-1.5
(2.7)
+0.3
(0.9)
+5.0
(1.9)
15.4
(10.3)
25 (9)
"Subtropical
data
1 and
2 represent
the
subdivisions
described
in text.
Corresponding
averages
of 7Be
and
relative
humidity
(RH)
are
also
given.
GROS ET AL.: ISOTOPIC COMPOSITION OF CO AT MT. SONNBLICK 3187
SONNBLICK
ß Subtropical
event
1840 1820 1800 1780 375 - 374 373 372 371 37O 369 200 - 190 180 170 160 150 140 130 120 I 110 ,
30.03.99
31.0•3.99
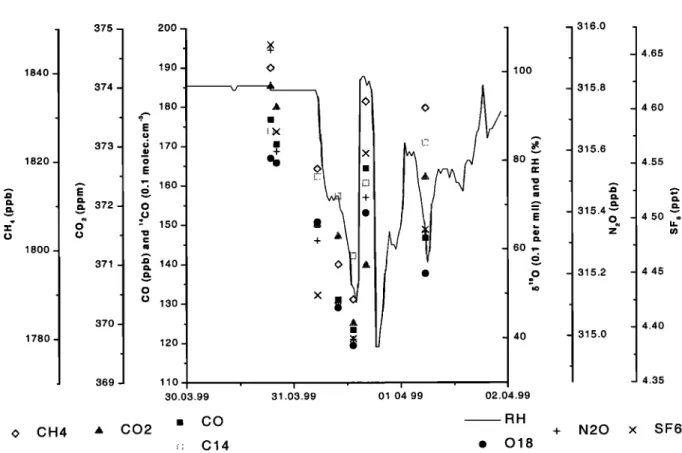
o lOO 80 E 60 ,- O 4O I 01.04.99 02.04.99 - 316.0 315.8 315.6 315.4 315.2 315.0 ß co RH o CH4 ,• CO2 + N20 x i:::.• C14 ß O18 4.65 4.60 4.55 4.50 ,. 4.45 4.40 4.35 SF6Figure 5. Subtropical
air observed
on March 31, 1999. with corresponding
values
of CO, •4CO,
•5•80,
CI-h, CO2,
N20, SF6, and relative humidity (RH).
for '4CO. However, there is a large scatter between the results, with the residual value of CO ranging from -6 to -60 ppb. Four samples were associated with relatively small residuals of-9 ppb
for CO,-1.4 • for •5•80 and -2.2 molecules cm -3 for 14CO
(subcategory 1 of Table 3). The high RH values (86% on average)
associated with these four samples suggest that some air from the boundary layer has been injected during the transport, partly masking the original signature of the air mass (increase in CO and C•80). In contrast, a large part of the samples (subcategory 2 of
Table 3) show large residuals of-42 ppb for CO, -4.3 Y. for •SlaO
and -4.2 molecules cm -3 for laCO. The low signatures in CO and isotopes of these data show that very clean air from low latitudes (south of 30øN) was sampled.
Most of the corresponding back trajectories confirm that air masses are coming from latitudes south of 35 ø , mainly from the
Atlantic Ocean and some from Africa. Note that 7Be and RH
present medium values, 6.9 mBq m -3 and 67%, respectively, consistent with transport through the lower free troposphere, with little recent input from boundary layer air.
To better illustrate the events of very clean air from subtropical latitudes, we present in Figure 5 the results of repeated samples of March 30-31, 1999. CO and isotope results are given along with CH4, CO2, N20, SF6, and RH to trace the air mass origin. The first two samples (March 30, 1900 UTC and 2015 UTC) present
'normal' values of CO and t5•80 and slightly low values of •4CO.
These samples are associated with high RH, suggesting transport of air from the boundary layer. This would explain the relatively
high CO and •5•80 values compared to 14CO measurement, as this
last compound is not affected by pollution (see next section).
At 400 UTC on March 31, RH suddenly drops, as do CO, (5•80, •4CO, and other gases, indicating a change of the air mass origin.
The lowest value of RH (48%) was reached at 1300 UTC, and the
trace
gas measurements
also
yielded
minimum
values.
Compared
to the first sample, the values have dropped by 54 ppb (CO), 4.2 g.
(tS'•O),
3.2 molecules
cm
-3 (•4CO),
52 ppb
(CH4),
4 ppm
(COO,
0.9
ppb (N20), and 0.26 ppt (SF6), suggesting that we are now sampling air from southern latitudes that had not been in contact with the boundary layer.
We compared these values with observations made during the
same period (March 26, 1999) at Izafia (28øN) for CO and
isotopes as well as for CH4, CO2, N20 and SF6 (M. Br•.unlich,
personal communication, 2000). The results from Izafia were 126
ppb (CO), 5 • (•5•aO), 15.5 molecules cm -• (14CO), 1799 ppb (CI-h),
370.0 ppm (CO2), 4.42 ppt (SF6), and 314.8 ppb (N20) which
compare well with our observations of 123 ppb (CO), 3.8 • (•SlaO)
14.2 molecules
cm
-3 (•4CO),
1789
ppb (CH4),
370.0
ppm (CO2),
4.39 ppt (SF0, and 315.0 ppb (N20) during this event. The good agreement between the two data sets suggests that the air sampled at Sonnblick has traveled from northern Africa with no significant mixing with other air masses. Obviously, even in a region dominated by zonal flows, meridional transport can take place, and the typical signature of an air mass from 30øN can be observed at 50øN some days later.
After the minimum observed at 1300 UTC, RH suddenly increases to a value of 100% within 1 hour. Samples taken at 1615 UTC reflect the last change in the air mass origin with values only slightly lower than those observed at the very beginning of the event. Note the considerable variability observed
3188 GROS ET AL.' ISOTOPIC COMPOSITION OF CO AT MT. SONNBLICK
a)
ILl o o oNOAA AIR RESOURCES LABORATORY
Backward trajectory ending at 18 UTC 30 Mar 99 FNL Meteorological Data
700
•
900
b)
LLI
NOAA AIR RESOURCES LABORATORY
Backward trajectory ending at 12 UTC 31 Mar 99 FNL Meteorological Data
.... .
,
/
900
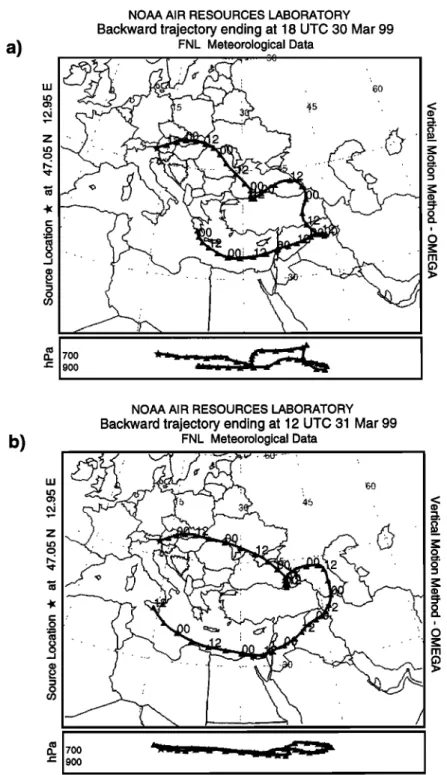
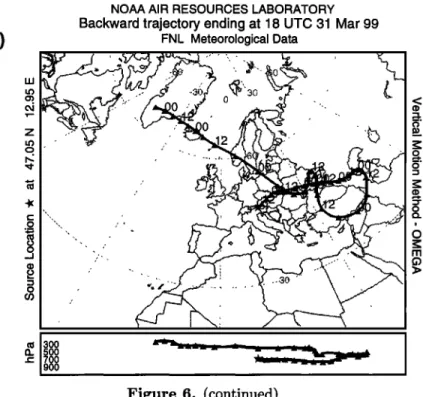
Figure 6. Ten-day backward trajectories for 1999: (a) March 30, 1800 UTC, (b) March 31, 1200 UTC, and (c) March 31, 1800 UTC. The trajectories were calculated with the Hybrid Single-Particle Lagrangian Integrated Trajectory (HYSPLIT4) model, 1997 (Web address: http://www.arl.noaa. gov/ready/hysplit4.html, NOAA Air Resources Laboratory, Silver Spring, Maryland).
on a very short
timescale.
Within 3 hours
(with the RH change
suggesting
that it could
be as short
as 1 hour),
CO increased
by 41
ppb, •i•O increased
by 3.0 •, and •4CO increased
by 1.9
molecules
cm
'3. Finally, the sample
taken on April 1 presents
intermediate
values,
similar
to those
observed
on the morning
of
March 31.
The 10-day back trajectories
corresponding
to this event are
presented in Figure 6 and confirm the features described above.
On March 30, 1800 UTC (Figure 6a), transport
from the south
east with recent influence from the boundary layer is observed.
Then, on March 31, 1200 UTC (Figure 6b), the air comes from southern latitudes through the free troposphere, with the lowest latitude of 30øN reached 8 days before. Finally, on March 31,
1800 UTC (Figure 6c), air is originating from northwest.
From the measurements, meteorological data, and trajectory calculations, we conclude that Mt. Sonnblick was in a zone of transition between a flow of humid air in lower layers and a flow of relatively dry air from the east, with origin from southern latitudes, at higher levels. At the beginning, the lower flow was in
GROS ET AL.' ISOTOPIC COMPOSITION OF CO AT MT. SONNBLICK 3189
c)
o o _.1 oNOAA AIR RESOURCES LABORATORY
Backward
trajectory
ending at 18 UTC 31 Mar 99
FNL Meteorological Data
, ' ' .
•300
•
•- • ....
700 900Figure 6. (continued)
ground emission sources, while later on there was no more contact with surface air. During the morning hours, when RH dropped to values near 50%, the flow in the upper layer
originating from low latitudes had dominated at Sonnblick
observatory, whereas during the afternoon, thermal convection
must have caused updrift from the boundary layer. Finally during the evening, Sonnblick was no more influenced by boundary layer
air.
5.2. Polluted Air Masses
Twelve samples (18% of the total) were affected by polluted
air from the boundary layer. We identified these events based on
their coincident high CO and 15'80 results, with average residual
values of +28 ppb for CO (with a minimum of +5 ppb and a
maximum of +47 ppb) and +2.9 g• for 15'80 (with extremes values of +0.01•'., and +6.8 •) (see Table 3). The high RH of 91%
observed during these events is consistent with air originating
from the boundary layer. The simultaneous enhancements of CO
and 15'80 are characteristic of the fossil fuel combustion source.
This source, representing emissions from transportation, industries, and heating, is located at the surface and causes the strong gradient of CO between the boundary layer and the free
troposphere observed over the continents [Roths and Harris,
1996]. It is important to note that •4CO results are not affected by the combustion of fossil fuel pollution (residual of +1.4 _+ 1.5 molecules cm -3) as expected from this source devoid of '4C.
Thus, although Sonnblick is generally located above the
boundary layer, the observatory is not isolated from emissions
occurring at the surface. Indeed, thermal convection and slope winds are known to bring air from the boundary layer to high elevation sites [Giiggeler et al., 1995; Baltenspergeer et al., 1997]. We note that half of the polluted events were observed in the summer months (July, August, and September) whereas no pollution events were found in winter months (January, February, and March). This seasonality reflects the degree of stability of the atmosphere, with greater vertical transport occurring in summer when the lower troposphere is less stable.
5.3. Stratospheric Air Masses
Carbon monoxide 14 constitutes a tracer of stratospheric air, as its mixing ratio is much higher in the stratosphere than in the troposphere [Brenninkmeijer et al., 1995; JOckel et al. 1999]. We
determined stratospheric influence at Sonnblick using this tracer, the threshold value being a residual value higher than + 3
molecules cm -3, in combination with the criteria defined by Stohl et al. [2000] for 7Be, 03, and RH. The corresponding thresholds were as follows: daily 7Be higher than 8 mBq m -3, daily minimum of RH lower than 30% and daily maximum of 03 at least 10%
above the monthly mean. Samples fulfilling at least three of the criteria were selected as belonging to the stratospheric category.
Analysis of the data shows that only three samples (March 10,
1997, November 15, 1997, and August 7, 1998), representing 4% of the total number of samples, have been affected by
stratospheric air. This frequency is lower than the one of 10% determined by Stohl et al. [2000] for Sonnblick; however, the
difference is statistically not significant considering the small
number of samples. Table 3 gives the characteristics of these data, which yield a positive residual value of + 5.0 molecules cm -3 for '•CO and a mean value of 15.4 mBq m -3 for 7Be. These data are
associated with lower CO and lower 15'sO than background values. This is in agreement with the study of Brenninkmeijer and
ROckmann [1997] who found lower values of CO and 15•O for the
stratosphere compared to the troposphere.
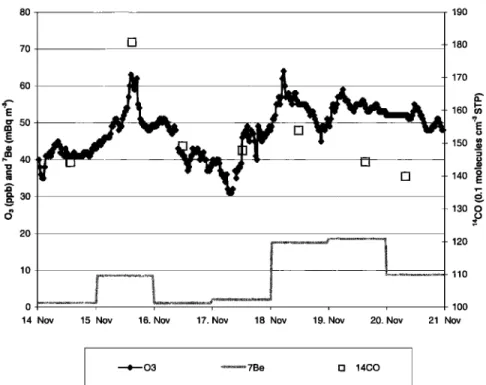
In November 1997 a sample was collected daily between the
15
th
and
the
20
th.
The
results
for •4CO,
03, and
7Be
are
presented
in
Figure 7. Samples taken on November 14, 16, and 17 show no
special feature and belong to the background category, with corresponding 03 levels ranging between 30 and 50 ppb. Air
sampled on November 15 is associated with a •4CO value more
than 20% higher than adjacent days, coincident with the
maximum of a sharp 03 peak, showing a stratospheric influence.
The corresponding CO and •5•O values are low, 110 ppb and 3.7•
respectively, confirming that the 03 peak is not resulting from photochemical formation in polluted air. The daily average of 7Be is 8.6 Bq m -3 while RH measurements are unavailable for this
3190 GROS ET AL.' ISOTOPIC COMPOSITION OF CO AT MT. SONNBLICK
80
[ 190
70
E]
180
170 60"'Eo
'
160
u•
•'
150
•
•30
•
•
130
O
20lO
•
0 10014. Nov 15. Nov 16. Nov 17. Nov 18. Nov 19. Nov 20. Nov 21. Nov
,* 03 ... 7Be El 14CO
Figure 7. Stratospheric event of November 15, 1997, with corresponding data of '4CO, 03, and 7Be.
period. Finally, a study based on the calculations of 5-day back trajectories and corresponding potential vorticity (PV) was performed for this specific sampling date (H. Cuijpers, personal
communication, 1999). It was found that about half of the 42
trajectories calculated inside a domain of 5 ø by 5 ø and 100 hPa
around Sonnblick were associated with PV values higher than 1.5 PVU. This confirms that stratospheric air, originating from high
qatitudes,
had reached
Sonnblick
on November
15. Additional
evidence was obtained from the measurements (03, 7Be, RH) at
the Zugspitze, which showed a very pronounced stratospheric signature (E. Scheel, unpublished data, 2000).
For November 18 to 20, stratospheric episodes are
characterized by O3 peaks coincident with high values of 7Be and
low RH. However, the samples taken on these days did not
coincide with the O3 daily maximum suggesting that these events
were probably short-lived episodes. The absence of a significant increase of '4CO confirms that we did not see stratospheric influence on those samples.
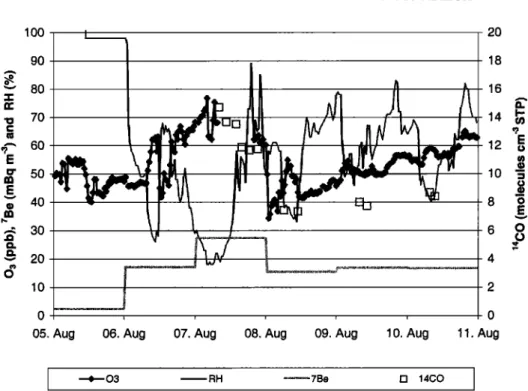
In 1998, repeated samples were collected between August 7
and 10. A stratospheric event occurred on August 7 in the early
morning when O3 peaked at 77 ppb (monthly mean: 53 ppb) and
RH reached a minimum of 18% (Figure 8). The daily value of 7Be
was exceptionally high at 27.3 mBq m -3, reaching the highest value observed during the 3 years studied (September 1996 to August 1999). An air sample collected a couple of hours after this event contained high levels of '4CO, with a residual value of +6
molecules cm -3. In contrast, CO and b'80, which are expected to
be low in stratospheric air, do show positive residual values of
+27 ppb and +1.5 •, respectively. Since these residuals are
calculated with respect to background levels, we can explain the discrepancy by a mixing of stratospheric air and polluted air from
the troposphere, which might have occurred in the vicinity of
Sonnblick. A previous study has shown that •CO in the
lowermost stratosphere of NH middle latitudes was about 60
molecules
cm
-3 [Zahn
et al., 2000].
A calculation
shows
that,
with
a background level of 8 molecules cm -3 in the troposphere (•4CO is not affected by polluted air, see previous section) and a residual of
+6 molecules cm '3, 11 to 12% of the air was of stratospheric
origin. If we assume a value of 60 ppb CO in the lowest stratosphere [Zahn et al., 2000], the required value of CO in the troposphere to match the mixing would be about 130 ppb. Such a value, 40 ppb above the background level, can easily be observed in air recently affected by pollution of the boundary layer, as shown in the previous section. Such mixing of air masses would also explain the positive residual of b•80 observed during this event. The samples taken during August 7 reflect a simultaneous decrease of '4CO and O3 combined with an increase of RH. On August 8, and the following days, all parameters, except 7Be which is still high, show values representative of the background atmosphere. The characteristics of this stratospheric event were quite different from the one in November. Indeed, an analysis of the trajectories along with PV values did not indicate any recent stratospheric influence (H. Cuijpers, personal communication,
1999). However, due to the high intensity of this event, we can
exclude stratospheric influence older than 5 days. We therefore suggest that this event reflects a strong stratospheric intrusion, probably too short to be captured by the trajectories and PV, which are based on 6-hour mean meteorological fields. This
intrusion event was not very localised since a similar sharp
stratospheric intrusion was also detected at the Zugspitze on the same day. Studies of atmospheric dynamics would be necessary to
understand the mechanisms involved in this specific event.
6. Summary and Conclusions
Presented is an analysis of the first combined time series of
CO, b•80, b•3C, and •4CO for a European continental station. The
choice of Sonnblick station, Austrian Alps, was motivated by its location well above the boundary layer, allowing sampling of air