HAL Id: hal-00330068
https://hal.archives-ouvertes.fr/hal-00330068
Submitted on 23 Dec 2005
HAL is a multi-disciplinary open access
archive for the deposit and dissemination of
sci-entific research documents, whether they are
pub-lished or not. The documents may come from
teaching and research institutions in France or
abroad, or from public or private research centers.
L’archive ouverte pluridisciplinaire HAL, est
destinée au dépôt et à la diffusion de documents
scientifiques de niveau recherche, publiés ou non,
émanant des établissements d’enseignement et de
recherche français ou étrangers, des laboratoires
publics ou privés.
Remote sensing of aerosols over the oceans using
MSG/SEVIRI imagery
F. Thieuleux, C. Moulin, Francois-Marie Breon, F. Maignan, J. Poitou, D.
Tanré
To cite this version:
F. Thieuleux, C. Moulin, Francois-Marie Breon, F. Maignan, J. Poitou, et al.. Remote sensing of
aerosols over the oceans using MSG/SEVIRI imagery. Annales Geophysicae, European Geosciences
Union, 2005, 23 (12), pp.3561-3568. �10.5194/angeo-23-3561-2005�. �hal-00330068�
Annales Geophysicae, 23, 3561–3568, 2005 SRef-ID: 1432-0576/ag/2005-23-3561 © European Geosciences Union 2005
Annales
Geophysicae
Remote sensing of aerosols over the oceans using MSG/SEVIRI
imagery
F. Thieuleux1,2, C. Moulin1, F. M. Br´eon1, F. Maignan1, J. Poitou1, and D. Tanr´e2 1IPSL/LSCE, CEA-CNRS, Gif-sur-Yvette, France
2LOA, CNRS-USTL, Villeneuve d’Ascq, France
Received: 23 May 2005 – Revised: 3 November 2005 – Accepted: 14 November 2005 – Published: 23 December 2005
Abstract. The SEVIRI instrument on board Meteosat
Sec-ond Generation (MSG) offers new capabilities to monitor aerosol transport over the Atlantic and the Mediterranean at high temporal and spatial resolutions, in particular, Saha-ran dust from North Africa, biomass-burning aerosols from subtropical Africa and pollution from Europe. An inver-sion technique was developed to estimate both aerosol op-tical thickness and Angstr¨om coefficients from SEVIRI mea-surements at 0.63 and 0.81 µm. This method relies on an optimized set of aerosol models to ensure a fast processing of full-resolution MSG images and to allow the processing of long time series. SEVIRI images for slots 45, 49 and 53 (11:15, 12:15, 13:15 UT) were processed for June 2003. The retrieved optical thicknesses and Angstr¨om coefficients are in good agreement with AERONET in-situ measurements in the Atlantic and in the Mediterranean. Monthly mean maps of both parameters are compared to that obtained with the polar orbiting sensor POLDER for June 2003. There is a good consistency between the two monthly means in terms of optical thickness, but the Angstr¨om coefficients show signifi-cant differences in the Atlantic zone which is affected by dust transport. These differences may be explained by the lack of specific non-spherical dust models within the inversion. The preliminary results presented in this paper demonstrate, nev-ertheless, the potential of MSG/SEVIRI for the monitoring of aerosol optical properties at high frequencies over the At-lantic and the Mediterranean.
Keywords. Atmospheric composition and structure (Aerosols and particles; Instruments and techniques)
1 Introduction
Aerosols contribute significantly to the Earth’s radiative bud-get, both directly and through interactions with cloud optical properties. Their concentrations must be monitored at the Correspondence to: C. Moulin
(cyril.moulin@cea.fr)
global scale to develop and evaluate climate models that take into account the impact of these airborne particles. Because of the strong variability of aerosol sources, distributions and optical properties, a monitoring at high spatial and temporal resolutions is needed. Satellites are well suited for this ob-jective (Kaufman et al., 2001). Several space-borne sensors dedicated to aerosol studies have been launched during the last decade, such as POLDER in 1996 and 2003 or MODIS in 1999 and 2001. Daily images of the METEOSAT VIS band were used to monitor almost ten years of African dust transport over the Atlantic and the Mediterranean (Moulin et al., 1997a). The images were first calibrated (Moulin et al., 1996; Moulin and Schneider, 1999) and a Look-Up Table (LUT) of TOA reflectances from radiative transfer simula-tions was used to retrieve the dust optical thickness with an accuracy of 25% (Moulin et al., 1997b and c).
This method was applied to the entire set of noon im-ages of the ISCCP-B2 archive between 1983 and 1997. This unequalled data set was used to generate the first monthly climatology of African dust loads over the Atlantic and the Mediterranean and to show that the intensity of dust export is closely related to climate parameters, such as the North Atlantic Oscillation (Moulin et al., 1997c; Chiapello and Moulin, 2002). The major shortcoming of this inversion method is that a single spectral band does not allow one to distinguish between various aerosol types and origins from their optical properties. As a consequence, the LUTs are based on a single aerosol model, whereas several types of aerosols are present in the marine atmosphere, each one with different optical properties.
The characteristics of the SEVIRI sensor on board MSG (this sensor will be hereafter referred to as MSG for sim-plicity), greatly improved from the previous Meteosat series, make it a well suited tool to study aerosols over the oceans and seas surrounding the African continent. Contrary to ME-TEOSAT, MSG has three narrow spectral bands in the solar spectrum (at 0.63, 0.81 and 1.64 µm), in addition to the wide HRV band, and combines thus somewhat the advantages of a multi-spectral sensor, such as MODIS or POLDER, with
3562 F. Thieuleux et al.: Remote sensing of aerosols over the oceans using MSG/SEVIRI imagery the frequency of METEOSAT measurements. In this paper,
we make use of the two solar bands at 0.63 and 0.81 µm to retrieve both the optical thickness and the spectral signature of the aerosols over the oceans. The results are evaluated against both sunphotometer measurements and another satel-lite product derived from a polar orbiting sensor.
2 Method
2.1 Radiative transfer computations
Over a cloud-free area, the signal measured in the solar spec-trum by a space-borne sensor is the sum of the light backscat-tered towards the satellite by the surface, the atmosphere molecules and the aerosols. The contribution of aerosols to MSG Top-Of-Atmosphere (TOA) reflectances is simulated in both 0.63 and 0.81 µm bands with the radiative transfer model 6S (Vermote et al., 1997) for various geometries and 15 different aerosol optical thicknesses at 0.55 µm (τ ). τ was varied from 0 for an aerosol-free atmosphere, i.e. with only molecular reflectance, to 2 for a very turbid atmosphere. The 6S model computes all orders of scattering by aerosols and molecules. It also accounts for gaseous absorption, which is mostly affected by O3, H2O and O2in the two MSG
spec-tral bands. The specspec-tral integration of reflectances over the satellite band is performed with a step of 2.5 nm.
Here we use the pre-defined US62 standard atmosphere, which includes an ozone column of 0.344 cm-atm and a wa-ter vapor column of 1.42 g cm−2. Note that a more
accu-rate correction could be done by using daily meteorological fields from numerical global models, as within most oper-ational processing (e.g. POLDER, MODIS, etc.). We used the other pre-defined atmospheres of 6S (i.e. tropical, mid-latitude summer and winter, and high-mid-latitude summer and winter) to verify that the use of the US62 model does not yield too much uncertainty to our retrievals. The mean error on the TOA reflectance at 0.81 µm, and thus also on the op-tical thickness, is of about 5%, with a maximum of about 7% difference with the tropical model. Errors are smaller (about 3 and 5%, respectively) at 0.63 µm. We also assume that the water is non reflecting in both bands, so that the surface con-tribution is only generated by specular reflection and affects the measurements only in directions close to the glint.
Aerosol optical properties over the Atlantic and the Mediterranean may vary widely depending on the size dis-tribution and refractive index of the particles, which, in turn, depend on the source and nature of the aerosols. The Angstr¨om coefficient (α) is an optical property that can be used as a proxy for the aerosol size distribution. It is com-puted from the spectral variation of τ between two wave-lengths and is large (up to 2.5) for very small aerosols, like sulfates from polluted areas, and is low (≈0) for aerosols containing large particles as desert dust. Here we define α from the ratio of the retrieved optical thicknesses at 0.63 and 0.81 µm. Both insitu and satellite measurements in the Mediterranean have shown that the Angstr¨om coefficient
computed in the visible Spectrum varies roughly between 0 and 2 (Holben et al., 2001; Jamet et al., 2004). Fifteen aerosol models with an Angstr¨om coefficient ranging from −0.1 to 2.4 were thus used to compute TOA reflectances and to build the LUT. These 15 models include the 12 models developed for the atmospheric correction of SEAWIFS im-agery (Gordon and Wang, 1994; McClain et al., 2000). They have a bimodal size distribution with variations of the re-spective proportions of the troposheric (small particles) and oceanic (large particles) modes of Shettle and Fenn (1979), and the relative humidity, which mostly modifies the mean radius of the two elementary modes. Since this set covers the Angstr¨om coefficient up to 1.5 only, it was complemented with three additional models of very small particles to cover the range 1.8–2.4. Table 1 provides details on each aerosol model.
A LUT of TOA reflectances at 0.55 µm, as well as for the two MSG shortwave bands (0.63 and 0.81 µm), was com-puted with 6S for the 15 aerosol models, for 15 aerosol op-tical thicknesses and for about 110 000 different measure-ment geometries: 48 values for both solar zenith angle θSand
viewing zenith angle θV (varied between 0◦and 90◦using a
Gaussian quadrature), and 49 values for the relative azimuth angle 1φ between 0 and 180◦. A useful property of the se-lected aerosol model set is that the simulated reflectances increase continuously from the largest to the smallest size distribution for a given optical thickness, regardless of the wavelength or the viewing geometry. As shown by Gordon and Wang (1994), this feature strongly speeds up the search for the most suitable aerosol model, because it is thus pos-sible to interpolate the aerosol reflectance between two con-secutive models without searching the whole set of models. 2.2 Image processing
In terms of image processing, we followed approximately the method for METEOSAT (Moulin et al., 1997b). The first step is to convert the numerical counts to TOA reflectances using the calibration coefficients provided by EUMETSAT (Govaerts and Clerici, 2004). The next step is to remove cloud-contaminated pixels over the ocean using the spatial variability of the TOA reflectance at 0.81 µm, with aerosol plumes being much more homogeneous than clouds. Pixels with a standard deviation of the TOA reflectance, computed on an area of 3×3 pixels (centred on the considered pixel) greater than 0.0045, are considered as cloudy. This value has been chosen by trial and error, by visual examination of several true-colour composite images. In order to avoid any cloud contamination of our aerosol product, an additional test removes the pixels located next to a cloudy pixel (as detected by the test on the local variance). Note that the MSG resolu-tion is 3 km at nadir (i.e. at the crossing of the equator and of the Greenwich meridian).
When it is a significant contribution to the signal, the Sun-glint prevents an accurate retrieval of the aerosol opti-cal properties. The size of the contaminated area in the MSG imagery depends strongly on the wind speed and direction,
F. Thieuleux et al.: Remote sensing of aerosols over the oceans using MSG/SEVIRI imagery 3563
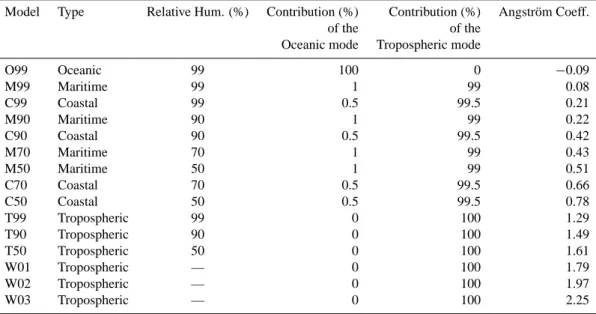
Table 1. Characteristics of the aerosol models used in this study. They are all made of a mixing of the oceanic and tropospheric lognormal
modes of Shettle and Fenn (1979), except for the W01, W02 and W03 models. These three models were derived from the tropospheric mode at a relative humidity of 0% by decreasing the mean radius from 0.027 µm (original value) to 0.021, 0.017 and 0.015 µm, respectively. Note that the Angstr¨om coefficient is computed between 0.63 and 0.81 µm and that the contribution of both Oceanic and tropospheric modes are in number (not in volume or in surface).
Model Type Relative Hum. (%) Contribution (%) Contribution (%) Angstr¨om Coeff.
of the of the
Oceanic mode Tropospheric mode
O99 Oceanic 99 100 0 −0.09 M99 Maritime 99 1 99 0.08 C99 Coastal 99 0.5 99.5 0.21 M90 Maritime 90 1 99 0.22 C90 Coastal 90 0.5 99.5 0.42 M70 Maritime 70 1 99 0.43 M50 Maritime 50 1 99 0.51 C70 Coastal 70 0.5 99.5 0.66 C50 Coastal 50 0.5 99.5 0.78 T99 Tropospheric 99 0 100 1.29 T90 Tropospheric 90 0 100 1.49 T50 Tropospheric 50 0 100 1.61 W01 Tropospheric — 0 100 1.79 W02 Tropospheric — 0 100 1.97 W03 Tropospheric — 0 100 2.25
a piece of information that is not available within our pro-cessing, contrary to what is done for the operational process-ing of sensors like POLDER and MODIS. In order to avoid any possible Sun-glint contamination, we discard all pixels whose line-of-sight makes an angle less than 30◦ with the specular direction. Finally, pixels with geometries which are too extreme (θS or θV greater than 75◦) are also discarded
because they are out of the validity range of the 6S radiative transfer model.
The last step of the image processing is the inversion it-self. The LUT is first used to estimate the aerosol optical thickness that corresponds to the 0.81 µm TOA reflectance for each of the 15 aerosol models, accounting for the actual observation geometry by linearly interpolating between the tabulated values of the three angles θS, θV and 1φ. The
LUT is further used to interpolate the corresponding theo-retical TOA reflectance at 0.63 µm for each of the 15 aerosol models. The model that reproduces the best TOA reflectance at this shorter wavelength, which was not used to compute the optical thickness, is selected.
The final result of the inversion algorithm is thus this aerosol model, which is associated with a given Angstr¨om coefficient, and the aerosol optical depth extrapolated at 0.55 µm, a standard wavelength for the inter-comparison of aerosol load products. This latter spectral extrapolation is done once again by interpolating on the geometry in the LUT the TOA reflectances at 0.55 µm for the selected aerosol model. Note, however, that when the aerosol load is very low, the satellite measurement is too small to properly as-sess its spectral signature. In such a case (i.e. whenever the
retrieved optical thickness is lower than 0.07), the O99 model is utilized and a new optical thickness is derived. This model was selected because it is representative of marine aerosols encountered over the remote oceans, where the smallest op-tical thicknesses are mostly expected.
The results of this processing are maps of both the aerosol optical thickness and the Angstr¨om coefficient. Note that by default the optical thickness is computed at 0.55 µm, but that it is possible to select another wavelength for compari-son with other measurements. In that case, the optical thick-ness is then simply extrapolated from that at 0.55 µm, using the retrieved Angstr¨om coefficient. The developed computer code is fast enough to enable the processing of several slots per day for long periods of time: it takes about 24h to process one month of MSG data with 9 slots per day on a standard mono-processor PC/Linux.
3 Results
Figure 1 compares daily maps of aerosol optical thickness obtained using one single slot and combining the estimates from nine successive slots. The use of several images per day yields a significant improvement of the spatial cover-age for three main reasons: 1) the area affected by the Sun-glint (located in the Gulf of Guinea in the single slot image) moves from east to west during the day and does not affect all slots; 2) it fills a large fraction of the cloudy areas where the cloud coverage is fractional (mainly in the tropics), because clouds move away between successive acquisitions; 3) it en-ables to process pixels that are not sunlit on one particular
3564 F. Thieuleux et al.: Remote sensing of aerosols over the oceans using MSG/SEVIRI imagery
1
Fig. 1. Impact on the spatial coverage of the number of slots used
to compute the daily aerosol optical thickness at 0.55 µm for 7 June 2003 (METEOSAT-7 images). The left map has been computed with one single slot (12:15 UT), whereas the right map has been computed using nine slots (from 8:15 to 16:15 UT by step of 1). Continents are in dark grey, whereas masked marine pixels (either cloudy or contaminated by the Sun-glint) are grey.
slot (e.g. pixels on the edge of the Earth disk on the noon image). The daily map obtained using nine slots in Fig. 1 has a remarkable spatial coverage when compared to what is produced by orbiting sensors with comparable spatial reso-lution, such has MODIS (1 km) or POLDER (6 km). Such coverage clearly improves the quality of weekly or monthly mean aerosol products and facilitates the physical interpre-tation of interesting aerosol events. Such an example can be seen in Fig. 1, which shows both a dust plume from Northern Africa over the Atlantic, up to America, and a transport of biomass burning aerosols from southern Africa.
Note, however, that several areas in Fig. 1 within dust-contaminated regions (in the Persian Gulf or in the western part of the Atlantic dust plume) show significant differences when the daily mean is estimated from a single image or 9 slots. This is likely due to the fact that the aerosol op-tical thickness may vary significantly during the day in re-gions close to the sources or where the wind is strong. It is, however, also possible that part of this diurnal variation of the optical thickness is artificial and related to the wrong as-sumption of particle sphericity when computing aerosol opti-cal properties throughout the Mie theory. It has indeed been shown that the effect of the non-sphericity strongly varies with the viewing geometry, and, in particular, during the day with the solar zenith angle (Masuda et al., 2002; Herman et al., 2005).
Figure 2 shows monthly mean maps of retrieved aerosol optical thickness and the Angstr¨om coefficient for June 2003, using only three slots per day instead of the nine slots planned for the final processing. Maps of the aerosol optical thickness show aerosol transport patterns which are consis-tent with those of the METEOSAT climatology (Moulin et al., 1997c). The dominant aerosol transports show up clearly as African dust over the Atlantic, the western Mediterranean, the Red Sea and the western Indian Ocean; as biomass burning aerosols south of the Gulf of Guinea. These two
2
Fig. 2. Monthly mean maps of the aerosol optical thickness at
0.87 µm (left) and the Angstr¨om coefficient (right) for June 2003, as retrieved from MSG/SEVIRI images using three slots per day (11:15, 12:15 and 13:15 UT). Monthly means for both parameters are computed as the arithmetic average of all clear-sky pixels of the month. MSG data are projected on a regular latitude-longitude grid, and the optical thickness is converted to a different wave-length to enable comparison with available products from POLDER (Fig. 6). The east-west dissymmetry in the images’ coverage is be-cause MSG was not yet at its operational location and was still at 10◦W in June 2003. Note that only three slots per day were avail-able at the time of this study because MSG was in its commissioning phase and we had restricted access to the data. Note also that 5 days (15–19 June) of MSG data were not available at the time of this study.
dominant aerosols are characterized by Angstr¨om coeffi-cients of about 0.4–0.7 for mineral dust and of about 1.4–1.7 for biomass burning aerosols. Interestingly, the Angstr¨om coefficient map brings up additional information in regions where the optical thickness is small, such as the predom-inance of aerosols likely from pollution origin in the East Mediterranean downwind of eastern Europe or the plume of likely biomass burning aerosols coming from Amazonia over the southern Atlantic. Note that the zone contaminated by the Sun-glint does show up in these maps because three slots are used instead of 9 in Fig. 1.
4 Validation using AERONET
Direct measurements of the aerosol optical thickness at several wavelengths in the visible and the near-infrared at coastal Mediterranean and Atlantic stations by the AERONET network (Holben et al., 1998) are used to val-idate τ and α retrieved from MSG measurements. Hourly level 2.0 (cloud-screened and quality-assured) sunphotome-ter measurements at six stations (see Table 2) were avail-able for June 2003. Because Sun photometers do not always have a channel at 0.55 µm, τ was linearly interpolated be-tween the two basic bands at 0.44 and 0.67 µm, to ensure the compatibility with MSG estimates. α was computed di-rectly using the measured aerosol optical thicknesses at 0.67 and 0.87 µm. The MSG product validated here is based on data acquired at 11:15, 12:15 and 13:15 UT. To reduce the possible noise due to the diurnal variability, AERONET
F. Thieuleux et al.: Remote sensing of aerosols over the oceans using MSG/SEVIRI imagery 3565 3 0 5 10 15 20 25 30 ! " Day (June 2003) 0.1 0.2 0.3 0.4 0.5 1.0 1.5 2.0 2.5
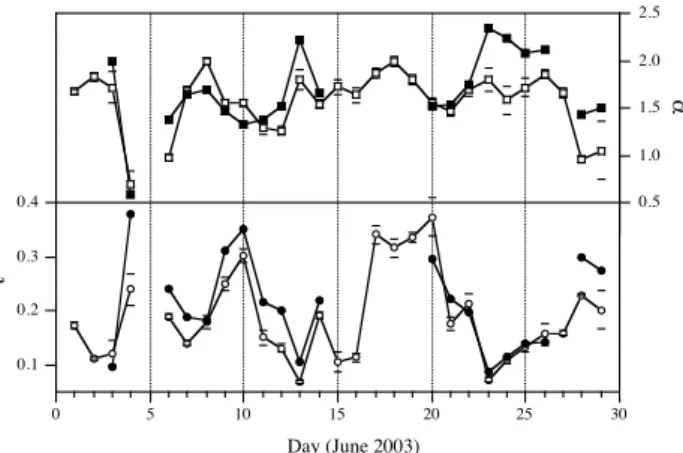
Fig. 3. Comparison of MSG/SEVIRI retrievals with AERONET
measurements at the Forth Crete station in June 2003 for both aerosol optical thickness at 0.55 µm (bottom) and the Angstr¨om coefficient α (top). AERONET measurements are represented by opened symbols and MSG retrievals by filled symbols. The stan-dard deviation on AERONET measurements is shown as dashes above and below each AERONET symbol. Note that 5 days (15–19 June) of MSG data were unavailable at the time of this study.
measurements taken between 10:00 and 14:00 UT only were averaged and compared to the satellite product.
The comparison between MSG retrievals and Sun pho-tometer measurements is made by extracting τ and α over the closest 3×3 pixel marine area distant by at least 5 km from the coast, to avoid turbid water contamination. A total of 77 coincident measurements are available for the valida-tion. Figure 3 shows the results of the comparison for the AERONET station located in Crete, in the eastern Mediter-ranean. As shown in Fig. 2, this region is of particular interest for aerosol studies because of the contrasted influ-ences of Europe (pollution) and North Africa (desert dust). In addition, there is almost no cloud during summer over this region. In AERONET data, τ varied between 0.1 and 0.4 at this station during June 2003, and α varied between 0.5 and 2.0. Figure 3 shows a good agreement between MSG retrievals and ground-based measurements. The sensitivity of the MSG Angstr¨om coefficient is sufficient to allow dif-ferentiation between African dust (e.g. α=0.5 on day 4) from other aerosols, even if it seems overestimated during the last week of June 2003. The agreement is also good for aerosol optical thickness, and the largest difference occurs for the African dust event of day 4. This suggests that, even if the Angstr¨om coefficient is properly retrieved on that particular day, the very specific optical properties of mineral particles (e.g. Moulin et al., 2001), which are not accounted for in our set of aerosol models, may introduce some error in the re-trieval of τ .
Figure 4 summarizes the validation results for the aerosol optical thickness at the six AERONET stations. There is no significant bias in the satellite product and 85% of the es-timates are within ±30% of the Sun photometer measure-ments. The comparison over the various sites indicates that
4 ! (MSG) !(AERONET) 0.1 0.2 0.4 1.0 0.1 0.2 0.4 1.0 2.0 2.0
Fig. 4. Comparison of the 77 aerosol optical thicknesses at 0.55 µm
retrieved from coincident MSG and AERONET measurements. Open and filled symbols are respectively for Mediterranean (56 measurements; circles for Erdemli, squares for Nes Ziona and tri-angles for Forth Crete) and Atlantic (21 measurements; circles for Dahkla, squares for Azores and triangles for Sal island) stations (see Table 1). Note that logarithmic axes have been used to evidence small values of τ . The slope of the linear regression performed on all data is 1.0, with a correlation coefficient of 0.83.
the product is of somewhat lower quality for the sites that are directly affected by the main dust plume from Northern Africa, which seems to confirm that the product accuracy is lower for dust. Note that the point with the largest discrep-ancy (τ =0.17 for AERONET and 0.62 for MSG) is from the Dahkla data set and seems to correspond to the MSG image of a dust plume that was transported over the ocean but not over the coastal AERONET station. As usual with this kind of validation based on AERONET measurements, it is likely that a careful visual examination of individual images would enable one to remove the worst cases in Fig. 4, and thus to improve the comparison.
Figure 5 shows a similar comparison for the Angstr¨om co-efficient. There is no significant bias but there is a much larger dispersion than for τ . In addition to the unsuitable optical properties for mineral particles, this relative inaccu-racy is mostly apparent for data with low optical thicknesses (τ <0.15) when the low signal makes it difficult to assess its spectral signature. When the data set is restricted to large optical thicknesses, there is a better agreement between the surface measurement and satellite estimates of the Angstr¨om coefficient, as shown in Fig. 5.
5 Comparison with POLDER-2
The series of POLDER (Polarization and Directionality of the Earth Reflectance) sensors are dedicated to the observa-tion of climate-relevant parameters, which include a com-prehensive set of aerosol optical properties. This instrument is particularly well suited for aerosol retrievals, thanks to its multidirectional and polarization capabilities (Deschamps et al., 1994). POLDER measurements provide a strong
3566 F. Thieuleux et al.: Remote sensing of aerosols over the oceans using MSG/SEVIRI imagery
Table 2. AERONET stations available in June 2003 to validate MSG aerosol retrievals.
Sal Island Dahkla Azores Forth Crete Erdemli Nes Ziona
Long. 22.93◦W 15.95◦W 28.63◦W 25.28◦E 34.25◦E 34.79◦E Lat. 16.73◦N 23.72◦N 38.53◦N 35.33◦N 36.56◦N 31.92◦N Country Capo Verde Morocco Portugal Greece Turkey Israel P.I. D. Tanr´e H. Benchekroun B. Holben M. Drakakis B. Holben B. Holben
5
!
(MSG)!
(AERONET) -0.5 0.0 0.5 1.0 1.5 2.0 2.5 -0.5 0.0 0.5 1.0 1.5 2.0 2.5Fig. 5. Comparison of the 77 aerosol Angstr¨om coefficients
re-trieved from coincident MSG and AERONET measurements. Open and filled circles are, respectively, for data with τ <0.15 (26 mea-surements) and τ >0.15 (51 meamea-surements). The slope of the linear regression performed on all data is 1.02, with a correlation coeffi-cient of 0.58.
6
Fig. 6. Monthly mean maps of the aerosol optical thickness at
0.87 µm (left) and the Angstrˆom coefficient (right) for June 2003 as retrieved from POLDER-2 images.
constraint on the aerosol phase function and its spectral signature, which can be used to estimate the aerosol size dis-tribution and non-sphericity (Deuz´e et al., 2000; Herman et al., 2005), and thus to improve the accuracy of both τ and α. POLDER-1 and -2 were flown on board the Japanese satel-lites ADEOS-1 and -2, and provided data from November 1996 to June 1997, and from April 2003 to October 2003,
respectively. A third similar instrument, named PARASOL, has been successfully launched on board a micro-satellite in December 2004. Note that these POLDER instruments have all been flown on board polar orbiting satellites, which allow one to observe a given pixel once a day at best, whereas MSG observes the same pixel every 15 min during daytime. In con-trast, POLDER provides global observations and can avoid the use of Sun-glint-contaminated measurements, thanks to its directional capability.
Briefly, the POLDER retrieval algorithm is based on mea-surements of both total and polarized light at 0.67 and 0.87 µm. The best aerosol model is found by comparing these measurements to a large set of bimodal aerosol mod-els made of various proportions of fine and coarse modes, including spherical and non-spherical particles. This set of aerosol models is by far more sophisticated and likely real-istic than the one used in this study. MSG measurements are more limited than those of POLDER in terms of aerosol information content for a given pixel, and therefore do not permit one to distinguish such a large range of aerosol mod-els.
Figure 6 shows POLDER monthly mean maps of both the aerosol optical thickness and the Angstr¨om coefficient for June 2003. These maps can be directly compared to those shown in Fig. 2. The optical thicknesses obtained with both sensors are remarkably similar. The transport of African dust over the north tropical Atlantic, the Red Sea and the north-ern Indian Ocean is clearly depicted, as well as the pollution plume from North America over the North Atlantic. The two sensors retrieve similar optical thicknesses of biomass burn-ing aerosols retrieved over the Guinea Gulf. The monthly mean image of optical thickness from MSG shows much less small-scale structures – most probably noise – than that of POLDER. Similarly, the coverage by MSG is much better. This observation confirms that the use of several images per day strongly improves the quality of the aerosol monitoring, even though Fig. 2 has been generated using only three slots per day while many more are available. The gap in coverage at the image center, south of the coast of Senegal, is a con-sequence of the Sun-glint contamination and would be filled when earlier and later slots are used.
The differences between the two sensors in Figs. 2 and 6 are much more important for the Angstr¨om coefficient, par-ticularly for the dust plume over the tropical Atlantic that is characterized by values of α of about 0.8 for MSG and
F. Thieuleux et al.: Remote sensing of aerosols over the oceans using MSG/SEVIRI imagery 3567 of about 0.2 for POLDER. Even if the POLDER map is
particularly noisy in the dust zone, it seems that the MSG Angstr¨om coefficients are overestimated in a region where values of 0.2–0.5 are often reported (Moulin et al., 1997b). Such a difference has still to be understood, but it might be due once again to the lack of realistic models for mineral particles in the LUT. Other regions show significant differ-ences between the two sensor products, such as around South Africa or Madagascar, where the O99 aerosol model is im-posed in the inversion because digital counts are too small to ensure the accuracy of the results. The two sensors are, on the contrary, in relatively good agreement with the pollution plume from North America and with the biomass aerosols in the Guinea Gulf. The overall agreement on α, however, remains relatively poor between MSG and POLDER. A pos-sible explanation is that the MSG calibration is still prelimi-nary and a small error on the reflectance at 0.63 µm, for ex-ample, will not greatly affect the retrieval of the optical thick-ness but will modify significantly the Angstr¨om coefficient.
6 Conclusions
An inversion method has been developed to estimate the aerosol optical thickness and the Angstr¨om coefficient over the ocean from MSG/SEVIRI measurements at 0.63 and 0.81 µm. This is achieved using a standard “best–match” comparison of MSG reflectances to a set of pre-computed simulated TOA reflectances. For efficiency purposes, TOA reflectances were computed for a set of only 15 aerosol mod-els that enables a rapid search of the best solution. We ap-plied this inversion technique to slots 45, 49 and 53 (11:15, 12:15, 13:15 UT) of all available days of June 2003.
Monthly mean maps of both parameters exhibit clearly the dominant aerosols, i.e. mineral and biomass burning aerosols, as well as the influence of pollution from Europe over the Mediterranean. A comparison with the AERONET in-situ measurements performed in the tropical Atlantic and in the Mediterranean shows that MSG retrievals have a good accuracy in terms of optical thickness, while the Angstr¨om coefficient shows some dispersion. The comparison with POLDER products for June 2003 confirms that the retrieved optical thickness is of good quality, whereas the two sensor estimates of the Angstr¨om coefficient show significant dif-ferences. Potential explanations are the uncertainties on the MSG calibration at this early stage of its lifetime and the lack of a realistic model for mineral dust in the simulated reflectances.
The preliminary results presented here, however, demon-strate the strong potential of MSG for the characterization of marine aerosols, in particular, because several images per day are available. Such a high frequency of observations make MSG aerosol products very complementary to those of the polar orbiting sensor, such as POLDER and MODIS, even though the latter are better suited to retrieve detailed informa-tion on the aerosol size distribuinforma-tion. Thanks to the efficiency of the inversion code, we aim at processing nine MSG slots
per day in full resolution over several months. A potential improvement would come from the use of the MSG 1.64 µm band to provide additional information and better constrain the aerosol model, in particular, for large mineral particles. Another possible improvement of the method could be to use ancillary data from meteorological models to refine the Sun-glint removal through the wind speed and the atmospheric gaseous absorption estimate through ozone and water vapor content.
Acknowledgements. MSG data were provided during the commis-sioning phase of the satellite by EUMETSAT in the framework of the MSG-RAO project “MSG Improved Capabilities for Marine Aerosol Characterization” (PI C. Moulin). We would like to thank AERONET PIs, H. Benchekroun, M. Drakakis and B. Holben, for maintaining and collecting the ground-based data. POLDER data are available at http://polder.cnes.fr.
Topical Editor F. D’Andr´ea thanks two referees for their help in evaluating this paper.
References
Chiapello, I. and Moulin, C.: TOMS and METEOSAT satellite records of the variability of Saharan dust transport over the At-lantic during the last two decades (1979–1997), Geophys. Res. Lett., 29, 17–20, 2002.
Deschamps, P. Y., Br´eon, F. M., Leroy, M., Podaire, A., Bricaud, A., Buriez, J. C., and S`eze, G.: The POLDER mission: Instrument characteristics and scientific objectives, IEEE Trans. Geosci. Re-mote Sens., 32, 598–615, 1994.
Deuz´e, J. L., Goloub, P., Herman, M., Marchand, A., Perry, G., Susana, S., and Tanr´e, D.: Estimate of the aerosol properties over the ocean with POLDER on ADEOS-1, J. Geophys. Res., 105, 15 329–15 346, 2000.
Gordon, H. R. and Wang, M.: Retrieval of water-leaving radiance and aerosol optical thickness over the oceans with SeaWiFS: a preliminary algorithm, Appl. Opt., 33, 443–452, 1994.
Govaerts, Y. and Clerici, M.: MSG-1/SEVIRI Solar Channels Calibration, Commissioning Activity Report EUM/MSG/TEN/04/0024, EUMETSAT, Darmstadt, Germany, 2004.
Herman, M., Deuz´e, J. L., Marchand, A., Roger, B., and Lallart, P.: Aerosol remote sensing from POLDER/ADEOS over the ocean: Improved retrieval using a nonspherical particle model, J. Geo-phys. Res., 110, D10S02, doi:10.1029/2004JD004798, 2005. Holben, B. N., Eck, T. F., Slutsker, I., Tanre, D., Buis, J. P.,
Set-zer, A., Vermote, E., Reagan, J. A., Kaufman, Y. J., Nakajima, T., Lavenu, F., Jankowiak, I., and Smirnov, A.: AERONET - a federated instrument network and data archive for aerosol char-acterization, Remote Sens. Environ., 66, 1–16, 1998.
Holben, B. N., Tanre, D., Smirnov, A., Eck, T. F., Slutsker, I., Abuhassan, N., Newcomb, W. W., Schafer, J. S., Chatenet, B., Lavenu, F., Kaufman, Y. J., Castle, J. V., Setzer, A., Markham, B., Clark, D., Frouin, R., Halthore, R., Karneli, A., O’Neill, N. T., Pietras, C., Pinker, R. T., Voss, K., and Zibordi, G.: An emerging ground-based aerosol climatology: Aerosol optical depth from AERONET, J. Geophys. Res., 106, 12 067–12 098, doi:10.1029/2001JD900014, 2001.
Jamet, C., Moulin, C., and Thiria, S.: Monitoring aerosol optical properties over the Mediterranean from SEAWIFS images
us-3568 F. Thieuleux et al.: Remote sensing of aerosols over the oceans using MSG/SEVIRI imagery
ing a neural network inversion, Geophys. Res. Lett., 31, L13107, doi:10.1029/2004GL019951, 2004.
Kaufman, Y. J., Tanr´e, D., and Boucher, O.: A satellite view of aerosols in the climate system, Nature, 419, 215–223, 2001. Masuda, K., Mano, Y., Ishimoto, H., Tokuno, M., Yoshizaki, Y.,
and Okawara, N.: Assessment of the nonsphericity of mineral dust from geostationary satellite measurements, Remote Sens. Environ., 82, 238–247, 2002.
McClain, C. R., Ainsworth, E. J., Barnes, R. A., Eplee, Jr., R. E., Patt, F. S., Robinson, W. D., Wang, M., and Bailey, S. W.: Sea-WiFS Postlaunch Calibration and Validation Analyses, Part 1. NASA Tech. Memo. 2000–206892, Vol. 9, (Eds.) Hooker, S. B. and Firestone, E. R., NASA Goddard Space Flight Center, 82, 2000.
Moulin, C., Lambert, C. E., Poitou, J., Guillard, F., and Dulac, F.: Long-term (1983–1994) calibration of the Meteosat solar (VIS) channel using desert and ocean targets, Int. J. Remote Sensing, 17, 1183–1200, 1996.
Moulin, C., Lambert, C. E., Dulac, F., and Dayan, U.: Control of atmospheric export of dust from North Africa by the North At-lantic Oscillation, Nature, 387, 691–694, 1997a.
Moulin, C., Guillard, F., Dulac, F., and Lambert, C. E.: Long-term daily monitoring of Saharan dust load over marine areas using Meteosat ISCCP-B2 data, 1. Methodology and preliminary re-sults for 1983-1994 in the Western Mediterranean, J. Geophys. Res., 102, 16 947–16 958, 1997b.
Moulin, C., Dulac, F., Lambert, C. E., Chazette, P., Jankowiak, I., Chatenet, B., and Lavenu, F.: Long-term daily monitoring of Saharan dust load over marine areas using Meteosat ISCCP-B2 data, 2. Accuracy of the method and validation using sunpho-tometer measurements, J. Geophys. Res., 102, 16 959-16 968, 1997c.
Moulin, C. and Schneider, X.: Calibration of the Meteosat-5 sensor visible channel, Int. J. of Remote Sensing, 20, 195–200, 1999. Moulin, C., Gordon, H. R., Banzon, V. F., and Evans, R. H.:
As-sessment of Saharan dust absorption in the visible from SeaWiFS imagery, J. Geophys. Res., 106, 18 239–18 250, 2001.
Shettle, E. P. and Fenn, R. W.: Models for the aerosols of the lower atmosphere and the effects of humidity variations on their optical properties, Rep. AFGL-TR-79-0214, Environ. Res. Pap. 675, Air Force Geophys. Lab., Hanscom Air Force Base, Mass., 1979. Vermote, E., Tanr´e, D., Deuz´e, J. L., Herman, M., and Morcrette, J.
J.: Second Simulation of the Satellite Signal in the Solar Spec-trum (6S): User Guide, LOA, 1997.