HAL Id: halshs-01785324
https://halshs.archives-ouvertes.fr/halshs-01785324
Preprint submitted on 4 May 2018
HAL is a multi-disciplinary open access archive for the deposit and dissemination of sci-entific research documents, whether they are pub-lished or not. The documents may come from teaching and research institutions in France or abroad, or from public or private research centers.
L’archive ouverte pluridisciplinaire HAL, est destinée au dépôt et à la diffusion de documents scientifiques de niveau recherche, publiés ou non, émanant des établissements d’enseignement et de recherche français ou étrangers, des laboratoires publics ou privés.
Luc Arrondel, Jérôme Coffinet
To cite this version:
Luc Arrondel, Jérôme Coffinet. Demand For Stocks in the Crisis: France 2004-2014 . 2018. �halshs-01785324�
WORKING PAPER N° 2018 – 17
Demand For Stocks in the Crisis:
France 2004-2014
Luc Arrondel Jérôme Coffinet
JEL Codes: Keywords:
P
ARIS-
JOURDANS
CIENCESE
CONOMIQUES 48, BD JOURDAN – E.N.S. – 75014 PARISTÉL. : 33(0) 1 80 52 16 00=
www.pse.ens.fr
CENTRE NATIONAL DE LA RECHERCHE SCIENTIFIQUE – ECOLE DES HAUTES ETUDES EN SCIENCES SOCIALES
ÉCOLE DES PONTS PARISTECH – ECOLE NORMALE SUPÉRIEURE
D
EMAND FOR
S
TOCKS IN THE
C
RISIS
:
F
RANCE
2004-2014
Luc Arrondel
CNRS-Paris School of Economics
and
Jérôme Coffinet
Banque de FranceMarch 2018
Acknowledgements: The authors thank Christian Pfister, Renaud Lacroix and Dominique Durant for their
comments, and participants to the Scientific Committee of the Autorité des marches financiers in October 2017, to the OFCE seminar in November 2017. All remaining errors are our own responsibility. The opinions expressed in the paper do not necessarily represent those of the Banque de France.
Abstract
In this paper, we assess how the factors explaining the holdings of stocks have evolved through the financial crisis. We rely on the data collected in surveys conducted among French households during the period 2004-2014. There are three main modes for investing in stocks: buying shares directly; purchasing them through mutual funds; and finally taking out unit-linked life insurance. Obviously, these three ways to invest in stocks do not involve the same investment behaviours since, besides the risk and return characteristics, they differ in their transaction costs, management fees and taxation. As a result, there is no a priori reason to consider that portfolio choice decisions by households on these modes of stockownership are equivalent and correspond to the same individuals’ characteristics.
We show that the holding of risky assets and of individual direct shares decreased during the period, and especially between 2009 and 2014. At the end of the period, the profile of direct equity holders was refocused towards profiles with greater risk tolerance. Other factors of direct stockholdings include: better education, gifts and inheritances, parents holding securities, singles, high-wealth households and high-income groups. Conditionally on holdings, the proportion of risky assets increases with risk tolerance and the holding of securities by parents. It also decreases at the end of the period. Our paper also shows that shareholders have gradually moved towards preferential ownership of shares in life insurance rather than direct share ownership, especially between 2009 and 2014.
The estimation of a simultaneous model shows the specific characteristics of stockholders depending on the chosen support (direct, indirect or on life insurance): those who invest directly in stocks are richer, more educated and less risk averse; those who hold mutual funds are a little richer but more risk averse and do not appear the most educated; finally, for ownership in stocks on life insurance contracts, the position in the life cycle plays an important role as well as the social category.
1. Introduction
The Great Recession saver suffers from a number of “depressions” such as the financial and economic crisis that has made for a more uncertain environment, the macroeconomic risk associated with the future of the social security system (pensions, health, etc.), the greater risk of unemployment, the blur of tax and institutional reforms, and the “individual active labour market” policy fad designed to make individuals more responsible for their future. Probably as a result of all these uncertainties, French savers are opting more than ever before for safe, short-term assets (mainly savings account deposits), insurance savings and real estate to the disadvantage of risky, long-term financial investments.
The INSEE Patrimoine (Household Wealth) surveys report that the distribution of securities fell from approximately one in four French households in 2004 to one in six in 2014 (one in five in 2010). This downward trend of risky savings is not specific to France, having been observed in several other countries (Dohmen et al., 2016, Guiso et al., 2014, Necker and Ziegelmeyer, 2016).
These figures display a sharp drop in the number of shareholding households during the financial crisis, as well as the structural weakness of the stock market participation rate in general. This lack of saver interest in risky products is found as much in terms of stock market participation (stock market participation puzzle) as in the demand for shares, despite their higher returns in the long term (equity premium puzzle). If the crisis has played an important role in reducing the number of shareholders, tax policy – to the detriment of stocks since January 2013 – has likely accentuated this trend.
These puzzles are not peculiar to France. They are a widespread phenomenon, especially in the euro area. European HFCS (Household Finance and Consumption Survey) data show the distribution of risky financial assets to be around one in five households in the leading countries and the euro area as a whole (Arrondel et al., 2016). It is higher, but still far from 100%, among wealthier households. For example, nearly three in four of the 5% richest households hold risky assets in Belgium, but the figure stands at just under two in three in France and at around one in two in Spain, Italy and Germany. Belgians also invest much larger sums in these assets (Arrondel and Masson, 2014a).
In France, there are three main modes for investing in stocks: buying shares directly; purchasing them through mutual funds; and finally, taking out unit-linked life insurance. Obviously, these three ways to invest in stocks are not equivalent from a behavioural point of view, since besides the risk and return characteristics, the three modes differ in terms of transaction costs, management fees and taxation. Accordingly, there is no a priori reason to think that portfolio choice decisions by households on these modes of stockownership will be the same, nor correspond to the same individuals’ characteristics.
The rest of the paper is organised as follows. In Section 1, we look at the possible explanations for these empirical puzzles through an economist’s eyes, whether a disciple of “standard” theory or the behaviourist models: the lack of tolerance for stock market investments appears to be due as much to supply – (fixed) transaction costs in the broad sense of the term and relatively unfavourable taxation reducing expected returns – as demand – lack of financial literacy among savers, aversion to risk deemed too high, exposure to other risks (income, unemployment, family, health, housing and human capital), non-standard rationality (ambiguity aversion or loss aversion, etc.), etc.
Section 2 presents a literature review of the determinants of stockholdings. Section 3 exhibits descriptive statistics on participation in the different stockholding modes and on asset location among stockholders. We draw on the INSEE “Patrimoine surveys” (2004-2010-2014) data for France to study the reactions of savers during the “Great Recession”. Section 4 presents the estimations results of basic econometric models on participation in direct stockholding and in stockholding through mutual funds and life insurance. Section 5 elaborates on a more comprehensive simultaneous model of investment choices, while Section 6 offers concluding remarks.
2. Why do households hold so few shares: overview of the theory
The equity premium puzzle was born of the incapacity of “standard” saver theory, a model coupling the life cycle hypothesis with the theory of optimal portfolio choice (Merton, 1971), to explain the low level of household investment in shares. There are two schools of economists trying to explain this puzzle: those who seek to extend the basic model to a more realistic environment – mainly by assuming the existence of transaction costs, market imperfections and market incompleteness – and the proponents of behavioural economics, who challenge the essence of the saver rationality notion of standard theory from the point of view of both choices and expectations. This theory rests as much on decision-making rationality (which assumes both expected utility and discounted utility) as it does on the assumption of market efficiency and rational expectations.1 We will see that this hypothesis
no doubt needs challenging to explain the equity premium puzzle, since talk of bounded rationality is not in itself enough to solve the puzzle.
2.1 The “standard” investor: intertemporal portfolio choice theory
The benchmark model taken to explain saver behaviour is the life cycle model in its “standard” form (Modigliani, 1986). Coupled with asset choices, this model of expected utility (Merton, 1971) ties in, under certain assumptions, with the static model of optimal
1 Efficient-market hypothesis states that prices reflect all available information (Fama, 1970). There is therefore no
possibility of an opportunity for arbitrage: on a market, then, no one can sustainably make profits higher than the average profits (Cochrane, 2005).
portfolios put forward by Arrow (1965).2 In its simplest version, where the investor has the
choice between a risky asset (which may correspond to the market portfolio) with an expected return α and standard deviation σ, and a risk-free asset with return r, the proportion p of risky assets in wealth is equal (for isoelastic utility) to:
p = (
α– r) / σ
2γ
(1) Proportion p depends on the “risk premium” (α – r), the volatility of the risky asset (σ) and the individual’s relative risk aversion (γ). The assets’ characteristics (α, r, σ) depend on the saver’s expectations, which are themselves dependent on the saver’s level of information. Hence where expectations are homogeneous, this model predicts that it is always optimal for the individual to hold risky assets, even accounting for a minimal fraction of wealth.This basic model can obviously be refined by factoring in market imperfections and incompleteness: transaction and information costs, exposure to other risks (income, human capital, housing, health, etc.), and liquidity constraints. When taking into account the individual’s uninsurable earnings risk (Kimball, 1993) or the existence of liquidity constraints (Gollier, 2001), invested proportion p will decrease as this background risk or constraints increase and as the agent’s temperance (desire to moderate the total risk), which depends on the fourth derivative of utility (and is a function of γ in the isoelastic case), increases.3
However, this standard model only has limited predictive power. Whether in its basic or extended version, it generates much more diversified portfolios than those observed in the real world. Transaction costs, other risks, liquidity and borrowing constraints, and the prohibition of short selling all limit the investments made, but do not prevent minimal shareholding from remaining profitable due to the high long-term return (over 20 years or more) on the investment.4
The stock market’s poor appeal is therefore generally attributed to the existence of various fixed entry costs, including information costs. Yet these costs can only effectively come into play – to the point of triggering a refusal to purchase – in the case of sufficiently low initial demand, generally too low to be compatible with the standard expected utility model (Haliassos, 2003). This model cannot account for the persistently low level of shareholding across large financial estates supposed to offset the effect of these transaction costs (Arrondel and Masson, 2014a).
2.2 Capital market imperfections and institutional factors
2 Under the assumption of a complete, perfect financial market and log-normal asset prices, optimal portfolios are complete
(separation theorem), myopic (independent of the agent’s time horizon) and depend only on the assets’ technical characteristics (return-risk) and the individual’s relative risk aversion (Campbell and Viceira, 2002).
3 Crainich, Eeckhoudt and Rey (2011) give a more general interpretation (expected utility or not) of the temperance concept
based on the “risk disaggregation principle”. This principle states that an investor will always prefer to avoid cumulating harms in a single state of the world.
4 Hamayon et al. (2012) show, for example, that even with the 2008 crisis, the real annual return on equities over the
(Fixed) entry costs on asset holding or management costs, threshold effects, and indivisibility effects are therefore thought to be responsible for the huge influence of estate size on the level of asset diversification (King and Leape, 1998): portfolios made up solely of cash and near-cash products are the dominion of the smallest sums of wealth, while well-diversified portfolios are the prerogative of the highest sums. Yet at the intermediate levels of wealth, estate size has less explanatory power when it comes to the number and combination of assets held (see Arrondel and Masson, 2014a, for France).
Liquidity constraints and other impossibilities to borrow (Gollier, 2001) on own resources or future rents (credit refusal or expectation of credit refusal, now or in the future) along with labour supply rigidities (unemployment and one sole income earner in the couple, see Bodie, Merton and Samuelson, 1992) also have the expected effects, although they are weaker than the sum-of-wealth effects. They increase precautionary savings, but decrease the probability of the existence and proportion of risky investments, since these constraints and rigidities are all the less likely to help individuals rebound in the event of financial misfortune by borrowing or working more. More generally, non-financial-market risks (with respect to income, health and family) – termed background risk – accordingly limit the investments made in shares (Kimball, 1993). These risks have the particularity of being strongly but differently correlated with age: the human capital return risk is greater at a young age (Viceira, 2001) while the health risk increases with age and the family risk is more concentrated in the median ages.
In addition, the different phases of the home ownership process (putting together the down payment and repaying the loan), the risk inherent in this asset, and the aforementioned costs, indivisibilities, and constraints play a decisive role since they themselves reflect on demand for financial assets, often in favour of more liquid, safer investments (Cocco, 2002; Viceira, 2001). Lastly, the low level of distribution of risky financial assets could also be due to disadvantageous taxation on these products, compared with real estate taxation, and little development of funded pension schemes.
To sum up, basic portfolio choice theory, even extended to financial market imperfections, struggles to explain the low level of portfolio diversification (Guiso and Sodini, 2012). The equity premium should give rise to much larger sums being invested in risky assets (equity
premium puzzle: Mehra and Prescott, 1985; Kocherlakota, 1996), but also to a much higher
level of saver participation in the stock market (stock market participation puzzle: Haliassos, 2003). Secondly, the study of portfolio dynamics, mainly growth in demand for shares over the life cycle, no doubt requires more sophisticated portfolio revision models. Thirdly, the biases observed in the management of households’ stock portfolios challenge the standard model: “home” bias in favour of national shares, (uniform) “naive” diversification, the
“disposition” effect (whereby winning assets are sold too early and losing assets are sold too late), status quo bias, inertia, excessive trading (Vissing-Jorgensen, 2004), etc.
2.3 The “non-standard” investor model and its limitations
In an attempt to explain these puzzles and biases, “non-standard” models challenge the standard rationality of the saver, rejecting in particular the expected utility (EU) framework in the case of risk. These models therefore introduce other preference parameters than mere risk aversion and its derivatives (prudence and temperance) to explain saving and investment behaviour, especially loss aversion and ambiguity aversion.
In the Kahneman and Tversky (1979) model, individuals judge the profitability of a risky investment relative to a reference level – initial wealth in the simplest cases – against which they gauge gains and losses differently: if they are loss averse, the disutility derived from a loss is higher than the utility derived from an equivalent gain. Loss aversion is the most common explanation given for the disposition effect (see above). Barberis et al. (2006) also show that a combination of risk aversion and focused narrow framing of stocks can explain stock market non-participation, albeit without transaction costs: instead of savers practising integrated management, given their total wealth and budget constraints, of all the risks they face, it is posited that they tend to consider the outcomes of their share investments in isolation; they cannot help considering their stock market portfolio performance separately as if it were an isolated investment operation, i.e. without factoring in the possibilities of diversification with the other risks they face.
Ambiguity aversion (Ellsberg, 1961) is also thought to help explain a number of puzzles whereby certain investors see share prices as “ambiguous”, i.e. with return probabilities that are unknown (but tainted with Knight uncertainty). Ambiguity aversion can hence explain stock market non-participation (Bossaerts et al., 2010; Epstein and Schneider, 2010) as well as underinvestment in risky assets (Peijnenburg, 2014). More specifically, ambiguity could also explain two portfolio management puzzles: home bias (French and Poterba, 1991) and the own-equity stock puzzle (Benartzi, 2001): home bias takes the form of low demand for foreign shares, where investors tend to prefer less favourable situations when faced with unknown probabilities; “ambiguous” investors, however, will tend to opt for shares in the company in which they work.
Lastly, individuals are believed to suffer from a lack of financial education (financial literacy) and limited cognitive ability (Lusardi, 2009; Guiso and Sodini, 2012) and to be victims of their emotions (Guiso et al., 2014). This then makes them subject to “errors” of calculation and strategy, but also “errors” of expectation in their collection and processing of information: non-Bayesian revisions, overconfidence in their judgements, inability to plan for the long term, etc.
Yet non-standard models – even the most sophisticated – still find it hard to produce a totally convincing explanation, in a unified model, of the low distribution of risky products such as shares. The equity premium puzzle and stock market participation puzzle have not yet been completely solved, either by the rationality of the standard approach’s (extended) models or the rationality of the behavioural economics models. In recent years, direct shareholding has always concerned less than 15% of households. Transaction costs alone cannot explain this lack of interest, since shareholding remains low across large (financial) estates and educated households.
The current crisis environment, which has made household expectations of future share returns more pessimistic as we shall see, partially explains such a low rate of shareholders. Yet this rate has never topped a quarter of households even in the best of times for economic growth and the stock market. The finger then inevitably points at the level of household information.
2.4. Savers’ information
The basic portfolio choice model assumes that financial information is free of charge and available to all investors. Ignorance about assets and information costs of all kinds evidently constitute a source of incompleteness and diversity of the observed portfolios. A series of stylised facts show the importance of these factors in France (Arrondel and Masson, 2014). For a given sum of wealth, the level of diversification and the probability of holding risky investments increase with age as the required financial information is acquired. Portfolio diversification and shareholding also increase with the level of general education, reaching their maximum (for a given sum of wealth) among university graduates. This educational role combines with a wider habitus effect. Securities holding is much higher, other things being equal, among executives than among other employees. Last and most importantly, the fact of holding securities (such as life assurance) appears to be “inherited” since it increases sharply when these same assets are/were held by parents.
A large body of recent literature looks into the factors relating to this information, which appear to play an important role in stock market participation: cognitive ability (Christelis et
al., 2010; Grinblatt et al., 2011), trust (Guiso et al., 2008), financial awareness (Guiso and
Jappelli, 2005), time spent collecting information (Guiso and Jappelli, 2007), social interactions (Hong et al., 2004), optimism (Jouini et al., 2006), and financial education (van Rooij et al., 2011; Lusardi and Mitchell, 2014). Nevertheless, the precise mechanism by which these factors influence households’ financial choices (via the stock of information or expectations, etc.) remains to be formalised (Grinblatt et al., 2011).
The above factors, even when combined, fail to explain why only one French household in seven directly holds shares today. From this point of view, the current crisis is extremely informative about households’ financial behaviour in situations of strong uncertainty. It has
driven an extensive revision of the household finance hypotheses. It also magnifies and consequently brings to light the obstacles to household demand for shares, provided we have the detailed microeconomic panel data we need to track the (same) savers before and during this turbulent period, by observing the attendant changes in their reactions, preferences and expectations.
3. French savers in the Great Recession (2004-2014)
In this section, we present data and some descriptive statistics on participation in the different stockholding modes. Then, we present a simple estimation model on participation in securities and life-insurance, and in their different components.
3.1 The data used: INSEE Patrimoine (Household Wealth) survey (2004-2010-2014)
We use data from three waves (2004, 2010, 2014) of the Survey of INSEE Patrimoine survey, which is representative of the whole population and provides detailed information on all possible stockholding modes, as well as on investors’ characteristics, preferences, and practices. One additional features of the INSEE Patrimoine is that the rich, who own the largest share of wealth and are difficult to interview, are oversampled. Details on the survey design are provided in Arrondel et al. (2016). In our analysis, we employ weights provided by the survey in order to make sample statistics representative for the whole population. The dates of the surveys are after the stock market drop in 2000 and encompass the crash at the end of 2008 and part of the subsequent market recovery.
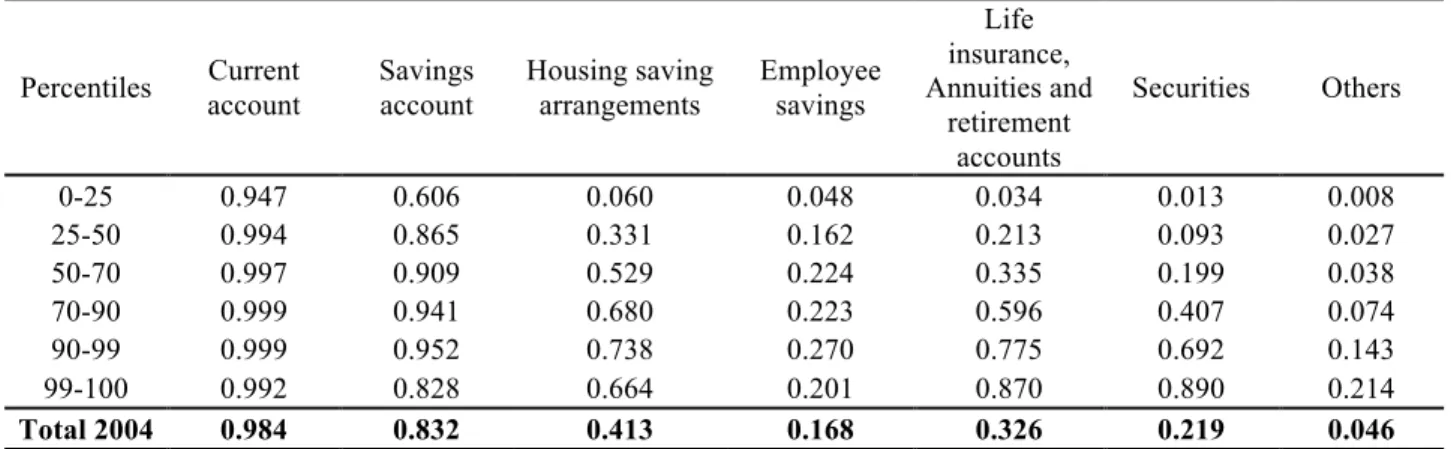
Table 1 presents ownership rates in the data for all financial assets (in six categories) and for the three waves according to the amount of financial wealth. Around 85% of households have savings accountsregardless of the year of observation. On the other financial assets, we note some significant movements in holding rates: life insurance and retirement account ownership rates increase from one third of households in 2004 to 40% thereafter; conversely, the securities ownership rate decreases from 22% in 2004 to 13% ten years later (17,6% in 2010). This first observation is already consistent with greater prudence among savers, but we have to redefine our asset classes to see this more clearly, especially among investments in different stockholding modes (see infra). Another stylised fact in Table 1 concerns the evolution of the number of households investing in risky assets along the wealth scale. We see that securities account for between 80% and 90% of investment by households in the top percentile and between 45% and 70% in the top decile. Even among the richest, one can also observe a stock participation puzzle.
Table 2 presents the structure of financial wealth according to the level of financial wealth: households invest about 21% of their financial wealth in securities and nearly 30% in life
insurance (18% on their savings accounts); among the richest, the proportions are 43.9%, 33.7% and 7.1%, respectively.
3.2 Stockholding modes in France
Distinguishing stockholdings according to their modes is justified by differences in their risk properties, their management requirements, and their liquidity characteristics (Christelis
et al. 2011). Direct stockholding is very risky (due to limited diversification),
management-intensive, and fairly liquid. Mutual funds are quite liquid, and tend to be well-diversified and professionally rather than individually managed. Unit-linked life-insurance contracts are typically tax-exempted on revenue and transmission (if held for 8 years) and well-diversified, though quite illiquid. Participation costs also differ across these modes. Directly held stocks are subject to brokerage fees, and require both constant monitoring of the market and considerable information about firm characteristics. Mutual funds also have fees, and require performance monitoring. On the other hand, they delegate responsibility for asset allocation to professionals. Finally, while investment through life insurance is partially tax-exempted, investment in stocks directly and through mutual funds is on an after tax basis. Dividends and capital gains are taxable and were subject to a flat tax until 2013 when a progressive marginal tax was introduced. Therefore, no a priori reason exists to think that portfolio choice decisions by households on these modes of stockownership will be the same and correspond to the same individuals’ characteristics.
The INSEE Patrimoine (Household Wealth) surveys (Table 3) show that the rate of direct shareholders plunged 5.5 points in France from 15,4% of households in 2004 to 9.9% in 2014 (13.5% in 2010). The share of those investing in stock mutual funds has also slightly decreased since 2004, from 6.7% to 3.0%. Participation in the other mode (unit-linked life-insurance) was higher in 2014 and 2010 than in 2004 (12.0% vs 8.8%). It is also instructive to contrast the distribution of financial wealth of stockholders with that of the general population (shown in Table 3). Stockholding in any of the three modes increases strongly with the level of financial wealth, especially among the richest (1%): in 2004, 74.7% owned stocks directly, 37.4% owned stocks in mutual funds and 52.0% owned stocks in life-insurance. A sizeable fraction of wealthy households, however, have no stocks. A stock participation puzzle can therefore be observed even among the richest.
Table 4 refers to stock ownership at the different dates according to financial wealth, whatever the mode of holding. Looking at trends over our sample period, stockholding participation in general was just under the 25% mark in 2004, but fell to 19.4% by 2014; this development is also reflected in each of the stockholding modes, except stocks in life insurance (cf. Table 3). Stock ownership diminished by around 20% over the period, but the rate of the decrease depends negatively on the level of financial wealth: -10.6% among the richest but -36.8% among the 25-50 percentiles.
Table 5 provides additional information on stock location by reporting the distribution of stockholders among all possible combinations of stockholding modes. In the period, the most popular choice of stockholders was to hold only stocks directly (36% of stockholders in all years). Second in popularity was the combination of only stocks in life insurance (28.8%% of stockholders in all years), while the least popular was the combination of stocks in life insurance with direct stockholding (14.0% of stockholders in all years). Use of all three modes was observed among very few people, less than 4% of households. Interestingly, the ranking of these options changed in 2014: by this date, a majority of households owned stocks only in life insurance contract (39.2%), more than those who held only stocks directly (30.2%).
4. Simple econometric models
The sample used in this empirical section corresponds to the households that answered to the “risk” questionnaire (including risk aversion and exposure measures). This sample is more limited than the general questionnaire. We have verified that this restriction did not lead to bias in the econometric estimates. More precisely, the households responding to the "risk" questionnaire are slightly older, more educated and generally richer than the representative sample (annex 2). Nevertheless, the differences do not appear significant, with the exception of the diploma level (fewer no education).
4.1 Determinants of financial products holding
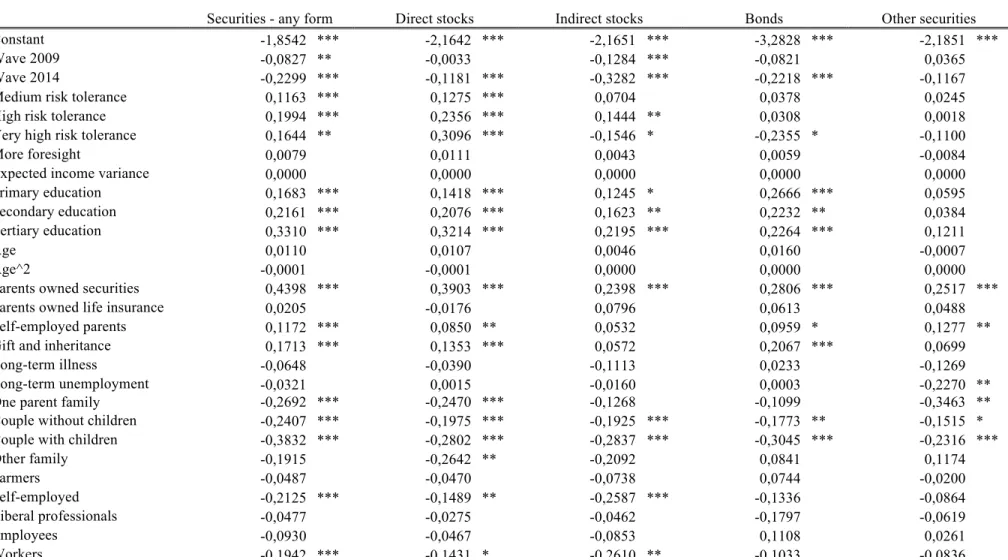
The ownership of financial instruments – whatever its support – is examined in a first step thanks to binary probit models. The endogenous variable is a binary variable taking the value ‘1’ if the household owns that financial instrument, ‘0’ otherwise. Our set of endogenous variables includes the following financial products: securities of any form, direct stocks, indirect stock, bonds, other securities; life insurance, stocks in life insurance and euros in life insurance.
We then explain the probability of having each product with respect to a vector of independent variables as compared to a reference situation. Our set of explanatory variables includes variables related to the household preferences (risk aversion, time preference, variance of expected income), the age, the squared age and the education level of the reference person, characteristics linked with the parents (the fact that parents owned securities or life insurance, the fact that they were self-employed), gifts and inheritances, life accidents (whether the household experienced long-term illness or unemployment in the past), the type of household, the employment status of the reference person5, and finally the quartile of
revenue and the decile of wealth the household belongs to. We also include a dummy variable
5 In the specification, inactive people are people under the age of working, students, people unable to work, housewives and
counting for the wave (2009 and 2014). For those explanatory variables that are categorical variables, reference categories have to be defined: wave 2004; low risk tolerance; no education; one-person household; executives, first quartile of revenue, first half of wealth.
The model can then be written as follows:
𝑃(𝑌!""#$ !"#$%&'() = 1|𝑋) = Φ 𝛼 + 𝑋!𝛽 (1) where:
𝛽 =
𝛽!"#$ !"#$%&'( 𝛽!"#$ !"#$#"#%&# 𝛽!"#$"%&' !"#!$%!& !"#$%&
𝛽!"# 𝛽!"!! .. . 𝛽!"#$%& 𝛽!"#$%! ! 𝑎𝑛𝑑 𝑋 = 𝑋!"#$ !"#$%&'( 𝑋!"#$ !"#$#"#%&# 𝑋!"#$"%&' !"#!$%!& !"#$%&
𝑎𝑔𝑒 𝑎𝑔𝑒^2 .. . 𝑋!"#$%& 𝑋!"#$%!
Models are estimated through likelihood maximisation and standard deviations are robust. Results are presented in Table 6. We find that, all other things kept equal, securities holding, whatever its form, has significantly decreased both in waves 2009 and 2014 with respect to 2004. This is especially true for indirect holding, while direct stockholdings and bond holdings have only decreased in wave 2014 with respect to wave 2004. In marginal terms (not presented in the tables), the decrease of the direct stocks ownership rate in 2014 with respect to 2004 reaches 3.2 percentage points6. For indirect stockholdings, the magnitude
is 1.5 and 3.5 percentage points in 2009 and 2014, respectively, relative to 2004.
Regarding household preferences, we find that higher risk tolerance is a key driver of stockholdings, with a monotonous effect of risk category on direct stockholdings. Quantitatively, having a medium, high, or very high risk tolerance increases the probability of direct stockholdings by 3.6, 6.9, and 9.4 percentage points, respectively, compared to the reference modality. It is more ambiguous for other securities; a very high risk tolerance may even exert a negative effect on bonds and indirect stock ownership. Other preference indicators do not appear significant.
Households whose parents owned securities are much more likely to own securities themselves, even controlling for having received gifts and inheritance, which may signal a positive effect on securities holdings, whatever its intrinsic nature, of being educated in a family with a higher financial literacy. The (positive) marginal effect is massive, reaching 11.9 percentage points for direct stockholdings. Households whose parents were
6 A Oaxaca-Blinder decomposition provides the quantification of effects resulting from differences in characteristics vs. differences in
coefficients (see Annex A3). The results indicate that between 2004 and 2009 the contribution of characteristics accounted for half of the securities ownership variance, while between 2004 and 2014 it was only 27%. This means that most of the differences stem from the economic environment, especially between 2009 and 2014 where the sovereign debt crisis (August 2011) added to the financial crises of September 2008.
employed have a higher probability of holding stocks directly, bonds or other securities. Gift and inheritances support direct stockholdings and bonds, with a marginal effect of 3.7 and 1.1 percentage points, respectively.
The coefficients associated with the family type are in general negative, meaning that stocks ownership is always significantly weaker than for the reference category, i.e. one-person households. Stock holdings do not significantly depend on the professional status of the household’s reference person, apart from workers whose category faces a significantly lower ownership rate, which reaches 3.7 percentage points for direct stockholdings.
Finally, as regards financial variables, we find a very intuitive result, showing that securities holdings increase with the level of total wealth and with revenue for direct and indirect stockholdings. The magnitude of the effect is extremely high, reaching, for direct stockholdings, 16.3 percentage points for the fourth quartile of revenues and 44.1 percentage points for the highest decile of wealth with respect to the reference category.
In order to better understand the developments in securities holdings over time, we carry out the same estimation but on each sample wave separately. Results are presented in Table 11. A striking result which may explain why securities holdings have decreased over time rests on the fact that securities moved towards households with higher risk tolerance and more foresight, and with higher education levels. Securities holdings by liberal professionals also became lower in 2014, while the magnitude of the wealth class on securities holdings increased progressively. What is true for securities holdings as a whole is also observable for stockholdings in particular (Table 12). An interesting result rests also on the fact that in the course of the wave 2014, income did not play a significant role in stockholding, meaning that households with higher revenues may have decided not to invest in stocks but rather in less risky financial products for precautionary reasons.
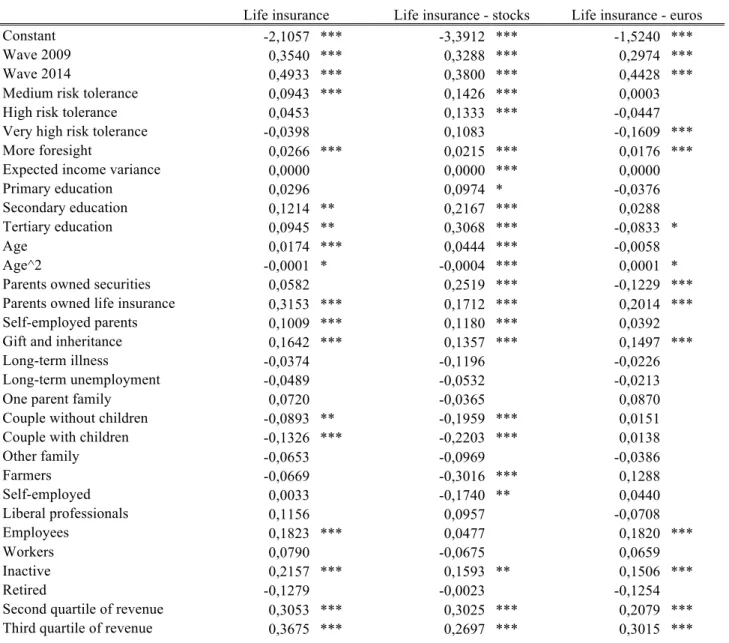
Determinants of life insurance ownership are significantly different from the ones of stockholdings, especially as regards investments in euros. We run the same regressions, but the endogenous variable is life insurance ownership (results presented in Table 7). First, we find that life insurance ownership is significantly higher in wave 2009 and wave 2014, in comparison with wave 2009. In magnitude, all other things kept equal, the probability of having a life insurance contract is 13.9 and 19.5 percentage points higher in 2009 and 2014, respectively.
Life insurance is a financial instrument dedicated to households with low time preference whatever the final product (stocks or euros) and with lower risk tolerance as a whole, but with differences on the final support: while higher risk tolerance households tend to choose stocks, on the contrary, it plays a negative role on having euros investments. The higher the education, the higher life insurance ownership as a whole, again with inverse effects on stocks and euros. Households whose parents used to hold securities exhibit a higher probability of
owning stocks in life insurance themselves, and a lower probability of owning euros in life insurance, even controlling for gifts and inheritances. This may be due to the knowledge of financial products they received from their education. In addition, supporting the later result, having parents who hold life insurance increases the probability of having a life insurance contract by 12.4 percentage points. Revenues play a positive role on life insurance ownership, quite similar with respect to the final product, while wealth increases more stocks in life insurance holdings than euros. Interestingly, we find that stockholding included in a life insurance product tends to be held by households whose risk tolerance is intermediate, by comparison with those holding stocks directly.
Time-varying estimations (results presented in Table 13) show that while high risk tolerance had a positive effect on life insurance ownership in 2004, the effect is inverted in 2009 and absent in 2014, which shows that life insurance was progressively privileged by more households, whatever their risk aversion. In particular, households with low time preference and higher expected income variance hold more life insurance in 2004. Receiving gifts and inheritances increase the probability of having life insurance by 7 percentage points in 2014, while it was only 3.4 percentage points in 2004. In addition, while having parents who own securities had no effect in 2004 and 2009, it increased the probability of having life insurance by 5 percentage points in 2014, meaning that even households accustomed to an environment favourable to securities or informed about securities tended to invest more in life insurances. As for securities ownership, the wealth effect reinforced progressively: in 2014, the probability of having life insurance for the last decile of wealth is 32.3 percentage points higher than for the first half of the wealth distribution.
4.2 Determinants of financial products demand
Until now, the estimations have only explained the probability of having certain types of financial products. It is also interesting to identify the determinants of the demand for each product conditional on holding it. For this purpose, we estimate a Heckman (1976) sample selection model using the two-step method with robust standard deviations. The first step evaluates the probability of holding each financial product using exactly the same explanatory variables as in the previous subsection (equation 1). In the second step, the variable to explain is the fraction of each financial product in the total financial wealth, conditional on ownership. This second step is written
𝑆𝐻𝐴𝑅𝐸/!"#$%&!!"!! = 𝛼 + 𝑋!𝛿 + 𝑖𝑛𝑣𝑒𝑟𝑠𝑒 𝑜𝑓 𝑀𝑖𝑙𝑙!𝑠 𝑟𝑎𝑡𝑖𝑜 + 𝜀 (2) where:
𝛿 =
𝛿!"#$ !"#$%&'( 𝛿!"#$ !"#$#"#%&# 𝛿!"#$"%&' !"#!$%!& !"#$%&
𝛿!"# 𝛿!"!! .. . 𝛿!"#$%& 𝛿!"#$%! ! 𝑎𝑛𝑑 𝑋 = 𝑋!"#$ !"#$%&'( 𝑋!"#$ !"#$#"#%&# 𝑋!"#$"%&' !"#!$%!& !"#$%&
𝑎𝑔𝑒 𝑎𝑔𝑒^2 .. . 𝑋!"#$%& 𝑋!"#$%!
The vector of explanatory variables for the second step equation includes variables related to the household preferences (risk aversion, time preference, variance of expected income), the age, the squared age and the education level of the reference person, characteristics linked with the parents (the fact that parents owned securities or life insurance, the fact that they were self-employed), gifts and inheritances, and finally the quartile of revenue and the decile of wealth the household belongs to. We also include a dummy variable counting for the wave (2009 and 2014). For those explanatory variables that are categorical variables, reference categories have to be defined: wave 2004; low risk tolerance; no education; first quartile of revenue, first half of wealth. It is important to consider whether valuation effects might blur the results: the evidence provided in Figure 1 shows that the value of the main stock index in France, although it proved rather volatile over the period, reached a similar level in late 2009 and late 2014, that is to say at the fieldwork periods.
Regarding securities (see results presented in Table 8), we find that the fraction of financial wealth invested in securities did not decrease overall between 2004 and 2009, but did significantly in 2014, with a reduction of the direct stockholdings fraction by 3.3 percentage points in 2014 with respect to 2004. The reduction is even stronger for indirect stock holdings (cut by 7.2 percentage points of financial wealth between 2014 and 2004). We found that while high and very high risk tolerance supported stocks ownership, we also find that, conditionally of having stocks, it also substantially enhances the fraction of wealth invested in direct stocks, by about 9 percentage points for households with the highest risk tolerance. In addition, low time preference significantly decreases the fraction of direct stocks. Education level increases the share of securities in financial wealth. Investment practices by parents play an intuitive but persistent role: households whose parents held securities invest more in securities and especially in direct stocks, while households whose parents own life insurance invest less in securities. Nevertheless, the effect disappears when looking at indirect stocks investment. Surprisingly, and contrary to the case of holdings, revenues and wealth do not play a role in the demand for securities, although a positive effect at the very top of the wealth distribution is observed.
As far as investment in life insurance is concerned, we find a significant increase in 2009 with respect to 2004. Higher education level decreases the share of life insurance in wealth, and especially that of euro instruments. Households whose parents held securities tend to invest relatively less in euros, but not in stocks. Households with higher revenues who invest in insurance invest a smaller share of their wealth in it, whatever the final product, than households in the first quartile of revenue.
5. Explaining stocks portfolio
Although direct stockholding, stock mutual funds, and stock in life insurance all expose households to stockholding risk, they vary in their diversification properties, liquidity, taxes and informational requirements on the part of investors. Given these differences, it is quite plausible that specific household characteristics will have differential contributions to participation across stockholding modes. In this Section, we employ our model to estimate contributions of various household characteristics to the use of each possible stockholding mode, controlling for other observed factors.
5.1 The econometric model
We estimate a behavioural model of household stock investment that features the following decision process. Households face three (not mutually exclusive) investment choices: direct stockholding, investment in mutual funds and stocks in life insurance (§ 3.3). This model corresponds to the traditional portfolio choice model in which a household chooses the composition of its wealth simultaneously between all different assets available on the financial market. This model is estimated with a trivariate probit.
In this specification, the probability of observing choice Yj for j=1…3 corresponding to the
different investment choices in risky assets, is written as:
𝑃(𝑌!|𝑋!𝜃, Σ) = 1!∗∈!Φ 𝑦!∗ 𝑋!𝜃, Σ d𝑦!∗
Where A=A1*A2*A3 and
𝐴! = −∞, 0 𝑦! ∗= 0 0, ∞ 𝑦!∗ = 1
In the regression, we introduce conditioning variables that have been found in the literature to be good predictors of stockholding and to be coherent with portfolio choice theory. With these variables, we want to test the importance on stock ownership of holding costs (wealth in deciles, income in quartiles), of information costs and financial literacy (age, social status, wealth composition of the parents and education), the role of other risks (future income risk, family risk, professional risk proxied by the existence of unemployment periods in the present or in the past, health risk measured by the existence of a big health problem in the past), and the importance of individuals’ preferences (risk aversion in four positions according to the
methodology of Barsky et al., 1994, and time preference with a Likert scale in 10 positions). We introduce wealth and income through the position of the household in the distributions to avoid the problems of actualisation. We have also introduced dummies indicating the year of the survey to capture the effects of institutional change, tax reform or non-explained behavioural change during the period 2004-2014. In particular, this period saw the subprime crisis in 2008, the sovereign debt crisis in 2011, the 2013 tax reform on equities, and so on.
5.2 Results
Table 10 corresponds to the estimation of the trivariate probit models. First, we can observe that even when we control by individuals’ characteristics, the effect of the time dummy observed on descriptive statistics is always significant: direct stockholding decreases by 3 percentage points between 2004 and 2014, stocks through mutual funds by 3.5 over the same period, and unit-linked life-insurance increases by 9.6 percentage points over the ten years. We can therefore conclude that a part of the decrease in stock participation between 2004 and 2014 is due to the upheaval in the economic and financial environment in 2008 and 2011, or to tax reforms in 2013, and cannot be explained simply by changes in the structure of the population.
Direct stockholding
In the first column of Table 10, we present effects for direct stockownership. Direct stockholding requires considerable financial sophistication, and the ability to process complex information and holding costs are heavier for this mode. Moreover, dividends and capital gains on stocks directly are taxable, through a flat tax until 2013 and a progressive marginal tax thereafter.
The most important contribution to direct stockholding comes from the level of gross wealth. Marginal effects show that being in the top decile raises participation probability by more than 44 percentage points over households under the median (the predicted probability at means is equal to 19.4 percentage points). In the same way, belonging to the third quartile of total income increases participation probability by more than 16 percentage points over households belonging to the first quartile. This result is likely linked to the great importance of holding and management costs in investing in direct stocks.
Willingness to undertake substantial risk also makes a sizeable contribution: belonging to the group of less risk averse households increases the probability of investing in stocks directly by 9.4 percentage points. As predicted by the standard portfolio choice theory, risk aversion is an important determinant of demand for risky assets. Moreover, for a given level of resources and willingness to take portfolio risk, background income risk (measured by the variance of future income) lowers the chances of direct stockholding.
Another important contribution to direct stockholding comes from having a college degree, which raises participation probability by more than 9 percentage points over that of a
high-school dropout. This result is likely linked to the superior knowledge and information processing ability provided by college education. Participation in direct stockholding is further increased by about 12 percentage points if a household member has parents that hold or have held securities. This finding likely arises partly from financial knowledge and information that this member accumulated from his family
A less important but significant effect relates to the importance of family risks: being single without children increases participation probability by about 6 percentage points compared to all other family configurations. Finally, we note the estimated marginal effects of a variable linked to bequest motives, where having received inheritance contributes about 4 percentage points. Those who want to leave a bequest to their children invest more often in direct stocks, perhaps for fiscal motivations (capital gains are taxed only at realisation).
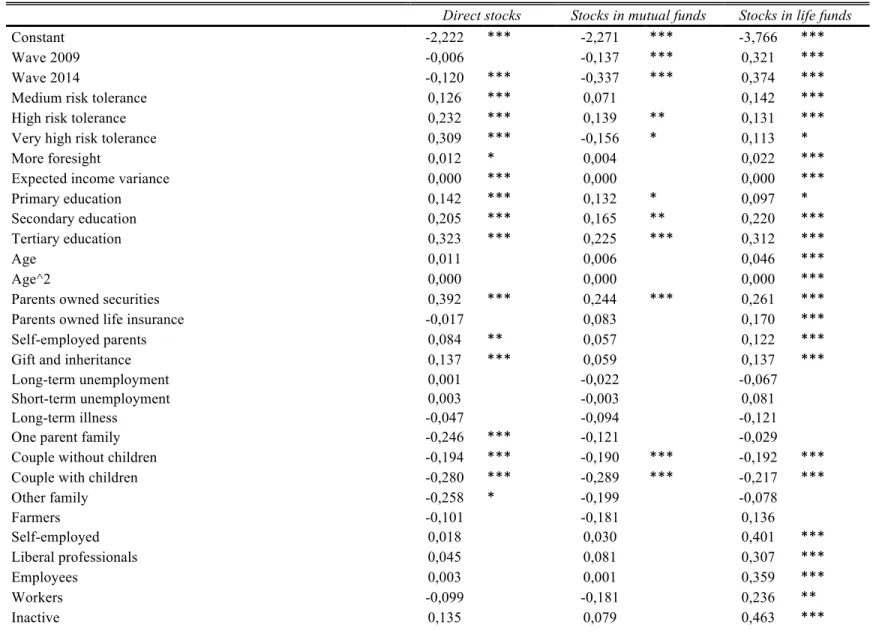
Indirect stockholding through mutual funds
Unlike direct stockholding, mutual funds are typically managed by professionals and are well-diversified, and so are less risky than direct stockholding. Consequently, it is possible that mutual fund investments are open to more and different households than direct stockholding because they do not require considerable financial literacy and information gathering, and correspond to people who are less risk averse. Results in Column 3 of Table 10 show that our findings are consistent with this hypothesis.
For stockholding through mutual funds, the estimated marginal effects for some key variables are less important quantitatively than those for direct stockholding: being in the top decile of wealth raises participation probability by more than 21 percentage points over households under the median; belonging to the third quartile of total income increases participation probability by 3.7 percentage points over households belonging to the first quartile; having a college degree raises participation probability by more than 2.9 percentage points over that of a high-school dropout. We could therefore conclude that holding stock through mutual funds implies less transaction costs and less education than for holding direct stockholding. The biggest difference, however, concerns the effect of risk aversion: people who are more risk tolerant invest less in mutual funds (-1.6 percentage point) than people who are more risk averse.
Stockholding in life insurance contracts
The use of life insurance and retirement savings as supplements to public pensions appears to be a policy priority because of the ageing of the population and the associated increased ratio of retirees to working contributors to the public pension system.
Marginal effects for ownership of unit-linked life-insurance are shown in Column 6 of Table 10. Richer households are substantially more likely to hold stocks in life-insurance contracts: +37 pp for top decile relative to households under the median. Moreover, households in the fourth quartile of income have a probability of 8 percentage points higher
than those in the first quartile and those who have inherited increase it by 3 percentage points. These results can be partly attributed to gains such households could reap from tax exemption (on income and on bequests).
The estimated size of the marginal effect of a college degree is 8 percentage points compared to a household where the head is a high-school dropout. It is also notable that having parents who own (or owned) equities and life insurance in their wealth increases the probability of participation in unit-linked life-insurance by 6 percentage points for equities and 4 percentage points for life insurance.
Willingness to undertake risk also makes a small but significant contribution: to belong to the group of the most risk averse households decreases the probability of investing in unit-linked life-insurance from about 3 percentage points. Moreover, for a given level of resources and willingness to take portfolio risk, background income risk (measured by the variance of future income) lowers the chances of direct stockholding. The marginal effect of family composition is also significant: being in couples, with or without children, decreases participation probability by about 4 percentage points compared to all other family configurations.
Unlike direct or indirect stockholding, age, social category and time preference have significant effects on the probability of holding unit-linked life insurance. The effect of age is concave with a maximum around 57 years old. In addition, farmers and self-employed individuals are less likely to have life insurance than other social groups. Finally, foresighted individuals more often hold this mode of stocks, with 5 percentage points between the more and less impatient people.
It appears that another dimension besides risk-return explains investments in stocks on unit-linked life insurance contracts. It is that of a long-term savings to finance retirement needs. Indeed, the profile of the holders corresponds to foresighted individuals, near retirement age, salaried or professional. Nevertheless, in order to invest in this mode, investors show a certain tolerance for risk (which brings them closer to direct stocks investors) and benefits from tax advantages.
Correlations between unobserved factors
Our multivariate probit not only distinguishes between different stockholding modes but also allows choices of stockholding vehicles to be correlated through the influence of unobserved factors. Such correlations among investment decisions can arise because of factors common to all of them, such as an understanding of financial information or stockholding risks, the influence of other preference parameters (ambiguity or loss aversion, for example), common financial advice, etc. When we test for the joint significance of all cross-equation correlations, we find that we can decisively reject the null of no significance.
When we test for statistical significance of each possible correlation individually, we find all estimates of such correlations to be individually statistically significant (see table 10).
5.3 Additional results
In order to test the robustness of our results and to refine our conclusions, we have conducted a set of additional regressions. We assume that households decide first to hold stocks or not, whatever the mode of holding. In a second step, if the household decided to be a stockowner, it chooses among the three different modes (not mutually exclusive).
The estimation of conditional demands confirms the previous conclusions concerning the specific characteristics of the owners of the different types of stocks (direct, indirect, or on life insurance): those who invest directly in stocks are richer, more educated and less risk averse; those who hold mutual funds are a little richer but more risk averse and do not appear the most educated; finally, for ownership in stocks on life insurance contracts, the position in the life cycle plays an important role, as well as the social category.
6. Conclusions
In our paper, we assess the extent to which the factors explaining the holding of risky financial assets have changed through the financial crisis. We rely on the data collected in surveys conducted among French households during the period 2004-2014. We show that the holding of risky assets and of individual direct shares decreased during the period, especially between 2009 and 2014. At the end of the period, the profile of direct equity holders was refocused towards profiles with greater risk tolerance. Other common risk factors include: better education, donations and inheritances, parents holding securities, singles, high-income households and high-wealth groups. Conditionally on holdings, the proportion of risky assets increases with risk tolerance and the holding of securities by parents. It also decreases at the end of the period. Finally, our paper shows that shareholders have gradually moved towards preferential ownership of shares in life insurance rather than direct share ownership or holding through mutual funds, especially between 2009 and 2014.
Econometric analysis also shows the specific characteristics of the owners of the different types of stocks (direct, indirect or on life insurance): those who invest directly in stocks are richer, more educated and less risk averse; those who hold mutual funds are a little richer but more risk averse and do not appear the most educated; finally, for ownership in stocks on life insurance contracts, the position in the life cycle plays an important role, as well as the social category.
At a time when the savings of French households in particular seem to be oriented towards risk-free assets, it is important to understand the stakes and the means of redirecting this
saving more towards the financing of the economy. Our paper makes it possible first to qualify the observation generally made of a decline in the holding of shares by French households: first, all other things being equal, the purely temporal effect of this decline materialised between 2009 and 2014 as the risk preferences of the holders have shifted to more risky profiles; secondly, for holders of shares in the broad sense, whether intermediated or not, a movement has begun in favour of holding shares in life insurance rather than direct holding.
Encouraging the ownership of risky assets by households requires a better understanding of this type of trade-off (widening towards households more risk averse or having different temporal preferences, understanding the effect of insurance intermediation on detention behaviours, tax policies). In any case, improved (financial) education, greater flexibility in the donation process, and increased confidence among households are promising avenues for investing their long-term savings in more risky assets.
References
Arrondel L. and Masson A. (2014a), Épargne and espérance de vie. Quels produits, quelle
fiscalité ?; English version: Savings and Life Expectancy: Which Products and Taxation?, Opinions &
Débats, No. 14, Institut Louis Bachelier, 112 p.
Arrondel L. and Masson A. (2014b), "Mesurer les préférences des épargnants: comment and pourquoi (en temps de crise) ?", Economie and statistique, 467-468, pp. 5-49.
Arrondel, L., L. Bartiloro, P. Fessler, P. Lindner, T. Y. Mathä, C. Rampazzi, F. Savignac, T. Schmidt, M. Schürz and P. Vermeulen (2016), How do households allocate their assets? – Stylized facts from the Eurosystem Household Finance and Consumption Survey, International Journal of
Central Banking, June/2016, 129-220.
Arrondel L., Calvo Pardo H., and Tas D. (2012), "Subjective Stock Market Expectations, Information and Stock Market Participation: Evidence from France", NBER Summer Institute Economic Fluctuations and Growth.
Arrow, K.J. (1965), Aspects of the Theory of Risk Bearing, Yrjö Johnson Lectures, Helsinki. Barberis, N., Huang M. and Thaler, R. (2006), "Individual Preferences, Monetary Gambles, and Stock Market Participation: A Case for Narrow Framing", American Economic Review, 96, 1069-1090.
Barsky, R.B., Kimball, M.S., Juster, F.T. and Shapiro, M.D. (1997), "Preference Parameters and Behavioral Heterogeneity: An Experimental Approach in the Health and Retirement Survey",
Quarterly Journal of Economics, 112 (2), pp. 537-580.
Benartzi S., (2001), “Excessive extrapolation and the allocation of 401(k) accounts to company stock”, Journal of Finance, 56 (2001), pp. 1747–1764.
Bodie, Z., R.C. Merton and W.F. Samuelson (1992), “Labor supply flexibility and portfolio choice in a life cycle model”, J. of Economic Dynamics and Control, 16(3-4), pp. 427-449.
Bossaerts, P. Ghirardato, S. Guarnaschelli and W. Zame, (2010), “Ambiguity in asset markets: theory and experiment”, Review of Financial Studies, 23, 1325–1359.
Campbell, J., and L. Viceira (2002), Strategic Asset Allocation: Portfolio Choice for Long-Term Investors, Clarendon, Lectures in Economics, Oxford University Press.
Cocco, J. (2004), “Portfolio Choice in the Presence of Housing”, Review of Financial Studies, 18(2), pp. 535-566.
Cochrane, J.H. (2005), Asset Pricing, Princeton, NJ: Princeton University Press.
Christelis, D., D. Georgarakos, and M. Haliassos (2011), “Stockholding: Participation, Location, and Spillovers”, Journal of Banking and Finance, 35, pp. 1918–30.
Crainich D., Eeckhoudt L. and Rey B. (2011), « À propos de la tempérance », Revue économique, 62, 751-764
Dohmen, T., Lehmann, H. and Pignatti, N. (2016), “Time-varying individual risk attitudes over the Great Recession: A comparison of Germany and Ukraine”, Journal of Comparative Economics, 44, 1, 182–200
Dominitz, J. and C. Manski (2007), “Expected Equity Returns and Portfolio Choice: Evidence from the Health and Retirement Study”, Journal of the European Economic Association, 5, 369-79.
Dominitz, J. and C. Manski (2011), 'Measuring and Interpreting Expectations of Equity Returns,'
Journal of Applied Econometrics, 26: 352-370.
Ellsberg, D. (1961), “Risk, Ambiguity, and the Savage Axioms”. Quarterly Journal of Economics, 75, 643–669.
Epstein L.G. and M. Schneider, (2010), “Ambiguity and asset markets”, Annual Review of
Financial Economics, 2, 315–346.
Fama E.F. (1970), “Efficient Capital Markets: A Review of Theory and Empirical Work”, The
French K.R. and J.M. Poterba 1991), “Investor diversification and international equity markets”,
American Economic Review, 81, 222–226
Gollier, C. (2001), The Economics of Risk and Time, MIT Press, Cambridge. Gollier C., (2013), "Édito", Les cahiers Louis Bachelier, No.8, February.
Grinblatt, M., M. Keloharju and J. Linnainmaa (2011), “IQ and Stock Market Participation”, The
Journal of Finance, 66(6), 2121-64.
Guiso, L. and T. Jappelli (2005), “Awareness and Stock Market Participation”, Review of Finance, 9, 537-567.
Guiso L. and Jappelli T. (2007), "Information Acquisition and Portfolio Performance," Economics Working Papers ECO2007/45, European University Institute
Guiso, L., Sapienza, P. and L. Zingales (2008), “Trusting the stock market”, The Journal of
Finance, 63, 2557-2600.
Guiso, L., Sapienza, P. and Zingales, L. (2014), “Time varying risk aversion”, NBER Working Papers 19284, National Bureau of Economic Research, Inc.
Guiso, L. and Sodini, P. (2012), Household Finance: An Emerging Field, CEPR Discussion Paper No. DP8934
Haliassos, M. (2003), "Stockholding: Recent Lessons from Theory and Computations", in Guiso, L., M. Haliassos, and T. Jappelli (Eds.), Stockholding in Europe, Palgrave Macmillan Publishers, 30-51.
Hamayon, S., Legros, F. and Pradat, Y., (2016), "Non gaussian returns: which impact on default options retirement plans?", Review of Accounting and Finance, 15, 4.
Hong, H., Kubik, J.D., and J.C. Stein (2004), “Social Interaction and Stock Market Participation”,
The Journal of Finance, 59, 137-163.
Hudomiet, P., Kézdi, G. and R. J. Willis (2011), 'Stock Market Crash and Expectations of American Households,' Journal of Applied Econometrics 26(3): 393-415.
Hurd, M., Van Rooij, M. and Winter, J. (2011), “Stock market expectations of Dutch households”,
Journal of Applied Economics, 26, 416–436.
Jouini, E., S. Benmansour and C. Napp (2006), “Is there a “pessimistic” bias in individual beliefs ? Evidence from a simple survey”, Theory and Decision, 61(4), 345-362.
Kahneman D. and Tversky A. (1979), "Prospect Theory: An Analysis of Decision under Risk",
Econometrica, 47, pp. 263-291.
Kahneman D., Thinking, Fast and Slow, Farrar, Straus & Giroux.
Kézdi, G. and R. J. Willis (2009), “Stock Market Expectations and Portfolio Choice of American HouseHolds”, mimeo.
Kimball, M. (1993), “Standard Risk Aversion”, Econometrica, 61:3, 589-611.
King, M. and J. Leape (1998), “Wealth and Portfolio Composition: Theory and Evidence”, Journal
of Public Economy, 69:2, 155-193.
Kocherlakota, N. R. (1996), “The Equity Premium: It's Still a Puzzle”, Journal of Economic
Literature, 34 (1): 42–71.
Lusardi, A. (ed.) (2009), Overcoming The Saving Slump: How to Increase the Effectiveness of
Financial Education and Saving Programs, Chicago, University Of Chicago Press.
Lusardi, A. and O. Mitchell (2014), “The Economic Importance of Financial Literacy: Theory and Evidence”, Journal of the Economic Literature, 52 (1), p5-44.
Malmendier U. and Nagel A. (2011), "Depression Babies: Do Macroeconomic Experiences Affect Risk-Taking?", Quarterly Journal of Economics, 126(1), p. 373-416.
Mehra, R. and E.C. Prescott (1985), « The Equity Premium: A Puzzle », Journal of Monetary
Economics, 15 (2): 145–161.
Merton, R. C. (1971), ''Optimal Consumption and Portfolio Rules in a Continuous Time Model'',
Modigliani F. (1986), "Life Cycle, Individual Thrift and the Wealth of Nations", American Economic Review, vol. 76 (3), 297-313.
Necker, S. and Ziegelmeyer, M. (2016), “Household risk taking after the financial crisis”,
Quarterly Review of Economics and Finance, 59, 141-160.
Pesaran M. and M. Weale (2006), “Survey Expectations”», Chapter 14, in Handbook of Economic
Forecasting, Volume 1, 715–776
Sahm, C. (2012), “How much does risk tolerance change?”, Quarterly Journal of Finance, 2, 141-160.
Tversky A. and D. and Kahneman (1974), “Judgment under Uncertainty: Heuristics and Biases”,
Science, 27, 1124-1131.
van Rooij, M., A. Lusardi and R. Alessie (2011), “Financial Literacy and Stock Market Participation”, Journal of Financial Economics, 101, 449-472.
Viceira, L. (2001), “Optimal Portfolio Choice For Long-Horizon Investors with Non- tradable Labor Income”, The Journal of Finance, 56:2, 433-470.
Vissing-Jorgensen A. (2003), “Perspectives on behavioral finance: does ‘irrationality’ disappear with wealth? Evidence from expectations and actions”, in NBER Macroeconomics Annual, Gertler M, and Rogoff K (eds). MIT Press: Cambridge, MA; 139–194.
Weber M., Weber E. and Nosi A. (2013), "Who Takes Risks When and Why: Determinants of Changes in Investor Risk Taking", Review of Finance, 17(3), p. 847-883.