HAL Id: hal-01560240
https://hal-univ-rennes1.archives-ouvertes.fr/hal-01560240
Submitted on 11 Jul 2017
HAL is a multi-disciplinary open access
archive for the deposit and dissemination of
sci-entific research documents, whether they are
pub-lished or not. The documents may come from
L’archive ouverte pluridisciplinaire HAL, est
destinée au dépôt et à la diffusion de documents
scientifiques de niveau recherche, publiés ou non,
émanant des établissements d’enseignement et de
Signature of Microbial Dysbiosis in Periodontitis
Vincent Meuric, Sandrine Le Gall-David, Emile Boyer, Luis Acuña-Amador,
Bénédicte Martin, Shao Bing Fong, Frédérique Barloy-Hubler, Martine
Bonnaure-Mallet
To cite this version:
Vincent Meuric, Sandrine Le Gall-David, Emile Boyer, Luis Acuña-Amador, Bénédicte Martin, et al..
Signature of Microbial Dysbiosis in Periodontitis. Applied and Environmental Microbiology, American
Society for Microbiology, 2017, 83 (14), pp. e00462-17 �10.1128/AEM.00462-17�. �hal-01560240�
Signature of microbial dysbiosis in periodontitis.
1
Vincent Meuric, DDS, PhD1, 2#, Sandrine Le Gall-David, PhD2, Emile Boyer1, 2, Luis
Acuña-2
Amador3, Bénédicte Martin, PhD2, Shao Bing Fong, PhD2, Frederique Barloy-Hubler, PhD3 and
3
Martine Bonnaure-Mallet, DDS, PhD1, 2.
4 5
1 – CHU Rennes, Pôle Odontologie, Rennes, France. 2 – Université de Rennes 1, EA 1254 – 6
Inserm 1241 Equipe de microbiologie – Rennes, France. 3 – CNRS-UMR6290-IGDR, Rennes, 7
France. 8
9
Running Head: Dysbiosis in Periodontitis 10
11 12
# Address correspondence to Vincent Meuric: vincent.meuric@univ-rennes1.fr 13
M.B.M. and F.B.H. contributed equally to this work. 14
15
Keywords: chronic periodontitis – health – microbiota – dysbiosis – ratio 16
Abstract
17
Periodontitis is driven by a disproportionate host inflammatory immune response induced 18
by an imbalance in the composition of oral bacteria. It instigates microbial dysbiosis along 19
with failed resolution of the chronic destructive inflammation. 20
The objective of this study is to identify microbial signatures for health and chronic 21
periodontitis at the genus level and to propose a model of dysbiosis including the calculation 22
of bacterial ratios. 23
Design and methods. Published sequencing data obtained from several different studies 24
(196 sub-gingival samples from patients with chronic periodontitis and 422 sub-gingival 25
samples from healthy subjects) were pooled and submitted to a new microbiota analysis 26
using the same VAMPS (Visualization and Analysis of Microbial Population Structures) 27
analysis pipeline to identify microbiota specific to health and disease. Microbiota were 28
visualized using CoNet and Cytoscape. Dysbiosis ratio, defined as the percentage of genera 29
associated with disease relative to the percentage of genera associated with health, were 30
calculated to distinguish disease from health. Correlation between the proposed dysbiosis 31
ratio and the periodontal pocket depth was tested on a different set of data obtained from a 32
recent study to confirm the relevance of the ratio as a potential indicator of dysbiosis. 33
Results. Beta diversity showed significant clustering of periodontitis-associated microbiota 34
according to clinical status at the genus level, independent of methods used. Specific genera 35
were highly prevalent (>95%) in health (Veillonella, Neisseria, Rothia, Corynebacterium and 36
Actinomyces) while other genera were associated with chronic periodontitis (Eubacterium,
37
Campylobacter, Treponema and Tannerella). The calculation of dysbiosis ratio based on the
38
relative abundance of these genera found in health versus periodontitis was tested. Non-39
periodontitis samples were significantly identifiable by low ratios as compared to chronic 40
periodontitis samples. When applied to a sub-gingival set with well-defined clinical data, the 41
method showed a strong correlation between the dysbiosis ratio, as well as a simplified ratio 42
(Porphyromonas, Treponema and Tannerella to Rothia and Corynebacterium), and pocket 43
depth. 44
Conclusion. Microbial analysis of chronic periodontitis can be correlated with the pocket 45
depth through specific signatures of microbial dysbiosis. 46
47
Importance
48
Defining microbiota typical of oral health or chronic periodontitis is a difficult task. 49
Periodontal disease evaluation is currently based on probing of the periodontal pocket. 50
However, the status of pockets “on the mend” or sulci at “risk of periodontitis” cannot solely 51
be addressed through pocket depth measurements, nor by current microbiological tests 52
available for practitioners. Thus, a more specific microbiological status of dysbiosis could 53
help in future diagnoses of periodontitis. In this work, data from different studies were 54
pooled to improve the accuracy of the results. However, analysis of multiple microbiota from 55
different studies intensified the bacterial network and complicated the search for 56
reproducible microbial signature. Despite different methods used in each study, the 57
microbiota investigated at the genus level showed that some genera are prevalent (up to 58
95% of the samples/microbiota) in health or disease, allowing the calculation of bacterial 59
ratios (i.e. dysbiosis ratios). The correlation between the proposed ratios and the 60
periodontal pocket depth was tested which confirmed the link between dysbiosis ratios and 61
the severity of the disease. The importance of this work is promising but longitudinal studies 62
will be required to improve the ratios and define microbial signatures of the disease, which 63
will allow the monitoring of the periodontal pocket recovery and conceivably, the potential 64
risk of periodontitis in healthy patients. 65
Introduction
66
Chronic periodontitis (CP) is a chronic inflammation characterized by alveolar bone loss with 67
intermittent periods of remission and relapse. CP is currently considered as an infection 68
mainly due to an increase of bacteria in the sulcus leading to the formation of a periodontal 69
pocket (for review: 1, 2). The major pathogen linked to CP is Porphyromonas gingivalis with 70
bacterial partners like Treponema denticola and Tannerella forsythia. These three bacteria 71
have been considered as the major pathogenic “red complex” since 1998 (3). However, 72
recent advances from metagenomics studies developed a new model of periodontal disease 73
pathogenesis. CP does not result from individual pathogens but rather from polymicrobial 74
synergy and dysbiosis (4) associated with a dysregulated immune response inducing 75
inflammation-mediated tissue damage (5). Host genetic components have also been 76
implicated in CP, where multiple genes contribute cumulatively to the hosts overall disease 77
risk (or protection) through effects on the host immune response and the microbiome (6). 78
Since the Human Microbiome Project (HMP) (7), microbiota were analyzed based on partial 79
sequencing of the 16S rRNA gene with different numbers of healthy and CP samples. 80
However, comparison between studies is difficult because of the differences in methods 81
used (i.e. clinical examination and diagnosis of periodontitis and oral health, sample 82
collection protocols, DNA extraction protocols, hyper variable regions of the 16S rRNA gene 83
analyzed). As there is a growing interest in the human microbiome, despite the difficulties 84
mentioned earlier, the use of independent studies to look for “Signal in the Noise” should 85
proceed as previously suggested (8), by reanalyzing all data with the same protocol. The 86
difference between periodontal health- and disease-associated microbiota should be larger 87
than the technical variations of the different studies and enable the identification of 88
microbial signatures using NGS technologies. The first objective of this study was to explore 89
the disease-associated changes in the sub-gingival microbiota using a unique VAMPS 90
(Visualization and analysis of microbial population structure) pipeline (9) at the genus level 91
for beta-diversity (Bray-Curtis dissimilarity) on a large number of samples (from 6 different 92
studies) and to confirm that the microbiota identified did not cluster according to the 93
methods used (primer or study type). Sub-gingival microbiota from patients with diagnosed 94
chronic periodontitis (196) and from healthy subjects (422) were included as well as external 95
control samples (from dentine caries, supra-gingival plaque and the mid-vagina). The second 96
objective was to determine a dysbiosis ratio of bacteria that could predict health or severity 97
of the disease from the sub-gingival samples and finally to test it on an independent cohort 98
of patients with well-described periodontal pocket measurements. 99
MATERIAL and METHODS
100
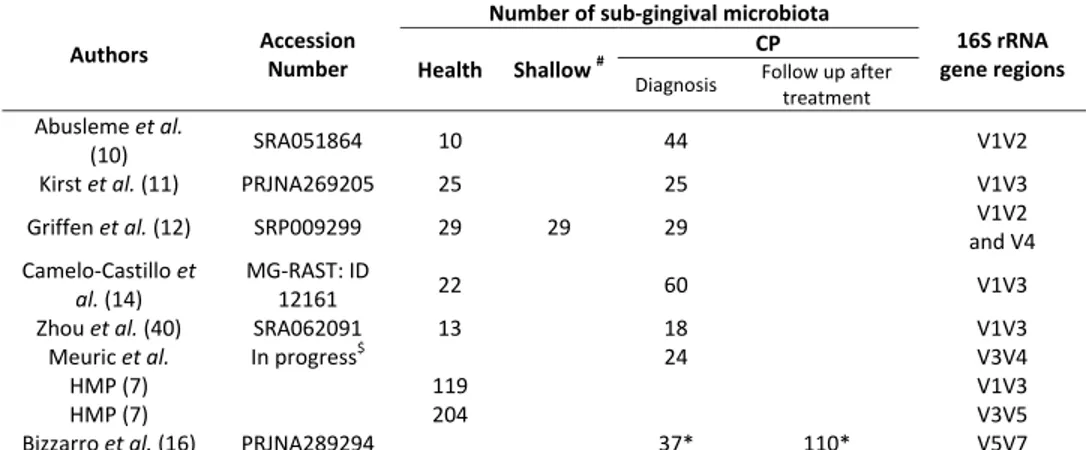
Microbiome datasets for comparison. Read sequences from healthy and chronic
101
periodontitis sub-gingival samples of five different studies i.e. Abusleme et al. (10), Kirst et 102
al. (11), Griffen et al. (12) (shallow site samples also included), Zhou et al. (13), and
Camelo-103
Castillo et al. (14) were retrieved from either the NCBI Sequence Read Archive (SRA), or 104
the MG-RAST server (Table 1). Twenty-four samples analyzed using V3V4 primer from 105
patients with chronic periodontitis recruited between June 2010 and September 2011 at the 106
University Hospital (Rennes, France) were added (publication in progress). Each data set 107
was manually imported into VAMPS, while numerous healthy sub-gingival samples were 108
added from the HMP (2 different sub-gingival datasets using V1V3 and V3V5 primers 109
available in VAMPS (9), https://vamps.mbl.edu/). Three mouth control microbiota datasets 110
were used from the HMP (saliva and supra-gingiva, both V1V3 and V3V5 regions, available in 111
VAMPS) and dentine caries from Kianoush et al. (V3V4 regions, PRJEB5178) (15). One mid 112
vagina microbiome dataset from the HMP (V1V3 region, available in VAMPS) was used as an 113
external mouth control. 114
Finally, the dataset from Bizzarro S. et al. (16), containing well-described sample 115
pocket depth (from 2 to 8 mm) was used to independently challenge the relevance of the 116
dysbiosis ratio of bacteria involved in periodontitis. 117
118
Ecology diversity and taxonomy identifications. Reads from the different datasets were
119
analyzed using VAMPS using default parameters for taxonomy assignment to the genus level 120
through the GAST process using the RDP classification to produce the best taxonomic 121
assignment for each read. Reads identified as Archaea, Eukarya, Organelle and unknown 122
reads were excluded for further analysis. The frequency of each taxonomic assignment 123
in the dataset was reported as a percentage (number of reads assigned to a taxonomy 124
over total number of reads in the dataset). Alpha diversity as observed richness and 125
Shannon-Weaver index were determined from the raw data sets. Differences between 126
microbiota structures (beta-diversity) were assessed using principal coordinate analysis 127
(PCoA) 2D tree on the Bray-Curtis distance through VAMPS. Samples were divided into five 128
clusters (1 to 5), where visualizations were realized using Figtree software (v1.4.2) and 3D 129
PCoA plots were generated using Emperor software. Relative abundances were studied 130
when the average abundance was above 1% in at least one sample. Assessments of 131
significant patterns of microbial co-occurrence or mutual exclusion at the genus level were 132
performed using Cytoscape v3.2.1 (17) and the CoNet plugin (18). Only genera found in the 133
high majority, in at least 95%, of the healthy sub-gingival samples or the CP samples (from 134
the fifth cluster) are represented. 135
136
Dysbiosis calculations – ratios of bacteria: To measure the dysbiosis, a first ratio based on
137
the relative abundance of genera highly prevalent (>95%) in CP samples (Eubacterium, 138
Campylobacter, Treponema and Tannerella) to genera highly prevalent (>95%) in healthy
139
microbiota (Veillonella, Neisseria, Rothia, Corynebacterium and Actinomyces) was calculated. 140
The ratios were normalized between samples using GraphPad Prism V6 software before 141
comparison. A second simplified ratio of Porphyromonas, Treponema and Tannerella to 142
Rothia and Corynebacterium was also tested. When no specific genus was detected and as
143
“no detection” does not mean “absence”, a value of 0.1% was attributed. 144
145
Statistical analysis. Normality tests for data distribution were realized. Data were studied by
146
Spearman correlation test between biological origins, primers used, publication of sample 147
origins and microbiota clusters. Observed richness (S, number of taxa per sample), Shanon-148
Weaver index and dysbiosis ratio of the genera found in disease to the genera found in 149
health were analyzed with a non-parametric Anova Kruskal-Wallis test. Tests were carried 150
out using GraphPad Prism V6 software and were considered significant when p <0.05. The 151
significant patterns of microbial co-occurrence and mutual exclusion were analyzed as 152
described by Faust (18): a compilation of statistical analysis (Spearman, Pearson correlations 153
and Bray Curtis, Kullback-Leibler dissimilarity measures) was used with a threshold set at 0.5. 154
The data matrix was randomized by 100 row-wise permutations. The P values were adjusted 155
by Benjamini-Hochberg false discovery rate (FDR) correction for the number of tests, 156
retaining only p <0.05. Finally, the ratios of genera and pocket depth were controlled for 157
normality followed by Spearman correlation test. 158
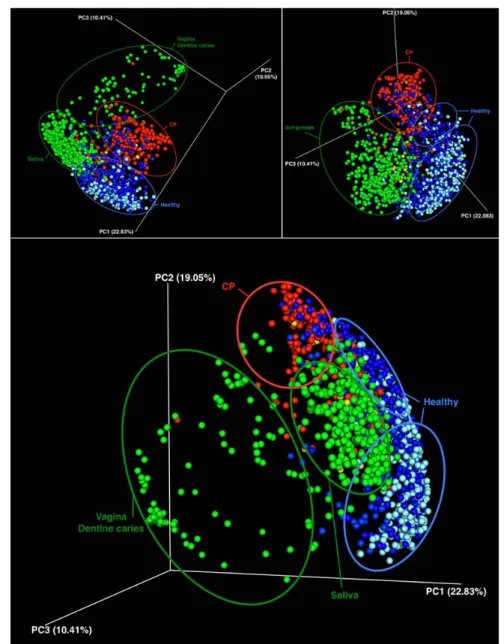
RESULTS
159
Microbial community structure analysis. Using a matrix correlation analysis, the possible
160
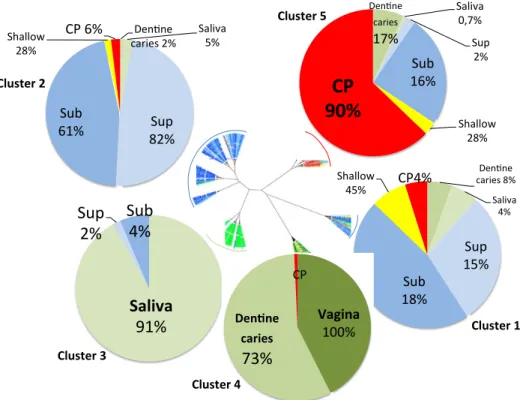
clustering of microbiota according to nature of primers used, the site of sampling, or the 161
study investigated was explored. Despite various studies, the analyzed data clustered into 162
five groups according to the clinical status (healthy or CP) or sampling site as shown by the 163
3D PCoA plots (Fig. 1). Healthy sub-gingival samples were, in majority, spread into two main 164
clusters; control samples were clearly separated in two other clusters corresponding to 165
saliva and dentine caries/vagina, while the majority of CP samples were found in a fifth 166
cluster. Two-D beta-diversity analysis showed the precise distribution of the samples in the 167
five clusters (Fig. 2). The search for an association between clusters and primers and/or 168
study type showed that the fourth cluster was associated with V3V4 16S rRNA primers 169
(correlation r=0.537, p<0.001) and with the Kianoush et al. study (15) that has used these 170
specific primers (correlation r=0.608, p<0.001). No other correlation with primers was found. 171
The 2 healthy clusters (1 and 2) were characterized by sub- and supra-gingival samples in 172
similar proportions (Fig. 2, in blue). Focusing on healthy sub-gingival samples, the main 173
difference between the two healthy clusters 1 and 2 was the distribution of samples from 174
the HMP study and from the other studies in the clusters: 225/323 of the HMP study 175
clustered into the healthy cluster 2 while the healthy cluster 1 was richer in samples deriving 176
from the other studies (44/99). Cluster 3 was characterized by saliva as 91% of the saliva 177
samples (258/284) are grouped within this cluster (Fig. 2, correlation r=0.892, p<0.001). 178
Cluster 4 was characterized by samples from dentine caries 73% (80/110) and mid-vagina 179
100% (60/60) (correlation r=0.603 and r=0.638 respectively, p<0.001). Finally, the fifth 180
cluster contained 90% of the CP samples (176/196, correlation r=0.708, p<0.001). 181
It is interesting to note that 10% of the CP samples were found in the 2 healthy clusters 182
(19/196) and contained similar microbiota (analyzed by beta-diversity) as dentine caries 183
and/or mid-vagina (1/196) at the genus level. Conversely, 16% of the healthy sub-gingival 184
samples (69/422) and 17% of the dentine caries samples (19/110) were found in the fifth 185
cluster. 186
187
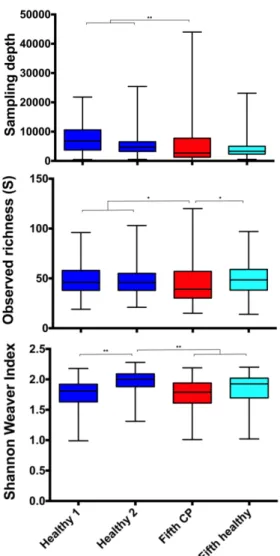
Microbiota richness and alpha-diversity in sub-gingival samples: Cluster comparison
188
showed that sampling depth (number of reads sequenced) was higher in healthy sub-gingival 189
clusters 1 and 2 than in the fifth cluster. Nevertheless, no significant difference between 190
healthy sub-gingival and CP samples of the fifth cluster was found (Fig.3). The observed 191
richness (S) was lower in the CP samples from fifth cluster than samples of both healthy 192
clusters 1 and 2 and of healthy sub-gingival samples from the fifth cluster (Fig.3). However 193
the Shannon Weaver diversity index showed that the diversity of healthy cluster 2 was 194
significantly higher than the diversity index that is similar in healthy cluster 1 and of all 195
samples from the fifth cluster. 196
197
Patterns of microbial communities in sub-gingival samples (genus level): Genera present in,
198
at least, 95% of all healthy sub-gingival samples or 95% of the CP samples from the fifth 199
cluster are presented in figures 4A and 4B respectively. Results showed that healthy sub-200
gingival samples are dominated by 8 major genera, Fusobacterium, Actinomyces, 201
Streptococcus, Neisseria, Capnocytophaga, Prevotella, Corynebacterium, and Rothia, and by
202
6 minor genera, Leptotrichia, Veillonella, Porphyromonas, Granulicatella, Kingella and 203
Gemella. Associations were found between Fusobacterium and Prevotella, Actinomyces and
204
Rothia and between Leptotrichia and Porphyromonas. Common genera found in CP were
less abundant with 4 major genera, Treponema, Porphyromonas, Prevotella and 206
Fusobacterium followed by Streptococcus, Eubacterium, Tannerella and Campylobacter
207
genera. Only one association was found between Eubacterium and Treponema, while 208
Fusobacterium and Treponema presented a negative correlation.
209 210
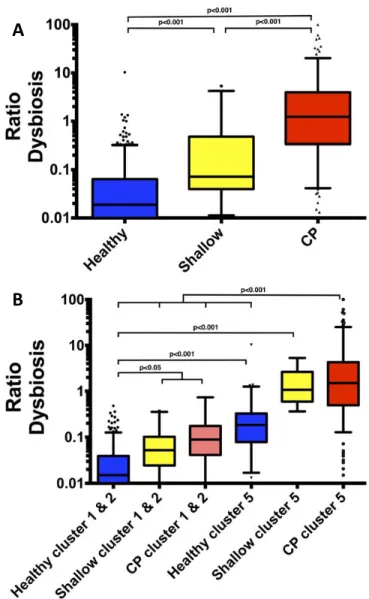
Dysbiosis calculation – ratio of bacteria: The dysbiosis ratio of genera found mainly in
211
chronic periodontitis (Eubacteria-Campylobacter-Treponema-Tannerella) to the genera 212
found mainly in health samples (Veillonella-Neisseria-Rothia-Corynebacterium-Actinomyces) 213
was significantly different between samples according to their diagnosis. The dysbiosis ratio 214
of healthy sub-gingival samples (from HMP, n=323, r=0.016 and from the other studies, 215
n=99, r= 0.021) obtained a median r=0.018, shallow sites r=0.071 and samples from chronic 216
periodontitis r=1.229 (p<0.001) (figure 5A). 217
Despite achieving a different clustering through beta-diversity, no significant difference was 218
found between the ratios of cluster 1 and 2 according to the clinical status (healthy, shallow 219
and CP). Pooling of samples according to clinical status was done and the resulting ratios 220
were compared to ratios of the fifth cluster as shown in figure 5B. 221
The dysbiosis ratio found in CP samples from the fifth cluster (r=1.510) was significantly 222
higher than the ratios of the majority of samples from cluster 1 and 2 (healthy sub-gingival 223
r=0.015, shallow r=0.052 and CP samples r=0.088), and was also significantly higher than 224
healthy sub-gingival samples (r=0.184) from the same fifth cluster (p<0.001). In clusters 1 225
and 2, the dysbiosis ratio of CP samples was similar to the ratio of shallow sites. These two 226
groups were significantly different from the healthy sub-gingival samples (p<0.05) in the 227
same cluster. 228
Healthy sub-gingival samples (n=69) belonging to the fifth cluster exhibited a dysbiosis ratio 229
(r=0.184) significantly different from the other healthy sub-gingival samples (r=0.015) but 230
also from the majority of the CP samples (fifth cluster, r=1.510). These results confirmed the 231
possible difference of these healthy sub-gingival microbiota (p<0.001) as compared with 232
those of healthy clusters 1 and 2. Their ratio is also not significantly different from the CP 233
sample ratio in cluster 1 and 2, which could be considered “on the mend”. 234
235
Validation of the dysbiosis ratio
236
A different dataset from Bizzarro S. et al. (16), containing well-described samples (pocket 237
depth from 2 to 8 millimeters), was used as an external control to confirm the relevance of 238
the dysbiosis ratio of bacteria. The dysbiosis ratio at the genus level was correlated with the 239
periodontal pocket depth (r=0.655, p<0.001) (Fig. 6A). These results, based on 37 patients 240
(147 samples at different times and different procedures of the periodontal treatment), 241
confirmed the link between the dysbiosis and the depth of periodontal pocket. The second 242
simplified ratio of Porphyromonas, Treponema and Tannerella to Rothia and 243
Corynebacterium showed a similar correlation (r=0.659, p<0.001) (Fig. 6B).
DISCUSSION
245
Many studies have been published since the human microbiome project in 2009, increasing 246
the number of microbiota data available for the research community. However, comparison 247
between studies is challenging, at least at the species level, because of the use of different 248
methods. This issue is a real limitation to understand disease as well as the low number of 249
samples in each study. Additionally, it is more complicated for healthy sub-gingival status 250
that usually represent less than a half of the samples when included in studies (10, 14). This 251
work is a taxon-based analysis at the genus level of sequence reads from several studies. 252
Studying a large number of samples minimized individual variations and overcame technical 253
variations by increasing the effective sample size. Such analysis has already been proposed 254
in a recent microbiota obesity study (8). Studies with described healthy (sulci ≤3mm) and CP 255
(pocket depth ≥5mm) samples and available raw sequenced data in data banks were chosen. 256
Data from the HMP resources (two different couples of primers used) were added to 257
increase the number of sub-gingival healthy microbiota data available from 99 up to 422. 258
The different microbiota clustered either by sampling site, such as out-groups used as 259
controls for this study (saliva in cluster 3, dentine caries/vagina both rich in Lactobacillus in 260
cluster 4), or by clinical status, such as sub-gingival samples (healthy samples in cluster 1 and 261
2 and CP samples in the fifth cluster). CP sites can either show a greater microbial diversity 262
and observed richness than healthy sub-gingival sites (12, 19), or present no significant 263
difference in microbial diversity as it has been also reported between health and 264
periodontitis (11). Thus, the high number of samples surpasses the technical variations, at 265
least at the genus level with the primers used in these different studies, and the difference 266
between periodontal health and disease is larger than the technical variations, as described 267
by Kirst et al. (11). No difference was found between the healthy sub- and supra-gingival 268
samples when using beta-diversity analysis at the genus level, as previously described (20). 269
Ninety per cent of CP samples were found in the fifth cluster. To define the fifth cluster as a 270
“periodontitis cluster” by beta-diversity was appealing. However, the fifth cluster also 271
contained healthy sub-gingival samples, indicating that further investigations were necessary 272
to understand and develop prediction markers for chronic periodontitis. 273
A core community is usually identified in publications (genera present in at least 50% of the 274
samples) and provides a basis for disease diagnosis, prevention and therapeutic targets (21, 275
22). However, the genera variability expands as sample size increases, thus limiting its use 276
to establish an easy microbiological marker for dysbiosis. In this work, genera present at a 277
higher prevalence in at least in 95% of the samples were used to determine the genera 278
implicated in health or in favor of the disease. The genera used to calculate the dysbiosis 279
ratio in favor of periodontitis were Treponema, Campylobacter, Eubacterium and Tannerella. 280
These genera were identified at high abundance and high prevalence in CP as compared to 281
healthy samples. They include well-identified species (T. forsythia and T. denticola, C. rectus 282
and E. nodatum) that are strongly associated with the disease (3, 23-25). It is noted that, 283
while some species such as the newly-cultivated Tannerella clone BU063 (26, 27) that is 284
supposed health-associated, is also found in active periodontal sites (28) and therefore still 285
considered controversial. Despite a significant difference in abundance of the 286
Porphyromonas genus (which includes P. gingivalis that is highly associated with
287
periodontitis) between healthy samples (3.35%) and in CP samples (13%), it was 288
excluded in the first dysbiosis ratio because of its similar prevalence. As the lowest 289
abundance in genus accounted for the CP calculation was Campylobacter, 1.9%, this value 290
was therefore chosen as a cut-off to minimize the number of genera used for the health 291
calculation - Rothia, Corynebacterium, Actinomyces, Veillonella and Neisseria. Neither 292
Capnocytophaga nor Leptotirichia were included because of their high prevalence in
293
periodontitis samples (more than 90%, data not shown). Species belonging to the genus 294
Rothia have been repeatedly described as members of oral communities associated with
295
periodontal health (29-34) or at least being more predominant in health (31). In the same 296
way, Corynebacterium appeared to be more associated with “healthy” sub-gingival biofilm 297
(35, 36). Moreover, Rothia and Corynebacteirum were among the bacteria that showed the 298
greatest increase after periodontal treatment (37), while a study suggested that 299
Corynebacterium might be considered as a putative periodontal protector (38). Veillonella
300
and Actinomyces have been negatively correlated with clinical markers in CP (39) and 301
Neisseria was found in inactive sites (28). The calculated dysbiosis ratio distinguishes clearly
302
healthy sub-gingival samples from CP samples. 303
Shallow samples were divided into two groups that can be easily explained based on the 304
origin of the sampling (healthy sub-gingival sites in mouth presenting chronic periodontitis). 305
Two thirds of the samples had a low ratio (cluster 1 and 2) and can be considered 306
“microbiologically healthy”. The remaining one third of the samples (cluster 5) presented a 307
high ratio certainly due to contamination of the sampling sites by bacteria from surrounding 308
CP sites and could be considered as “at risk of periodontitis”. Thus, shallow samples may 309
represent an intermediate stage in disease development as proposed by Griffen et al. (12). 310
Healthy sub-gingival samples are divided into 3 different groups. Two of them belonging to 311
clusters 1 and 2 present the same low ratio and describe an absence of dysbiosis. The third 312
group had a higher dysbiosis ratio, similar to shallow sites and CP samples from cluster 1 and 313
2 but significantly inferior to CP or shallow samples from the fifth cluster. As “healthy 314
patients” from HMP are defined as patients with pockets depths <4mm, some of them could 315
have explained this high ratio group, however healthy patients from other studies (19/99) 316
were also included in this group. This result is similar to Zhou Y. et al. where few healthy 317
subjects were detected with signals of disease such as an increase of Treponema (40). 318
Therefore, patients who presented a relatively high ratio as such could be considered at “risk 319
of periodontitis”. 320
Conversely, a few CP samples with deep periodontal pockets (i.e. ≥ 5mm) had a low dysbiosis 321
ratio. A hypothesis of appropriate host response (such as a stronger immune response 322
and/or better hygiene) could explain this discrepancy between dysbiosis ratio and diagnosis: 323
these patients might be microbiologically “on the mend”, as revealed by both clustering and 324
dysbiosis ratio. Another hypothesis is a sampling concern between the top and base of the 325
periodontal pocket (to be discussed later). To study the microbiota “on the mend” 326
hypothesis and the dysbiosis calculated by the ratio, a recent study presenting a follow-up 327
after treatment with well-defined depth of periodontal pocket metadata was used (16). This 328
study was conducted with a different set of primers (V5V7) and allowed to test the dysbiosis 329
ratio at the genus level on a new set of primers that have not been used to determine the 330
ratio. Consequently, this comparative analysis can be considered as a validation experiment 331
of the ratios. A strong correlation was obtained between the dysbiosis ratio and the pocket 332
depths, thus highlighting the value of calculating the dysbiosis ratio (using the selected 333
genera of our study) as a microbial signature to evaluate the microbiota of chronic 334
periodontitis. 335
A major concern at the beginning of this work was the capacity to identify species with 336
multiple datasets. However the V1V2 and V5V7 primers used in 3 studies were not suitable 337
for species identification. At the genus level, as reported in Bizzarro S. et al. (16), the 338
proposed dysbiosis ratio is a good microbial signature calculated using the online VAMPS 339
software even by using a simplified dysbiosis ratio. Indeed, as Rothia and Corynebacterium 340
are the major healthy genera found, and even if Porphyromonas was found in both health 341
and disease, its abundance increased significantly in disease (from 3.34% to 13%). The result 342
was interesting, where it was found to be similar to the precedent ratio (correlation with 343
pocket depth r=0.659 p<0.001). However, more adjustments were needed as 43 out of 196 344
CP samples presented none of the two healthy genera and a value of 0.1% was attributed for 345
the calculation. 346
Finally, using ratios, some data points still showed discrepancies in predicting the 347
periodontal status. The variability in microbial composition and spatial distribution could 348
explain these results. Deep periodontal pockets in CP patients may present gradients of 349
oxygen tension, pH and nutrients as well as host defense factors from the base of the pocket 350
to the top (opening). This may explain why some genera are typically found at the base of 351
the pocket (Porphyromonas, Treponema) (41, 42). However, the sampling could induce bias 352
even after careful removal of the supra-gingival plaque. Healthy genera may be found 353
predominantly at the top (opening) of the pocket as compared with the genera more closely 354
associated with CP being located at the base of the pocket. Indeed, with the use of NGS 355
analysis, while the architecture of the periodontal pocket has not been clearly studied yet, 356
the importance of the biogeography of microbiome at the micron scale has clearly been 357
shown recently (43). 358
359
In conclusion, this study aimed to define ratios of bacteria as microbial signature after the 360
analysis of public raw data from different studies, independent of the technical methods 361
used to generate the data. These ratios allow the differentiation of healthy and diseased 362
microbiota in a majority of samples. Standardized protocols of sampling and complete 363
metadata in the public bank are necessary to study dysbiosis in oral health and to improve 364
the proposed dysbiosis ratios. Adjunction of specific perio-protectors and potential specific 365
pathogens to the calculation of the dysbiosis could also be promising. Longitudinal studies 366
are necessary to predict exact pockets microbiologically “on the mend” or sulci with “risk of 367
periodontitis”. 368
References
369 370
1. Teles R, Teles F, Frias-Lopez J, Paster B, Haffajee A. 2013. Lessons learned and
371
unlearned in periodontal microbiology. Periodontol 2000 62:95-162. 372
2. Kilian M, Chapple IL, Hannig M, Marsh PD, Meuric V, Pedersen AM, Tonetti
373
MS, Wade WG, Zaura E. 2016. The oral microbiome - an update for oral healthcare
374
professionals. Br Dent J 221:657-666. 375
3. Socransky SS, Haffajee AD, Cugini MA, Smith C, Kent RL, Jr. 1998. Microbial
376
complexes in subgingival plaque. J Clin Periodontol 25:134-144. 377
4. Hajishengallis G. 2015. Periodontitis: from microbial immune subversion to
378
systemic inflammation. Nat Rev Immunol 15:30-44. 379
5. Hajishengallis G, Darveau RP, Curtis MA. 2012. The keystone-pathogen
380
hypothesis. Nat Rev Microbiol 10:717-725. 381
6. Hajishengallis G, Moutsopoulos NM, Hajishengallis E, Chavakis T. 2016.
382
Immune and regulatory functions of neutrophils in inflammatory bone loss. Semin 383
Immunol 28:146-158. 384
7. Group NHW, Peterson J, Garges S, Giovanni M, McInnes P, Wang L, Schloss JA,
385
Bonazzi V, McEwen JE, Wetterstrand KA, Deal C, Baker CC, Di Francesco V,
386
Howcroft TK, Karp RW, Lunsford RD, Wellington CR, Belachew T, Wright M, Giblin
387
C, David H, Mills M, Salomon R, Mullins C, Akolkar B, Begg L, Davis C, Grandison L,
388
Humble M, Khalsa J, Little AR, Peavy H, Pontzer C, Portnoy M, Sayre MH,
Starke-389
Reed P, Zakhari S, Read J, Watson B, Guyer M. 2009. The NIH Human Microbiome
390
Project. Genome Res 19:2317-2323. 391
8. Sze MA, Schloss PD. 2016. Looking for a Signal in the Noise: Revisiting Obesity
392
and the Microbiome. MBio 7. 393
9. Huse SM, Mark Welch DB, Voorhis A, Shipunova A, Morrison HG, Eren AM,
394
Sogin ML. 2014. VAMPS: a website for visualization and analysis of microbial population
395
structures. BMC Bioinformatics 15:41. 396
10. Abusleme L, Dupuy AK, Dutzan N, Silva N, Burleson JA, Strausbaugh LD,
397
Gamonal J, Diaz PI. 2013. The subgingival microbiome in health and periodontitis and
398
its relationship with community biomass and inflammation. ISME J 7:1016-1025. 399
11. Kirst ME, Li EC, Alfant B, Chi YY, Walker C, Magnusson I, Wang GP. 2015.
400
Dysbiosis and alterations in predicted functions of the subgingival microbiome in 401
chronic periodontitis. Appl Environ Microbiol 81:783-793. 402
12. Griffen AL, Beall CJ, Campbell JH, Firestone ND, Kumar PS, Yang ZK, Podar M,
403
Leys EJ. 2012. Distinct and complex bacterial profiles in human periodontitis and health
404
revealed by 16S pyrosequencing. ISME J 6:1176-1185. 405
13. Zhou M, Rong R, Munro D, Zhu C, Gao X, Zhang Q, Dong Q. 2013. Investigation
406
of the effect of type 2 diabetes mellitus on subgingival plaque microbiota by high-407
throughput 16S rDNA pyrosequencing. PLoS One 8:e61516. 408
14. Camelo-Castillo AJ, Mira A, Pico A, Nibali L, Henderson B, Donos N, Tomas I.
409
2015. Subgingival microbiota in health compared to periodontitis and the influence of 410
smoking. Front Microbiol 6:119. 411
15. Kianoush N, Adler CJ, Nguyen KA, Browne GV, Simonian M, Hunter N. 2014.
412
Bacterial profile of dentine caries and the impact of pH on bacterial population diversity. 413
PLoS One 9:e92940. 414
16. Bizzarro S, Laine ML, Buijs MJ, Brandt BW, Crielaard W, Loos BG, Zaura E.
415
2016. Microbial profiles at baseline and not the use of antibiotics determine the clinical 416
outcome of the treatment of chronic periodontitis. Sci Rep 6:20205. 417
17. Shannon P, Markiel A, Ozier O, Baliga NS, Wang JT, Ramage D, Amin N,
418
Schwikowski B, Ideker T. 2003. Cytoscape: a software environment for integrated
419
models of biomolecular interaction networks. Genome Res 13:2498-2504. 420
18. Faust K, Sathirapongsasuti JF, Izard J, Segata N, Gevers D, Raes J,
421
Huttenhower C. 2012. Microbial co-occurrence relationships in the human microbiome.
422
PLoS Comput Biol 8:e1002606. 423
19. Socransky SS, Haffajee AD, Smith C, Dibart S. 1991. Relation of counts of
424
microbial species to clinical status at the sampled site. J Clin Periodontol 18:766-775. 425
20. Ning J, Beiko RG. 2015. Phylogenetic approaches to microbial community
426
classification. Microbiome 3:47. 427
21. Shade A, Handelsman J. 2012. Beyond the Venn diagram: the hunt for a core
428
microbiome. Environ Microbiol 14:4-12. 429
22. Jalanka-Tuovinen J, Salonen A, Nikkila J, Immonen O, Kekkonen R, Lahti L,
430
Palva A, de Vos WM. 2011. Intestinal microbiota in healthy adults: temporal analysis
431
reveals individual and common core and relation to intestinal symptoms. PLoS One 432
6:e23035.
433
23. Laine ML, Moustakis V, Koumakis L, Potamias G, Loos BG. 2013. Modeling
434
susceptibility to periodontitis. J Dent Res 92:45-50. 435
24. Byrne SJ, Dashper SG, Darby IB, Adams GG, Hoffmann B, Reynolds EC. 2009.
436
Progression of chronic periodontitis can be predicted by the levels of Porphyromonas 437
gingivalis and Treponema denticola in subgingival plaque. Oral Microbiol Immunol
438
24:469-477.
439
25. Haffajee AD, Teles RP, Socransky SS. 2006. Association of Eubacterium
440
nodatum and Treponema denticola with human periodontitis lesions. Oral Microbiol
441
Immunol 21:269-282. 442
26. Leys EJ, Lyons SR, Moeschberger ML, Rumpf RW, Griffen AL. 2002.
443
Association of Bacteroides forsythus and a novel Bacteroides phylotype with 444
periodontitis. J Clin Microbiol 40:821-825. 445
27. Vartoukian SR, Moazzez RV, Paster BJ, Dewhirst FE, Wade WG. 2016. First
446
Cultivation of Health-Associated Tannerella sp. HOT-286 (BU063). J Dent Res 95:1308-447
1313. 448
28. Yost S, Duran-Pinedo AE, Teles R, Krishnan K, Frias-Lopez J. 2015. Functional
449
signatures of oral dysbiosis during periodontitis progression revealed by microbial 450
metatranscriptome analysis. Genome Med 7:27. 451
29. Moore LV, Moore WE, Cato EP, Smibert RM, Burmeister JA, Best AM, Ranney
452
RR. 1987. Bacteriology of human gingivitis. J Dent Res 66:989-995.
453
30. Aas JA, Paster BJ, Stokes LN, Olsen I, Dewhirst FE. 2005. Defining the normal
454
bacterial flora of the oral cavity. J Clin Microbiol 43:5721-5732. 455
31. Colombo AP, Boches SK, Cotton SL, Goodson JM, Kent R, Haffajee AD,
456
Socransky SS, Hasturk H, Van Dyke TE, Dewhirst F, Paster BJ. 2009. Comparisons of
457
subgingival microbial profiles of refractory periodontitis, severe periodontitis, and 458
periodontal health using the human oral microbe identification microarray. J 459
Periodontol 80:1421-1432. 460
32. Bik EM, Long CD, Armitage GC, Loomer P, Emerson J, Mongodin EF, Nelson
461
KE, Gill SR, Fraser-Liggett CM, Relman DA. 2010. Bacterial diversity in the oral cavity
462
of 10 healthy individuals. ISME J 4:962-974. 463
33. Heuer W, Stiesch M, Abraham WR. 2011. Microbial diversity of supra- and
464
subgingival biofilms on freshly colonized titanium implant abutments in the human 465
mouth. Eur J Clin Microbiol Infect Dis 30:193-200. 466
34. Moutsopoulos NM, Chalmers NI, Barb JJ, Abusleme L, Greenwell-Wild T,
467
Dutzan N, Paster BJ, Munson PJ, Fine DH, Uzel G, Holland SM. 2015. Subgingival
468
microbial communities in Leukocyte Adhesion Deficiency and their relationship with 469
local immunopathology. PLoS Pathog 11:e1004698. 470
35. Paster BJ, Boches SK, Galvin JL, Ericson RE, Lau CN, Levanos VA,
471
Sahasrabudhe A, Dewhirst FE. 2001. Bacterial diversity in human subgingival plaque. J
472
Bacteriol 183:3770-3783. 473
36. Ling Z, Liu X, Luo Y, Yuan L, Nelson KE, Wang Y, Xiang C, Li L. 2013.
474
Pyrosequencing analysis of the human microbiota of healthy Chinese undergraduates. 475
BMC Genomics 14:390. 476
37. Laksmana T, Kittichotirat W, Huang Y, Chen W, Jorgensen M, Bumgarner R,
477
Chen C. 2012. Metagenomic analysis of subgingival microbiota following non-surgical
478
periodontal therapy: a pilot study. Open Dent J 6:255-261. 479
38. Zorina OA, Petrukhina NB, Basova AA, Shibaeva AV, Trubnikova EV,
480
Shevelev AB. 2014. [Identification of key markers of normal and pathogenic microbiota
481
determining health of periodontium by NGS-sequencing 16S-rDNA libraries of 482
periodontal swabs]. Stomatologiia (Mosk) 93:25-31. 483
39. Teles R, Sakellari D, Teles F, Konstantinidis A, Kent R, Socransky S, Haffajee
484
A. 2010. Relationships among gingival crevicular fluid biomarkers, clinical parameters of
485
periodontal disease, and the subgingival microbiota. J Periodontol 81:89-98. 486
40. Zhou Y, Mihindukulasuriya KA, Gao H, La Rosa PS, Wylie KM, Martin JC, Kota
487
K, Shannon WD, Mitreva M, Sodergren E, Weinstock GM. 2014. Exploration of
488
bacterial community classes in major human habitats. Genome Biol 15:R66. 489
41. Zijnge V, van Leeuwen MB, Degener JE, Abbas F, Thurnheer T, Gmur R,
490
Harmsen HJ. 2010. Oral biofilm architecture on natural teeth. PLoS One 5:e9321.
491
42. Kigure T, Saito A, Seida K, Yamada S, Ishihara K, Okuda K. 1995. Distribution
492
of Porphyromonas gingivalis and Treponema denticola in human subgingival plaque at 493
different periodontal pocket depths examined by immunohistochemical methods. J 494
Periodontal Res 30:332-341. 495
43. Mark Welch JL, Rossetti BJ, Rieken CW, Dewhirst FE, Borisy GG. 2016.
496
Biogeography of a human oral microbiome at the micron scale. Proc Natl Acad Sci U S A 497
113:E791-800.
498 499 500
Author Contributions (names must be given as initials)
501
VM, FBH and MBM conceived and designed the research. VM realized the sampling. SLGD 502
realized the molecular biology. VM, SLGD, EB, LAA, BM, SBF, BM, performed the experiments 503
(bioinformatics analysis, statistics) and wrote the manuscript. MBM supervised the project. 504
505
Competing interests
506
The authors declare no competing financial interests. 507
508
509
Fig. 1: Different views of 3D PCoA plots illustrating the beta-diversity of bacterial
510
populations as a function of sampling site and diagnosis. Light blue: supra-gingival samples;
511
dark blue: healthy sub-gingival samples; green: out-groups as saliva, mid-vagina and dentine 512
caries; red: chronic periodontitis - CP). 513
515
Fig. 2: Unrooted tree displaying genus Bray Curtis beta-diversity clustering microbiota and
516
pie charts related to sample origin within each cluster. The tree was realized using Figtree
517
software v1.4.2. Distribution of microbiota in each cluster is represented by pie charts with 518
different colors according to sampling sites (supra-gingival: Sup in light blue, saliva: light 519
green, dentine caries: green and mid vagina: dark green) and diagnosis for sub-gingival 520
samples (healthy: Sub in dark blue, shallow in yellow and chronic periodontitis in red). 521
Written percentages correspond to the number of samples from a given specific sampling 522
site in a given cluster to the total number of samples from the same specific sampling site. 523 524 Den ne caries2% Saliva 5% Sup 82% Sub 61% Shallow 28% CP6% Den ne caries 17% Saliva 0,7% Sup 2% Sub 16% Shallow 28%
CP
90%
Den ne caries 8% Saliva 4% Sup 15% Sub 18% Shallow 45% CP4%Saliva
91%
Sup
2%
Sub
4%
Vagina 100% Den ne caries73%
CP Cluster 2 Cluster 1 Cluster 5 Cluster 3 Cluster 4525
Fig. 3: Alpha diversity index. Microbiota sampling depth, observed richness (S, number of
526
different taxa per sample) and diversity (Shannon Weaver index) comparisons in sub-gingival 527
samples between samples of healthy clusters 1 and 2 (blue) and samples of cluster 5, either 528
with chronic periodontitis (red) or sub-gingival healthy samples (light blue). *p<0.05, 529
**p<0.01. 530
532
Fig. 4: Patterns of sub-gingival microbial communities. A: Patterns of genera present at 533
least in 95% of all healthy sub-gingival samples. B: Patterns of genera present at least in 95% 534
of all chronic periodontitis (CP) samples from the cluster 5. Edges represent one (thin line) or 535
2 to 3 (thick line) significant correlation between genera (green: positive; red: negative). 536
Node colors represent the number of partners ranging from one (green) to 7 (dark orange). 537
Node sizes represent the abundance of each taxon. 538
540
Figure 5: Sub-gingival dysbiosis ratio. Ratio = Eubacterium, Campylobacter, Treponema and
541
Tannerella to Veillonella, Neisseria, Rothia, Corynebacterium and Actinomyces. A. Between
542
healthy, shallow and chronic periodontitis samples (CP) from all clusters. B. Between clusters 543
1&2 and Cluster 5 for healthy, shallow and CP samples. 544
545
A
546
547
Figure 6: Correlation between pocket depth and dysbiosis. Samples from Bizzarro S. et al.,
548
2016 (16) were analyzed by VAMPS followed by the calculation of the dysbiosis ratio. A. 549
Ratio = Eubacterium, Campylobacter, Treponema and Tannerella to Veillonella, Neisseria, 550
Rothia, Corynebacterium and Actinomyces). B. Simplified ratio = Porphyromonas, Treponema
551
and Tannerella to Rothia and Corynebacterium. 552
553 554 555
Table 1: Sub-gingival microbiota used in this study 556
Authors Accession Number
Number of sub-gingival microbiota
16S rRNA gene regions Health Shallow #
CP
Diagnosis Follow up after treatment
Abusleme et al.
(10) SRA051864 10 44 V1V2 Kirst et al. (11) PRJNA269205 25 25 V1V3 Griffen et al. (12) SRP009299 29 29 29 V1V2 and V4 Camelo-Castillo et al. (14) MG-RAST: ID 12161 22 60 V1V3 Zhou et al. (40) SRA062091 13 18 V1V3
Meuric et al. In progress$ 24 V3V4
HMP (7) 119 V1V3
HMP (7) 204 V3V5
Bizzarro et al. (16) PRJNA289294 37* 110* V5V7
* CP microbiota from patients with a follow up treatment used to confirmed the dysbiosis 557
ratios hypothesis (16). 558
#
Site defined as healthy in patients with periodontitis (12). 559
$
Data available on VAMPS for the reviewers, dataset: “Y_Hemoparo” 560