HAL Id: inserm-00565831
https://www.hal.inserm.fr/inserm-00565831
Submitted on 14 Feb 2011HAL is a multi-disciplinary open access
archive for the deposit and dissemination of sci-entific research documents, whether they are pub-lished or not. The documents may come from teaching and research institutions in France or abroad, or from public or private research centers.
L’archive ouverte pluridisciplinaire HAL, est destinée au dépôt et à la diffusion de documents scientifiques de niveau recherche, publiés ou non, émanant des établissements d’enseignement et de recherche français ou étrangers, des laboratoires publics ou privés.
Jennifer Parker, David Rich, Svetlana Glinianaia, Jong Han Leem, Daniel
Wartenberg, Michelle Bell, Matteo Bonzini, Michael Brauer, Lyndsey Darrow,
Ulrike Gehring, et al.
To cite this version:
Jennifer Parker, David Rich, Svetlana Glinianaia, Jong Han Leem, Daniel Wartenberg, et al.. The International Collaboration on Air Pollution and Pregnancy Outcomes: initial results.: Air Pollution and Low Birth Weight. Environmental Health Perspectives, National Institute of Environmental Health Sciences, 2011, 119 (7), pp.1023-8. �10.1289/ehp.1002725�. �inserm-00565831�
HEALTH
PERSPECTIVES
HEALTH
PERSPECTIVES
National Institutes of Health
U.S. Department of Health and Human Services
The International Collaboration on Air Pollution and
Pregnancy Outcomes: Initial Results
Jennifer Parker, David Q. Rich, Svetlana V. Glinianaia,
Jong Han Leem, Daniel Wartenberg, Michelle L. Bell,
Matteo Bonzini, Michael Brauer, Lyndsey Darrow,
Ulrike Gehring, Nelson Gouveia, Paolo Grillo, Eunhee Ha,
Edith H. van den Hooven, Bin Jalaludin, Bill M. Jesdale,
Johanna Lepeule, Rachel Morello-Frosch, Geoffrey G. Morgan,
Rémy Slama, Frank H. Pierik, Angela Cecilia Pesatori,
Sheela Sathyanarayana, Juhee Seo, Matthew Strickland,
Lillian Tamburic, and Tracey J. Woodruff
doi: 10.1289/ehp.1002725 (available at http://dx.doi.org/)
Online 9 February 2011
ehponline.org
The International Collaboration on Air Pollution and Pregnancy Outcomes: Initial Results. Jennifer Parker1, David Q. Rich2, Svetlana V. Glinianaia3, Jong Han Leem4, Daniel Wartenberg5, Michelle L. Bell6, Matteo Bonzini7, Michael Brauer8, Lyndsey Darrow9,Ulrike Gehring10, Nelson Gouveia11, Paolo Grillo12, Eunhee Ha13, Edith H. van den Hooven14,15, Bin Jalaludin16, 17, Bill M. Jesdale18, Johanna Lepeule19,20, Rachel Morello-Frosch18,21, Geoffrey G. Morgan16,22, Rémy Slama19,20, Frank H. Pierik15, Angela Cecilia Pesatori23, Sheela Sathyanarayana24, Juhee Seo13, Matthew Strickland9, Lillian Tamburic25, and Tracey J. Woodruff26
1
National Center for Health Statistics, Centers for Disease Control and Prevention, Hyattsville, MD
2
University of Rochester School of Medicine and Dentistry, Department of Community and Preventive Medicine, Rochester, NY, USA
3
Institute of Health and Society, Newcastle University, Newcastle upon Tyne, England, UK
4
Department of Occupational & Environmental Medicine, Inha University. Incheon, Republic of Korea
5
UMDNJ-Robert Wood Johnson Medical School, NJ, USA
6
Yale University, New Haven, CT, USA
7
Department of Experimental Medicine, University of Insubria, Varese, Italy
8
The University of British Columbia, Vancouver, BC Canada
9
Department of Environmental Health, Emory University, Atlanta GA, USA
10
Institute for Risk Assessment Sciences, Utrecht University, Utrecht, Netherlands
11
Department of Preventive Medicine, School of Medicine of the University of São Paulo, São Paulo Brasil
12
Epidemiology Unite, “Fondazione IRCCS Ca’Granda – Ospedale Maggiore Policlinico”, Milan, Italy
13
Department of Preventive Medicine, Ewha Womans University, Seoul, Republic of Korea
14
The Generation R Study Group, Erasmus Medical Center, Rotterdam, The Netherlands.
15
Department of Environment and Health, Netherlands Organisation for Applied Scientific Research (TNO), Delft, The Netherlands.
16
17
Centre for Research, Evidence Management and Surveillance, Sydney South West Area Health Service, and School of Public Health and Community Medicine, University of New South Wales, Australia
18
Department of Environmental Science, Policy and Management University of California, Berkeley, CA USA
19
Inserm, National Institute of Health and Medical Research, Avenir Team “Environmental Epidemiology Applied to Fecundity and Reproduction”, Institut Albert Bonniot, U823, Grenoble, France
20
University J. Fourier Grenoble, Grenoble, France.
21
School of Public Health, University of California, Berkeley, CA USA
22
Northern Rivers University Department of Rural Health, University of Sydney, New South Wales, Australia
23
Department of Occupational and Environmental Health, Università di Milano, Milan, Italy
24
Seattle Children's Research Institute, University of Washington, WA USA
25
University of British Columbia, Centre for Health Services and Policy Research, Vancouver, Canada
26
Center for Reproductive Health and the Environment. University of California, San Francisco, USA
Corresponding author: Jennifer D. Parker
National Center for Health Statistics 3311 Toledo Road, room 6107 Hyattsville, MD 20782
jdparker@cdc.gov
T. (301) 458-4419 F. (301) 458-4038
Short running head: Air Pollution and Low Birth Weight
Key words: Air Pollution, Birth Weight, ICAPPO, Low Birth Weight, Particulate Matter, Pregnancy
Dr. Bell was supported, in part, by NIH 1R01ES016317. Dr. Lepeule by a post-doctoral grant from Inserm. Dr. Gehring was supported by a research fellowship of the Netherlands
Organization for Scientific Research (NWO). CDC disclaimer
The findings and conclusions in this paper are those of the authors and do not necessarily represent the views of the National Center for Health Statistics, Centers for Disease Control and Prevention
ICAPPO = International Collaboration on Air Pollution and Pregnancy Outcome IDW = Inverse Distance Weighted
IRSED = Index of Relative Socio-economic Disadvantage LBW = Low birth weight
LMP = Last menstrual period LUR= Land Use Regression
PAMPER = Particulate Matter and Perinatal Events Research PM = Particulate matter
SES = Socioeconomic Status UK = United Kingdom
Abstract
Background. The findings of prior studies of air pollution effects on adverse birth outcomes are difficult to synthesize due to differences in study design.
Objectives. The International Collaboration on Air Pollution and Pregnancy Outcome was formed to understand how differences in research methods contribute to variations in findings. We initiated a feasibility study to: 1) assess the ability of geographically diverse research groups to analyze their datasets using a common protocol and 2) perform location-specific analyses of air pollution effects on birth weight using a standardized statistical approach.
Results. Fourteen research groups from nine countries participated. We developed a protocol to estimate odds ratios (OR) for the association between particulate matter (PM10) and low
birthweight (LBW) among term births, adjusted first for socioeconomic status and second for additional location-specific variables. Among locations with data for the PM10 analysis, ORs
estimating the relative risk of term-LBW associated with a 10 g/m3
increase in average PM10
concentration during pregnancy adjusted for socioeconomic status ranged from 0.63 (95% confidence interval, CI= 0.30, 1.35, the Netherlands) to 1.15 (CI=0.61, 2.18, Vancouver), with 6 research groups reporting statistically significant adverse associations. We found evidence of statistically significant heterogeneity in estimated effects among locations.
Conclusions. Variability in PM10-LBW relationships among study locations remained, despite
use of a common statistical approach. A more detailed meta-analysis and use of more complex protocols for future analysis may uncover reasons for heterogeneity across locations. However, our findings confirm the potential for a diverse group of researchers to analyze their data in a standardized way to improve understanding of air pollution effects on birth outcomes.
Introduction
Evidence that poor air quality can adversely affect birth outcomes is increasing. A small number of review articles have summarized existing studies and concluded that there is likely an adverse effect of air pollution on pregnancy outcome (Glinianaia et al. 2004; Ritz and Wilhelm, 2008; Sram et al. 2005). However, estimated associations between these outcomes and air pollutant exposures over the whole pregnancy and during specific time windows (according to trimester of pregnancy, for example) have been inconsistent, making definitive conclusions difficult
(Glinianaia et al., 2004; Slama et al. 2008; Woodruff et al. 2009).
Comparisons of findings across different geographic locations are hindered, in part, by differences in research designs. Although most published studies have reported adverse
pregnancy outcomes in association with prenatal exposure to air pollution, inconsistent findings reported by some studies prompted a series of workshops to discuss this relatively new area of investigation (Slama et al. 2008; Woodruff et al. 2009) and the formation of the International Collaboration on Air Pollution and Pregnancy Outcome (ICAPPO) (Woodruff et al. 2010). The primary objective of ICAPPO is to understand how differences in research design and methods contribute to variations in findings.
As part of this effort, a feasibility study was developed to determine whether it would be possible to use a common protocol to re-analyse existing datasets that were created to answer similar but not identical research questions. In this report, we describe the common research protocol and participating studies. Throughout this manuscript, study results from each research group are referred to by name (e.g. EDEN study) if available, otherwise by location (e.g. Seattle study). Additionally, we present estimated odds ratios for the association between low birth
weight among term births and exposure to ambient particulate matter with an aerodynamic diameter < 10 µm (PM10) during pregnancy.
METHODS
Through discussion with the larger group of ICAPPO participants and detailed planning by a smaller group (JP, DR, SVG, JHL), a protocol for the feasibility study was developed, agreed upon and distributed to a geographically diverse group of researchers. To maximize the number of participating groups, we deliberately simplified the protocol by restricting the primary statistical analysis to one outcome (low birth weight in term births) and the air pollution
exposure (PM10) available for the largest number locations (Woodruff et al 2010).
Cohort restrictions. We limited the study to live-born, singleton, term (37-42 complete
weeks of gestation) infants with known birth weight, maternal education (or another measure of socioeconomic status), dates of birth and conception (often based on last menstrual period (LMP)), and ambient PM concentrations, as described below, during pregnancy. The primary outcome was term low birth weight (LBW); LBW was defined as birth weight <2,500 g.
Air pollution exposure. The primary exposure variable was the ambient concentration of
PM10 averaged over the entire pregnancy. PM10 concentrations were assigned to each subject
using the approach employed by each research group in their original work. Although we
focused on PM10, investigators also were encouraged to provide results for fine particulate matter
(PM2.5) if available. Studies without PM10 data provided effect estimates for PM2.5 or black
Black smoke approximates PM less than 4 microns in diameter (Muir and Laxon, 1995); results for black smoke are presented alongside the PM10 results for the PAMPER study
(Newcastle upon Tyne, UK). The methods for modeling the PAMPER black smoke exposures are described elsewhere (Fanshawe et al. 2008).
Socioeconomic status. ICAPPO participants identified socioeconomic status (SES) as a
potentially important control variable when assessing pollution and birth outcomes (Slama et al. 2008; Woodruff et al. 2009), and agreed to use maternal education as the primary measure of SES in the feasibility study. Maternal education is commonly used as an SES measure in perinatal studies, and has been shown to be related, albeit imperfectly, with other measures of SES (Kaufman et al. 2008; Parker et al. 1994; Pickett et al. 2002). If maternal education was unavailable, using different individual or area-level SES measures was allowed. Because the collection and meaning of maternal education for these studies differs among the study locations, its form as an analytic covariate differed among the study locations.
Other covariates. Participants also were encouraged to provide estimates adjusted for
additional covariates as described below. Although additional variables make comparisons of results across locations more challenging, they allowed us to examine how additional
adjustments specific to each location might influence estimates reported by each study.
Primary statistical analysis. We used logistic regression, with term-LBW as the
dependent variable and PM10as a continuous explanatory variable; black smoke was used in the
PAMPER study, as described above. Results are reported as odds ratios per 10 µg/m3 increase in average concentration during pregnancy to facilitate synthesis of results. Results from two models were examined:
Model 1 covariates: PM10 and study-specific maternal education or other SES
measure
Model 2 covariates: PM10, maternal education or other SES measure, plus other
study-location specific covariates as described above
For the secondary analyses, we suggested modeling continuous term birth weight as an outcome (using linear regression) and/or using PM2.5 as an exposure measure. In addition,
results from models describing associations after controlling for different SES measures were contributed. Secondary analyses were encouraged but not required for participation, so results of secondary analyses were not reported by all investigators.
Although full meta-analyses were not performed, in our examination of results, initial tests of homogeneity across study locations were conducted using fixed effects models (Sterne et al. 2001). In these tests, the null hypothesis of homogeneity was rejected with p-values < 0.05.
RESULTS
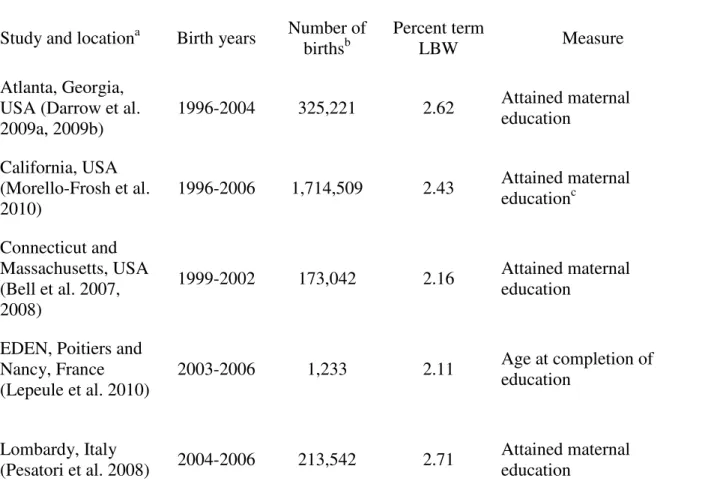
Locations. Fourteen research groups from nine countries participated (Table 1). Of
these, six reported results for PM10 only, six reported results for both PM10 and PM2.5, one
reported results for PM2.5 only (Seattle study), and one for black smoke only (PAMPER study).
Most data were from the late 1990s to the mid 2000s. However, the PAMPER study comprised births from 1962 through 1992. The number of eligible births ranged from slightly over one thousand in the EDEN study (Nancy and Poitiers, France) to over one million in the California
study, although there was some variability within studies depending on the exposure measure and covariates. The percent of LBW among term births ranged from 1.15% in the PIAMA study (the Netherlands) to 3.77% in the São Paulo study (Table 1)
By design, datasets used in the feasibility study have been used for previous studies of pollution and pregnancy outcomes, or are intended for such use. However, these are not
necessarily studies of PM10 or term-LBW, and previously published results may have been based
on earlier versions of study datasets (Bell et al. 2007; Bell et al. 2008; Brauer et al. 2008; Darrow et al. 2009a; Darrow et al. 2009b; Glinianaia et al. 2008; Gehring et al. 2011; Gouveia et al. 2004; Ha et al. 2004, Jalaludin et al. 2007; Lepeule et al. 2010; Mannes et al. 2005; Pearce et al. 2010; Pesatori et al. 2008; Rich et al. 2009; Slama et al. 2009; van den Hooven et al. 2009).
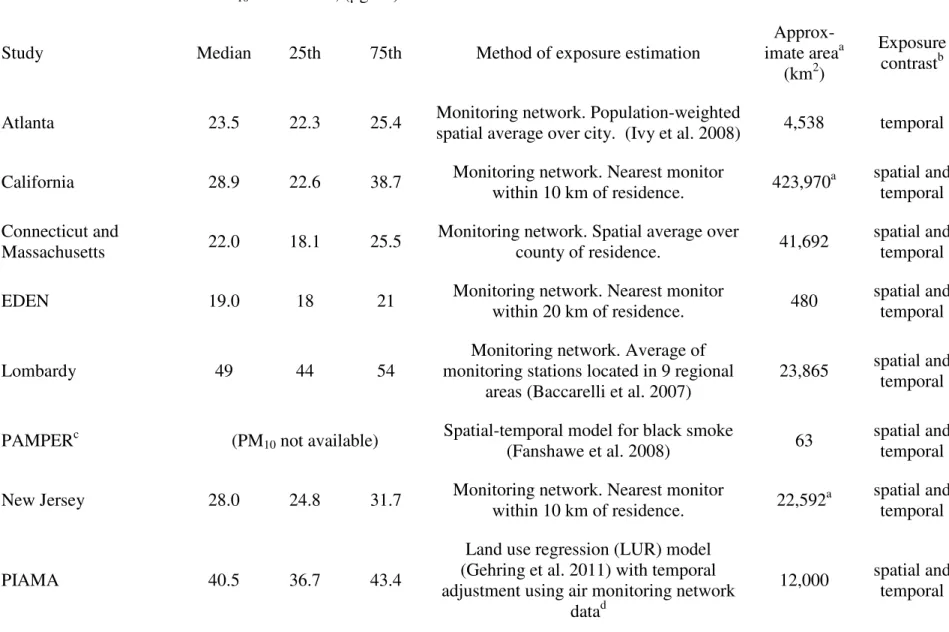
PM concentration estimation. PM concentration estimates and estimation methods
differed among the studies (Table 2). Some research groups relied on temporal variability in PM to estimate effects, where exposure was calculated by averaging all measurements over the entire study area for the pregnancy interval; for these studies, exposure estimates differed for
pregnancies occurring at different times, but not by maternal residence, within the study area. Other studies estimated effects based on both temporal and spatial PM contrasts, where estimates were calculated for multiple geographic administrative units or at each maternal address; in these studies, exposures differed both by maternal address and by timing of the pregnancies within the study period. Most research groups (11) used routinely collected monitoring network data to estimate exposures (Table 2), although its use differs among studies (e.g. averages over geographic areas; nearest monitor measurement, or inverse distance weighted (IDW) averages from multiple monitors, from residence).
Two research groups used models to estimate PM10 exposure (Table 2), although
modeling methods differed. The Generation R study (Rotterdam, the Netherlands) used
dispersion modeling (combination of monitoring data with modeling techniques) (Wesseling et al. 2002) whereas the PIAMA study (the Netherlands) used temporally adjusted land use regression (LUR) (Gehring et al. 2011) and estimated residential PM10 from modeled PM2.5
concentration (Cyrys et al. 2003). PAMPER used modeled estimates, as described above; the median modeled black smoke concentration in the PAMPER dataset was 32.8 µg/m3 with an interquartile range of 17.1-104.9, reflecting, in part, the long time spanned. The Vancouver study used monitoring network data for PM10 but used both LUR models and monitoring
network data (IDW) to estimate PM2.5 exposures (Brauer et al. 2008); results for both Vancouver
PM2.5 estimates are shown below.
Socioeconomic status. Eleven of the research groups used maternal education as the
indicator of SES for Model 1 (Table 1). However, the maternal education measure varied in form and meaning across studies. Three studies relied on contextual information based on neighborhood characteristics to define maternal SES for Model 1 of the primary analysis (Table 1). Some research groups included additional individual level socioeconomic measures for Model 2 and in secondary analyses (See Supplemental Material, Table 1). For example, paternal occupation was used in the Lombardy study. The California study added area-level
socioeconomic measures. Similarly, the Vancouver study added an additional area-level income variable. Some research groups included individual-level characteristics which may correlate with socioeconomic status: maternal age, race, ethnicity, indigenous status, and country of birth.
Birthweight
The relative odds of term-LBW per 10 µg/m3 increase in mean PM10 concentration
during pregnancy, adjusted for SES (Model 1) are shown by location in Figure 1. Associations differed among study locations (p-value from test for heterogeneity < 0.001). Six studies indicated a statistically significant positive (adverse) association (Atlanta, California,
Connecticut/Massachusetts, PAMPER, São Paulo, and Seoul) while the Sydney and Vancouver studies indicated an adverse, albeit not significant, association (Figure 1). Little or no
association was reported by seven studies; no research group reported significant inverse (protective) associations.
Figure 2 shows estimated odds ratios from Model 2 (models fitted with additional
covariates; see Supplemental Material, Table 1). Additional covariates varied among studies and included maternal age and transformations of age, parity, antenatal visits, country of birth, gender, maternal smoking, maternal alcohol, maternal hypertension, maternal diabetes, season of conception, year of birth, marital status, race/ethnicity, indigenous status, gestational age, and contextual measures of socioeconomic status. About half of Model 2 ORs suggest slightly stronger associations between air pollution and term-LBW than Model 1 ORs while other Model 2 ORs were either very similar or attenuated compared with Model 1 (see Supplemental Material Table 2 for a direct comparison of estimates). Associations differed among study locations (p-value from test for heterogeneity < 0.05).
Changes in mean term birth weight associated with each 10 g/m3
increase in PM10 are
shown in Figure 3 for the 11 locations reporting continuous birth weight results. The mean estimated change ranged from a 42.2 g decrease (Generation R) to an increase of about 20 g (the
Atlanta study), with most estimates (9 out of 11) indicating a 2 to 20 g lower birth weight
associated with each 10 g/m3
increase in PM10 exposure. Of the 11 studies, 6 reported a
statistically significant adverse effect of PM10, while 2 (the Atlanta and Lombardy studies)
indicated a significant protective effect. These associations differed among study locations (p-value from test for heterogeneity < 0.001). After controlling for study-specific factors, model coefficients, often, although not always, suggested larger decreases in birth weight with increases in PM10 (see Supplemental Material, Table 3). In the Atlanta study, the estimate changed from
an apparent mean increase of 20 g to a mean decrease of -28.8 g (-49.6,-8.1) whereas PIAMA’s estimate changed to an apparent increase (47.0 g (-10.5, 104.6)) after controlling for location-specific confounders.
Figure 4 shows estimated relative odds of low birth weight associated with each 10 g/m3
increase in PM2.5 concentration, after controlling for SES, for a subset of studies. As for PM10,
some studies indicated a significant increase in the relative odds of LBW while others indicated no association. The Vancouver study reported different results using different PM2.5 estimates.
P-values from separate heterogeneity tests, each including one Vancouver estimate, were 0.06 (LUR) and 0.18 (IDW).
DISCUSSION
Despite the deliberately simple protocol and the heterogeneity in study designs and locations, we found some consistency across studies, particularly for the relationships between PM10 and mean birth weight and PM2.5 and low birth weight. After controlling for SES, the
20 g, for 9 of 11 locations. Although based on fewer studies than those for PM10, the initial tests
of homogeneity for PM2.5 results were not statistically significant. More detailed meta-analysis
of the initial results, considering alternative models, influential locations, and differences in location-specific covariates and exposures may improve our understanding of these relationships and lead to improved summary estimates.
Based on a discussion of initial feasibility study results at the 2009 workshop in Dublin, Ireland, participants concluded that the method used to estimate PM10 exposures may be the most
critical design difference among the studies. Some prior studies from California (Basu et al. 2004; Wilhelm and Ritz 2003), Vancouver (Brauer et al. 2008), Sydney (Mannes et al. 2005), and Atlanta (Darrow et al. 2009a) have examined the consequences of different methods for calculating pollution metrics in the same study but from different perspectives. For example, as in the results presented in Figure 4, Brauer et al. (2008) compared PM2.5 estimates from LUR and
monitor data (IDW) and concluded that their moderate correlation could be due to different aspects of variability being captured by each method. Basu et al. (2004) found stronger
associations for exposures estimated over larger geographic areas than over smaller geographic areas, but did not speculate on the reasons for the discrepancy; however, Basu et al (2004) cautioned that studies using different methods for exposure assessment may not be comparable.
Importantly, there is large variation in PM10 levels and concentration ranges among study
locations. In the Vancouver study, for example, the 10 g/m3
increase used to derive odds ratios is nearly an order of magnitude greater than the interquartile range (11.7 to 13.1, Table 2) of exposures. Similarly, in the Atlanta study, the 10 g/m3
reporting unit represents more than the entire range of PM10 concentrations18.6 to 29.6). The analytical methods used in the common
evidence supporting the hypothesis that no threshold exists for PM relationships and overall population mortality (Daniels et al 2000), threshold assumptions have not been fully explored for adverse reproductive outcomes, including birth weight. Non-linear relationships were not
directly examined in this feasibility study, however, they may contribute to heterogeneity among studies; a more fully coordinated analysis should improve our ability to assess non-linear
relationships.
Covariates likely to affect the relationship between PM10 and low birth weight differ
among study locations for many reasons (Strickland et al. 2009). For studies that estimate effects based on spatial contrasts, controlling for SES can be important because it may be
spatially correlated with exposure concentrations (O’Neill et al. 2003). However, SES measures and their relationships with both birth outcomes and air pollution are not consistent. For
example, while mothers with lower SES generally tend to have poorer birth outcomes, the strength of the relationship differs depending on which birth outcome (birth weight, preterm birth) and which measures of SES (maternal education, occupation) are used (Parker et al. 1994; Pickett et al. 2002). While in some places, mothers with higher SES live in less polluted areas (Woodruff et al. 2003), in others, the opposite relationship holds (Slama et al. 2007). Because participating studies rely on exposure estimates with differing spatial and temporal components, critical confounders may differ among studies (Strickland et al. 2009). Changes between results for the SES-only and SES plus covariates models varied among studies, suggesting that other statistical approaches, possibly hierarchical models, that allow for different types of confounding factors could be informative for understanding apparent variations among locations.
Finally, other methods of analysis could be used. While logistic regression is commonly applied, alternative approaches have considered spatial correlations (Jerrett et al. 2005),
time- varying exposures (Suh et al. 2009), generalized additive models (Ballaster et al. 2010) and hierarchical structures (Yi et al. 2010). Bell et al. (2007) proposed a method for handling correlated exposures across trimesters. Because both model-based and spatial averaged exposures estimates are calculated with error, considering their precision would provide more accurate confidence intervals (Woodruff et al. 2009).
The ICAPPO feasibility project successfully coordinated analyses of the association between ambient PM concentrations and term-LBW, across multiple locations, datasets, and research teams worldwide. These initial results and the participation of multiple research groups, even without external funding, support the continuation of this effort to increase our
References
Australian Bureau of statistics: Socio-economic indexes for areas, Australia 2001, ABS Catalogue no 2039.0, Canberra: Australia.
Baccarelli A, Zanobetti A, Martinelli I, Grillo P, Hou L, Lanzani G et al. 2007. Air pollution, smoking, and plasma homocysteine. Environ Health Perspect 115:176-181.
Ballester F, Estarlich M, Iñiguez C, Llop S, Ramón R, Esplugues A et al. 2010. Air pollution exposure during pregnancy and reduced birth size: a prospective birth cohort study in Valencia, Spain. Environ Health 9:6.
Basu R, Woodruff TJ, Parker JD, Saulnier L, Schoendorf KC. 2004. Comparing exposure metrics in the relationship between PM2.5 and birth weight in California. J Expo Anal Environ Epidemiol. 14:391-396.
Bell ML, Ebisu K, Belanger K. 2007. Ambient Air Pollution and Low Birth Weight in Connecticut and Massachusetts. Environ Health Perspect 115:1118-1125.
Bell ML, Ebisu K, Belanger K. 2008. The relationship between air pollution and low birth weight: effects by mother’s age, infant sex, co-pollutants, and pre-term births. Environ Res Letters 3, Art. No. 044003.
Brauer M, Lencar C, Tamburic L, Koehoorn M, Demers P, Karr C. 2008. A cohort study of traffic-related air pollution impacts on birth outcomes. Environ Health Perspect 116:680-686.
Cyrys J, Heinrich J, Hoek G, Meliefste K, Lewne M, Gehring U et al. 2003. Comparison
between different particle indicators: Elemental carbon (EC), PM2.5 mass and absorbance. J Expo Anal Environ Epidemiol 13:134-143.
Daniels MJ, Dominici F, Samet JM, Zeger SL 2000. Estimating particulate matter-mortality dose-response curves and threshold levels: an analysis of daily time series for the 20 largest US cities. Am J Epidemiol 152:397-406.
Darrow LA, Klein M, Flanders WD, Waller LA, Correa A, Marcus M, et al. 2009a. Ambient air pollution and preterm birth: a time-series analysis. Epidemiology 20:689-698.
Darrow LA, Strickland MJ, Klein M, Waller LA, Flanders WD, Correa A, et al. 2009b. Seasonality of birth and implications for temporal studies of preterm birth. Epidemiol 20:699-706.
Fanshawe TR, Diggle PJ, Rushton S, Sanderson R, Lurz PWW, Glinianaia SV et al. 2008. Modelling spatio-temporal variation in exposure to particulate matter: a two-stage approach. Environmetrics. 19: 549-566.
Gehring U, Wijga AH, Fischer P, de Jongste JC, Kerkhof M, Koppelman GH et al. 2011. Traffic-related air pollution, preterm birth and term birth weight in the PIAMA birth cohort study. Environ Res. 111(1):125-135.
Glinianaia SV, Rankin J, Bell R, Pless-Mulloli T, Howel D. 2004. Particulate air pollution and fetal health: a systematic review of the epidemiologic evidence. Epidemiol 15:36-45.
Glinianaia SV, Rankin J, Pless-Mulloli T, Pearce MS, Charlton M, Parker L. 2008. Temporal changes in key maternal and fetal factors affecting birth outcomes: a 32-year population-based study in an industrial city. BMC Pregnancy Childbirth 8:39.
Gouveia N, Bremner SA, Novaes HM. 2004. Association between ambient air pollution and birth weight in São Paulo, Brazil. J Epidemiol Community Health 58:11-17.
Ha EH, Lee BE, Park HS, Kim YS, Kim H, Kim YJ et al. 2004. Prenatal Exposure to PM10 and Preterm Birth between 1998 and 2000 in Seoul, Korea. J Prev Med Public Health 37:300-305.
Ivy D, Mulholland J, Russell A. 2008. Development of ambient air quality population-weighted metrics for use in time-series health studies. J Air Waste Manag Assoc 58: 711-720.
Jalaludin B, Mannes T, Morgan G, Lincoln D, Sheppeard V, Corbett S. 2007. Impact of ambient air pollution on gestational age is modified by season in Sydney, Australia. Environ Health 6:16.
Jerrett M, Burnett RT, Ma R, Pope CA 3rd, Krewski D, Newbold KB, Thurston G, Shi Y, Finkelstein N, Calle EE, Thun MJ. 2005. Spatial analysis of air pollution and mortality in Los Angeles. Epidemiol 16:727-736.
Kaufman JS, Alonso FT, Pino P. 2008 Multi-level modeling of social factors and preterm delivery in Santiago de Chile. BMC Pregnancy Childbirth. 8;8:46.
Lepeule J, Caini F, Bottagisi S, Galineau J, Hulin A, Marquis N et al. 2010. Maternal exposure to nitrogen dioxide during pregnancy and offspring birth weight: Comparison of two exposure models. Environ Health Perspect. 118:1483-1489.
Mannes T, Jalaludin B, Morgan G, Lincoln D, Sheppeard V, Corbett S. 2005. Impact of ambient air pollution on birth weight in Sydney, Australia. Occup Environ Med. 62:524-530.
Morello-Frosch R, Jesdale BM, Sadd JL, Pastor M. 2010. Ambient air pollution exposure and full-term birth weight in California. Environ Health. 28;9:44.
Muir D, Laxen DP. 1995. Black smoke as a surrogate for PM10 in health studies. Atmos Environ 29:959-962.
O'Neill MS, Jerrett M, Kawachi I, Levy JI, Cohen AJ, Gouveia N et al. 2003. Workshop on Air Pollution and Socioeconomic Conditions. Environ Health Perspect 111:1861-1870.
Parker JD, Schoendorf KC, Kiely JL. 1994. Associations between measures of socioeconomic status and low birth weight, small for gestational age, and premature delivery in the United States. Ann Epidemiol 4:271-278.
Pearce MS, Glinianaia SV, Rankin J, Rushton S, Charlton M, Parker L et al. 2010. No
association between ambient particulate matter exposure during pregnancy and stillbirth risk in the north of England, 1962-1992. Environ Res 110:118-122.
Pesatori AC, Bonzini M, Carugno M, Giovannini N, Signorelli V, Baccarelli A et al. 2008. Ambient air pollution affects birth and placental weight. A study from Lombardy (Italy) region. Epidemiology 19 (S):178-179.
Pickett KE, Ahern JE, Selvin S, Abrams B. 2002. Neighborhood socioeconomic status, maternal race and preterm delivery: a case-control study. Ann Epidemiol. 12:410-418.
Rich DQ, Demissie K, Lu SE, Kamat L, Wartenberg D, Rhoads GG. 2009. Ambient air pollutant concentrations during pregnancy and the risk of fetal growth restriction. J Epidemiol Community Health. 63:488-496.
Ritz B, Wilhelm M. 2008. Ambient air pollution and adverse birth outcomes: methodologic issues in an emerging field. Basic Clin Pharmacol Toxicol 102:182-190.
Slama R, Morgenstern V, Cyrys J, Zutavern A, Herbarth O, Wichmann HE et al. 2007. Traffic-related atmospheric pollutants levels during pregnancy and offspring’s term birth weight: A study relying on land-use-regression exposure models. Environ Health Perspect 115:1283-1292.
Slama R, Darrow L, Parker J, Woodruff TJ, Strickland M, Nieuwenhuijsen M et al. 2008. Meeting report: atmospheric pollution and human reproduction. Environ Health Perspect. 116:791-798.
Slama R, Thiebaugeorges O, Goua V, Aussel L, Sacco P, Bohet A et al. 2009. Maternal personal exposure to airborne benzene and intrauterine growth. Environ Health Perspect. 117:1313-1321.
Srám RJ, Binková B, Dejmek J, Bobak M. 2005. Ambient air pollution and pregnancy outcomes: a review of the literature. Environ Health Perspect 113:375-382.
Sterne, JAC, Bradburn MJ, Egger M. 2001. Meta-analysis in Stata. In: Systematic Reviews in Health Care: Meta-Analysis in Context, 2nd Edition. (Egger M, Davey Smith G, Altman DAeds). London: BMJ Publishing Group 347-369.
Strickland MJ, Klein M, Darrow LA, Flanders WD, Correa A, Marcus M et al. 2009. The issue of confounding in epidemiological studies of ambient air pollution and pregnancy outcomes. J Epidemiol Community Health 63:500-504.
Suh YJ, Kim H, Seo JH, Park H, Kim YJ, Hong YC, Ha EH. 2009. Different effects of PM10 exposure on preterm birth by gestational period estimated from time-dependent survival analyses.. Int Arch Occup Environ Health 82:613-621.
Townsend P, Phillimore P, Beattie. 1988. A: Health and deprivation: inequality and the north. London , Routledge.
van den Hooven EH, Jaddoe VW, de Kluizenaar Y, Hofman A, Mackenbach JP, Steegers EA et al. 2009. Residential traffic exposure and pregnancy-related outcomes: a prospective birth cohort study. Environ Health 8:59
Wesseling J, den Boeft J, Boersen GAC, Hollander K, van den Hout KD, Keuken MP et al. 2002. Development and validation of the new TNO model for the dispersion of traffic emissions, 8th Int. Conf. On Harmonisation within Atmospheric Dispersion Modelling for Regulatory Purposes, 456-460.
Wilhelm M, Ritz B. 2005. Local variations in CO and particulate air pollution and adverse birth outcomes in Los Angeles County, California, USA. Environ Health Perspect 113:1212-1221.
Woodruff TJ, Parker JD, Adams K, Bell ML, Gehring U, Glinianaia S, et al. 2010. International Collaboration on Air Pollution and Pregnancy Outcomes (ICAPPO). Int J Environ Res Public Health. 7:2638-2652.
Woodruff TJ, Parker JD, Darrow LA, Slama R, Bell ML, Choi H, et al. 2009. Methodological issues in studies of air pollution and reproductive health. Environ Res 109:311-320.
Woodruff TJ, Parker JD, Kyle AD, Schoendorf KC. 2003. Disparities in exposure to air pollution during pregnancy. Environ Health Perspect. 111:942-946.
Yi O, Kim H, Ha E. 2010. Does area level socioeconomic status modify the effects of PM(10) on preterm delivery? Environ Res 110:55-61.
Appendix
The authors wish to thank Jason Harless for coordinating many aspects of the feasibility study and all of the participants at the 2009 Dublin, Ireland ICAPPO Workshop who contributed their insights and ideas:
Inmaculada Aguilera, Ferran Ballester, Kathleen Belanger, Moon-Hee Chang, Gwen Collman, Miroslav Dostal, Kimberly Gray, Carmen Iñiguez, Byung-Mi Kim, Kinga Polanska, Judith Rankin
The authors wish to thank the principal investigators and scientific teams of the participating centers. For the PIAMA study: B. Brunekreef (Utrecht University and University Medical Center Utrecht, The Netherlands); H.A. Smit (National Institute for Public Health and the Environment (RIVM) and University Medical Center Utrecht, The Netherlands); A.H. Wijga (National Institute for Public Health and the Environment (RIVM), The Netherlands); J.C. de Jongste (Erasmus University Medical Center/Sophia Children’s Hospital Rotterdam, The
Netherlands; Gerritsen, D.S. Postma, M. Kerkhof, G.H. Koppelman (Medical Center Groningen, The Netherlands), R.C. Aalberse (Sanquin Research, Amsterdam, The Netherlands).). The PIAMA study is supported by The Netherlands Organization for Health Research and
Development; The Netherlands Organization for Scientific Research; The Netherlands Asthma Fund; The Netherlands Ministry of Spatial Planning, Housing, and the Environment; and The Netherlands Ministry of Health, Welfare, and Sport. the PAMPER study,
the Eden study, Marie-Aline Charles her group (Inserm 1018 and Inserm-Ined joint research team).
For the Vancouver analysis, the linked research database was provided by Population Data BC. Medical services and hospitalization data were provided by the Ministry of Health, Government of British Columbia; Vital Statistics data by the British Columbia Vital Statistics Agency; and perinatal data by the British Columbia Reproductive Care Program.
Table 1: Birth years, number of births, percent term low birth weight (LBW) and measure of socioeconomic status (SES) used in Model 1 (adjusted for SES only), by study
SES measure used in Model 1 of feasibility study Study and locationa Birth years Number of
birthsb
Percent term
LBW Measure Descriptive statistics Atlanta, Georgia,
USA (Darrow et al. 2009a, 2009b) 1996-2004 325,221 2.62 Attained maternal education Years: 19.8% < 12, 24.7% 12, 55.5% >12 California, USA (Morello-Frosh et al. 2010) 1996-2006 1,714,509 2.43 Attained maternal educationc Years: 31.5% < 12, 28.0% 12, 40.5% > 12 Connecticut and Massachusetts, USA (Bell et al. 2007, 2008) 1999-2002 173,042 2.16 Attained maternal
education Mean 13.6 years (SD 2.6) EDEN, Poitiers and
Nancy, France (Lepeule et al. 2010) 2003-2006 1,233 2.11 Age at completion of education Age, years: 17.7 % <19, 61.7% 19-24, 20.6% >24 Lombardy, Italy (Pesatori et al. 2008) 2004-2006 213,542 2.71 Attained maternal education
Degree: 33.3% < high school degree, 45.8 % high school degree, 3.6% bachelor degree, 17.6% graduate degree
SES measure used in Model 1 of feasibility study Study and locationa Birth years Number of
birthsb
Percent term
LBW Measure Descriptive statistics PAMPER, Newcastle upon Tyne, UK (Glinianaia et al. 2008; Pearce et al. 2010) 1962-1992 81,953 3.19
Area level indicator: Townsend Deprivation Scored
Quintiles cut-points: -1.2, 2.4, 4.7, 6.6
New Jersey, USA
(Rich et al. 2009) 1999-2003 87,281 2.75 Attained maternal education Years: 20.6% < 12, 36.5% 12, 42.9% > 12 PIAMA, the Netherlands (Gehring et al. 2011) 1996-1997 3,471 1.15 Attained maternal education Degree: 22.8% low ; 41.6% medium; 35.6% high Generation R Rotterdam, the Netherlands (van den Hooven et al. 2009)
2002-2006 7,296 2.26 Attained maternal education
Degree: 10.9% none/low; 44.7% secondary; 44.3 % higher
São Paulo, Brazil
(Gouveia et al. 2004) 2005 158,791 3.77 Attained maternal education Years: 29.3% < 7, 50.7% 8-11, 19.9% > 11 Seoul, Republic of Korea (Ha et al. 2004)
1998-2000 372,319 1.45 Attained maternal education
Degree: 4.1% < high school degree, 52.7% high school degree, 43.2% <=bachelor degree
SES measure used in Model 1 of feasibility study Study and locationa Birth years Number of
birthsb
Percent term
LBW Measure Descriptive statistics Seattle, Washington USA 1998-2005 301,880 1.56 Attained maternal educationc Years: 12.8% < 12, 26.1% 12, 60.0% > 12 Sydney, Australia (Jalaludin et al, 2007) 1998-2004 279,015 1.62
Area level indicator: Index of Relative Socioeconomic Disadvantagee Quartiles cut-points: 945.1; 945.1 to 1010.7, 1010.7 to 1072.7, >1072.7 Vancouver, British Columbia Canada (Brauer et al. 2008) 1999-2002 66,467 1.35
Area level indicator: % women with post-secondary education
Quartiles cut-points: 28.8, 36.3, 44.1
a
Datasets have been used for other studies, although not necessarily studies of PM10 or term-LBW; cited analyses sometimes used
different versions of the data.
b
Births used in Model 1: Singleton, term infants with known birth weight, maternal socioeconomic status, gestational age, and ambient PM10 or black smoke concentrations.
c
Collection of maternal education changed during the study period.
d
The Townsend deprivation score is an area-based measure of material deprivation (Townsend et al. 1988), calculated for each enumeration district (approximately 200 households) based on 1971, 1981 and 1991 Census data.
e
The Australian Bureau of Statistics' Index of Relative Socio-economic Disadvantage (IRSED) (Australian Bureau of statistics 2001) uses a range of census factors and is assigned to each Census Collection District (approximately 200 households).
Table 2. PM10 distribution, method of exposure estimation, area, and source of exposure variability, by study
PM10 distribution, (g/m3)
Study Median 25th 75th Method of exposure estimation
Approx-imate areaa
(km2)
Exposure contrastb Atlanta 23.5 22.3 25.4 Monitoring network. Population-weighted
spatial average over city. (Ivy et al. 2008) 4,538 temporal California 28.9 22.6 38.7 Monitoring network. Nearest monitor
within 10 km of residence. 423,970
a spatial and
temporal Connecticut and
Massachusetts 22.0 18.1 25.5
Monitoring network. Spatial average over
county of residence. 41,692
spatial and temporal EDEN 19.0 18 21 Monitoring network. Nearest monitor
within 20 km of residence. 480
spatial and temporal Lombardy 49 44 54
Monitoring network. Average of monitoring stations located in 9 regional
areas (Baccarelli et al. 2007)
23,865 spatial and temporal PAMPERc (PM10 not available) Spatial-temporal model for black smoke
(Fanshawe et al. 2008) 63
spatial and temporal New Jersey 28.0 24.8 31.7 Monitoring network. Nearest monitor
within 10 km of residence. 22,592
a spatial and
temporal PIAMA 40.5 36.7 43.4
Land use regression (LUR) model (Gehring et al. 2011) with temporal adjustment using air monitoring network
datad
12,000 spatial and temporal
PM10 distribution, (g/m3)
Study Median 25th 75th Method of exposure estimation
Approx-imate areaa
(km2)
Exposure contrastb Generation R 32.8 32.2 33.3 Dispersion model (Wesseling et al. 2002) 150 spatial São Paulo 40.3 39.2 42.1 Monitoring network. Average from 14
monitors throughout city. 1,500 temporal Seattlee (PM10 not available)
Monitoring network. Population-weighted spatial average of PM2.5 for monitors within
20 km of residence (Ivy et al. 2008)
spatial and temporal Seoul 66.45 59.63 69.72 Monitoring network. Average from 27
monitors throughout city. 605
spatial and temporal Sydney 16.50 12.8 21.0 Monitoring network. Average from 8
monitors throughout city. 12,145 temporal Vancouver 12.5 11.7 13.1
Monitoring network. Inverse distance weighting of up to 3 monitors within 50 km
of residence.f
3,300 spatial and temporal
a
Approximate geographic area in which mothers reside; in California and New Jersey, the geographic area includes maternal addresses too far from a PM10 or PM2.5 monitoring site to be included in the study.
b
Temporal contrast is used to describe studies where exposure estimates differ among mothers based on the timing of their pregnancy; spatial contrast is used to describe studies where exposure estimates differ among mothers based on their residence.
c
Only Black Smoke available (Black smoke is a historic measure of airborne PM, an approximate equivalent to PM4 (black smoke ~
PM4), shown to be a reasonable predictor of daily average PM10) (Muir and Laxon, 1995). d
PM10 estimated from PM2.5 LUR model results (see text). e
Figure Legends
Figure 1. Odds ratios (and 95% confidence intervals) for low birth weight among term births in association with a 10 µg/m3 increase in estimated average PM10, or black smoke (PAMPER),
concentration during the entire pregnancy, adjusted for socioeconomic status (Model 1), by study.
Figure 2. Odds ratios (and 95% confidence intervals) for low birth weight among term births in association with a 10 µg/m3 increase in estimated average PM10, or black smoke (PAMPER),
concentration during the entire pregnancy, adjusted for socioeconomic status and study-specific variables (Model 2), by study.
Figure 3. Change in mean birth weight (and 95% confidence intervals) among term births in association with a 10 µg/m3 increase in estimated average PM10, or black smoke (PAMPER),
concentration during the entire pregnancy, adjusted for socioeconomic status, by study.
Figure 4. Odds ratios (and 95% confidence intervals) for low birth weight among term births in association with a 10 µg/m3 increase in estimated average PM2.5 concentrationa during the entire
pregnancy, adjusted for socioeconomic status, by study.
a
Results for the Vancouver study are from two different PM2.5 estimation methods, land use