SÉRIE ÉTUDES ET DOCUMENTS
Decentralization, spending efficiency and pro-poor outcomes in
Morocco
Maria Elkhdari
Babacar Sarr
Études et Documents n° 5
April 2018
To cite this document:
Elkhdari M., Sarr B. (2018) “Decentralization, spending efficiency and pro-poor outcomes in Morocco”, Études et Documents, n°5, CERDI.
http://cerdi.org/production/show/id/1919/type_production_id/1 CERDI
65 BD. F. MITTERRAND
63000 CLERMONT FERRAND – FRANCE TEL.+33473177400
FAX +33473177428 www.cerdi.org
2
The authors
Maria Elkhdari PhD in Economics
School of Economics and Centre d’Etude et de Recherche sur le Développement
International (CERDI), UMR CNRS 6587, University of Clermont Auvergne, Clermont-Ferrand, France.
E-mail: [email protected]
Babacar Sarr Economist
International Monetary Fund, Washington, USA. E-mail: [email protected]
Corresponding author: Maria Elkhdari.
This work was supported by the LABEX IDGM+ (ANR-10-LABX-14-01) within the program “Investissements d’Avenir” operated by the French National Research Agency (ANR).
Études et Documents are available online at: http://www.cerdi.org/ed Director of Publication: Grégoire Rota-Graziosi
Editor: Catherine Araujo Bonjean Publisher: Mariannick Cornec ISSN: 2114 - 7957
Disclaimer:
Études et Documents is a working papers series. Working Papers are not refereed, they constitute research in progress. Responsibility for the contents and opinions expressed in the working papers rests solely with the authors. Comments and suggestions are welcome and should be addressed to the authors.
Abstract
This paper studies how decentralization affects poverty, vulnerability, and inequality in Morocco, in the context of ongoing regionalization reforms. We use different non-parametric approaches to assess spending efficiency of Moroccan municipalities and regions over the period 2005-2009. The results indicate that the efficiency of spending in improving pro-poor outcomes is dependent on the fiscal autonomy of subnational governments. While the impact of transfer dependency is not statistically significant, more granular data show that formula-based (unconditional) transfers significantly improve spending efficiency when the opposite is true for ad-hoc (conditional) transfers. Furthermore, we investigate the impact of political decentralization and find that local spending is less efficient in regions where municipal governments have a greater responsibility for spending compared to the regional government. This finding also holds in more fragmented regions with a high number of municipalities. Finally, we test whether there is an electoral budget cycle in Morocco and find that spending efficiency decreases the year of local elections, but increases with the level of education of elected officials.
Keywords
Decentralization, Morocco, Poverty, Vulnerability, Inequality, Public spending efficiency, Data Envelopment Analysis, Partial Frontier Analysis.
JEL Codes
I3, C23, H5, C14, H7.
CONTENTS
I. INTRODUCTION ... 5
II. REVIEW OF THE RELEVANT LITERATURE ... 8
II.1 DECENTRALIZATION AND SPENDING EFFICIENCY ... 8
II.2 DECENTRALIZATION AND PRO-POOR OUTCOMES ... 10
III. OVERVIEW OF DECENTRALIZATION IN MOROCCO ... 10
III.1 LEGAL FRAMEWORK ... 11
III.2 SUBNATIONAL FINANCIAL RESOURCES ... 12
IV. METHODOLOGY AND DATA ... 15
IV.1 DEA METHODOLOGY... 15
IV.2 DATA ... 17
V. RESULTS AND ROBUSTNESS CHECKS ... 18
V.1 EFFICIENCY SCORES OF MOROCCAN REGIONS ... 18
V.2 SIZE OF LOCAL GOVERNMENTS AND SPENDING EFFICIENCY ... 19
V.3 FISCAL AUTONOMY, TRANSFER DEPENDENCY, AND SPENDING EFFICIENCY ... 21
V.4 TRANSFER CONDITIONALITY AND SPENDING EFFICIENCY ... 22
V.5 POLITICAL DECENTRALIZATION AND SPENDING EFFICIENCY ... 23
V.6 SPENDING EFFICIENCY IN THE CONTEXT OF LOCAL ELECTIONS ... 25
V.7 ROBUSTNESS CHECKS ... 26
V.7.1 Partial Frontier Analysis and Fractional Regression Model ... 26
V.7.2 Additional control variables ... 27
VI. CONCLUSION ... 27
VII. REFERENCES ... 29
I. INTRODUCTION
Economic poverty and vulnerability, and income inequality remain some of the most challenging public policy problems in many emerging and developing economies. One central question for academics and policymakers has been how to enhance the role of government taxation and spending policies to affect income redistribution and promote socio-economic development. In many countries, governments have promoted decentralization as a mean to achieve these goals through improved economic efficiency, and two principal arguments have supported this view. One argument is that decentralization prevents agency problems between national and local governments and the latter are assumed to be better able to adapt policy measures to local needs ( Oates, 1972; Nativel and Sunley, 2002; OECD, 2003; Balaguer-Coll et al., 2010). Another argument is that decentralization by enhancing transparency, public accountability, and political participation tend to incentivize local authorities to make efficient spending decisions (Putnam, 1993; Seabright, 1995).
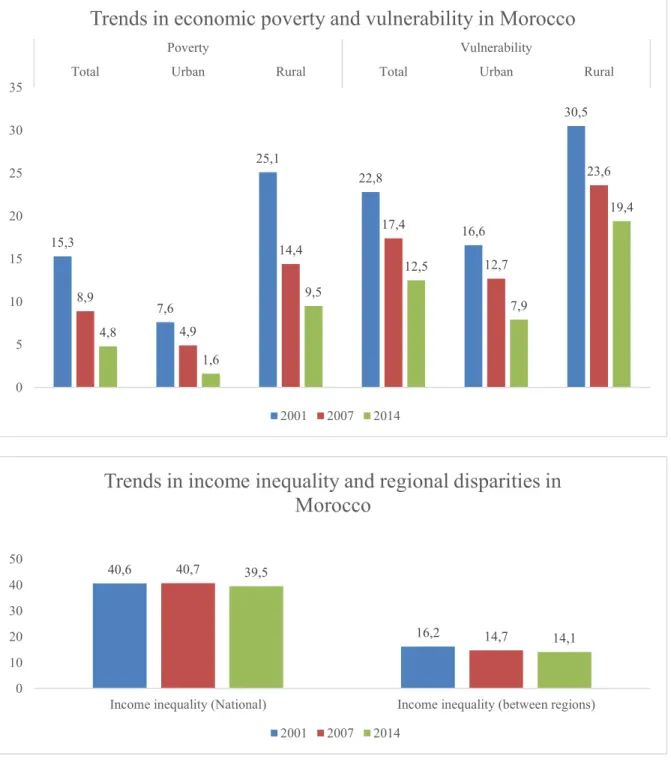
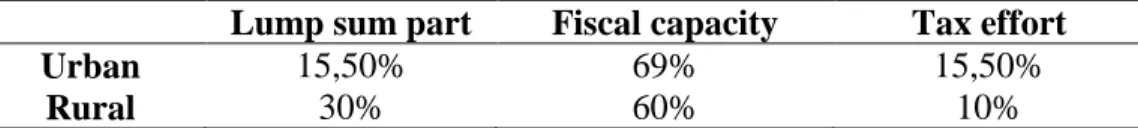
In Morocco, the government has engaged in a consolidation of decentralization reforms to enable the regions to effectively promote, in partnership with other subnational governments, balanced socio-economic development through territorial-based policies (World Bank, 2009a). Indeed, the Constitution of 20111 emphasized the preeminent role of the region in coordinating and integrating the visions, plans and programs of other subnational authorities, while taking into account their autonomy and respective competencies. In this perspective, the advanced decentralization process should make it possible to overcome major deficits in health, education, road infrastructure, and access to electricity among others. These sectors are directly linked to human development and overlap with the prerogatives that are increasingly devolved to the regions. However, the question of the relevance of these reforms arises as decentralization may end up aggravating inter-regional disparities without correcting intra-regional disparities (Tiebout, 1956). In Morocco, disparities between regions have remained broadly stable over the last few years (Figure 1). Thus, the central question is whether the decentralization process has been successful so far in enabling regions to reduce poverty, vulnerability, and inequality notably through more efficient spending. Morocco has
experienced a sharp reduction of poverty and vulnerability recently, although at different paces in rural and urban areas. However, income inequality remains relatively high.
Figure 1: Evolution of poverty and vulnerability in Morocco
Source: Haut-Commissariat du Plan and authors’ calculations.
The empirical literature on decentralization in developing countries is relatively scant due to the lack of longitudinal data on the lower levels of government, and most existing analyses are
15,3 7,6 25,1 22,8 16,6 30,5 8,9 4,9 14,4 17,4 12,7 23,6 4,8 1,6 9,5 12,5 7,9 19,4 0 5 10 15 20 25 30 35
Total Urban Rural Total Urban Rural
Poverty Vulnerability
Trends in economic poverty and vulnerability in Morocco
2001 2007 2014 40,6 16,2 40,7 14,7 39,5 14,1 0 10 20 30 40 50
Income inequality (National) Income inequality (between regions)
Trends in income inequality and regional disparities in
Morocco
cross-country studies. Therefore, the objective of this paper is to contribute to this literature by assessing the impact of decentralization on poverty, vulnerability, and income distribution in Morocco. Several aspects of decentralization will be investigated, including the effectiveness of political and fiscal decentralization. Additionally, this work goes beyond the traditional analysis of the effects of decentralization in the context of the existing literature, and makes two important contributions: first, it assesses if the effects of intergovernmental transfers vary depending on whether they are allocated according a transparent formula (unconditional transfers) or on an ad-hoc basis (conditional transfers). Second, it assesses whether the sharing of spending responsibilities and the fragmentation of municipalities and regions affect spending efficiency.
The study is based on a sample of 16 regions and 1503 municipalities and covers the period 2005-2009. Using different nonparametric approaches to measure efficiency, we find that regions with higher budgets display less efficient spending. However, when local authorities are able to finance a larger part of their spending by raising their own revenues, spending is more efficient in reducing poverty, vulnerability, and inequality. Turning to our main contributions, we find that while overall transfer dependency does not significantly affect spending efficiency, more granular information on different types of transfers show that transfers based on a transparent allocation formula improve spending efficiency, whereas the opposite is true when transfers are allocated to subnational governments in a discretionary fashion. Another important finding is that spending is less efficient in regions where municipal governments are responsible for more public spending compared to the regional government. Moreover, regions that are more fragmented also have weaker performance in terms of spending efficiency. Finally, we test the existence of an electoral budget cycle and political accountability and find that in Morocco, spending efficiency decreased the year of local elections. When we look more closely at the characteristics of elected officials, our results also show that the higher their level of education the more efficient the local government is in the use of public resources.
Overall, the results suggest that the Moroccan central government, in promoting advanced regionalization, needs to encourage efficiency-enhancing behavior while taking into account local governments' financial and decision-making power constraints. Compared to municipalities, regions must be given a more prominent role in spending in order to ensure a
territorial coherence of local policy making; they could also serve as intermediate entities between the central government and the municipalities. Indeed, an appropriate balance of multi-tier decentralization is essential to promote an effective and efficient functioning of subnational governments, and the latter could also help achieve higher human development if their financial resources are carefully designed and tailored to their new responsibilities. The rest of the paper proceeds as follows. Section II provides a brief review of the relevant literature and section III presents an overview of decentralization in Morocco. Section IV describes the methodology and data. Section V presents the main results and goes through several robustness checks of the main results. Finally, Section VI concludes.
II. REVIEW OF THE RELEVANT LITERATURE II.1 Decentralization and spending efficiency
The arguments in favor of decentralization have been built around efficiency gains, due to the greater capacity of decentralized systems to match service provision to the preferences of citizens. According to Balaguer-Coll et al., (2010), decentralization can be a solution to agency problems between national and local governments. They argue that local governments are better placed to respond to local needs, making public policies more effective. This corresponds to Oates's (1972) decentralization theorem, which provides for greater efficiency in the provision of public services when this responsibility is devolved to lower levels of government that are closer to people and better informed of their needs than the central government. Tiebout, (1956) also underscores the role of inter-territorial competition in contributing to greater local efficiency. Competition at the local and regional level tends to encourage governments to focus on the efficient production of public goods and services. Putnam (1993) also argues that decentralized systems have an indirect positive effect on effectiveness because they tend to be more accountable, transparent, and increase political participation. Thiessen, (2003) states that smaller jurisdictions are better able to adapt their policies to the specific preferences of their populations and the greater the variation in preferences, the greater the potential benefits of decentralization.
These arguments have been supported by some empirical research. Borger and Kerstens, (2000) study of Belgian municipalities is a pioneering empirical analysis of local government
efficiency. They find a positive and significant relationship between high local tax rates and spending efficiency. They also underscore the necessity of considering the source of financing of the region's expenditures, as their efficiency is directly subject to the main source of revenues. Similarly, Otsuka et al., (2010) show that transfers from the Japanese central government to local governments had a negative impact on their performance as government funding reduced their motivation towards efficient use of taxpayers' money in the supply of public goods. A study by Grassmueck and Shields, (2010) for the US shows that regions with fragmented governmental structures perform better. However, they do not suggest that fragmented regional government units are more efficient in producing and providing public goods, but argue that households and firms may be willing to forego additional efficiency for more localized control over public policies. Akai and Sakata, (2002) also report a positive association between fiscal decentralization and economic performance in the US, as do Zhang and Zou, (2001) for the case of India.
However, there is another strand of literature that points towards the dangers of decentralization. According to Rodríguez-Pose and Bwire, (2003) a national supply of public goods and services may, under certain circumstances, be more effective than their supply at the regional or local level. Such circumstances include the existence of economies of scale and scope, where there are difficulties in assigning powers in a non-overlapping manner, and where there is greater potential for local corruption. The recent literature on fiscal federalism has also pointed to an increase in inefficiency linked to the influx of tax revenues, which may induce local authorities to relax their budget constraint. Weingast, (2009) states that local governments that strive to mobilize more own revenues tend to provide more public services, are more accountable and less corrupt. Additionally, the theory of the political agency predicts that the problem of the principal-agent in the context of the sharing of responsibility in a multi-level government can lead to an under-provision of public services due to the dysfunction of local democracy and lack of coordination due to insufficient access to information (Shleifer et al., 1993; Bardhan and Mookherjee, 2005). Besides, some authors have highlighted that the transfer of powers from national elites to local elites increases the possibilities of exacerbating corruption as it promotes relations based on proximity between civil servants and individuals or interest groups (Tanzi, 1996; Bardhan and Mookherjee, 1998; Blanchard and Shleifer, 2000; De Mello and Barenstein, 2001).
II.2 Decentralization and pro-poor outcomes
Decentralization and pro-poor outcomes have come jointly into focus through the search for good governance and related human development implications (Dethier, 2000). However,
most studies related to decentralization and human development have focused on income inequality. In fact, many authors have underscored the important role decentralization plays in explaining both regional disparities and inequalities between individuals (Chu, Davoodi, and Gupta 2000; Galli and Hoeven 2001; Dollar and Kraay 2002; Lundberg and Squire 2003). Tiebout, (1956) and Prud’homme, (1995) describe the phenomenon of “voting by feet,” which makes it possible to reduce income inequality within each region (due to the immigration of the poor and the emigration of the rich), while leaving constant or aggravating inequality at the national level. Sepulveda et al., (2010) estimate the effect of fiscal decentralization on income inequality and find that it depends on the size of the government and that fiscal decentralization reduces income inequality, if the general government represents at least 20% of the economy. Treisman, (2002) finds a positive impact of decentralization on infrastructure quality, but a negative effect of a multi-tier government structure on education and health services where corruption is prevalent. Other related empirical work has examined the effect of decentralization on inequality within regions. Tselios et al., (2011) investigate this relationship from a panel of 102 European Union regions over the 1995–2000 period. They find that greater fiscal decentralization reduces regional inequality, but this effect declines with rising levels of regional per capita income. Goerl and Seiferling, (2014) find that expenditure decentralization can have a significant effect on income inequality under certain circumstances including a large government sector, and a comprehensive decentralization of redistributive government spending. Subnational governments also have to rely primarily on their own revenue sources as opposed to intergovernmental transfers.
In general, there is no theoretical or empirical consensus on the link between decentralization and economic efficiency. Therefore, the effectiveness of decentralized systems will vary from country to country, contingent upon their underlying characteristics and institutions. The following sections will explore if decentralization has affected pro-poor outcomes in the Moroccan context through improved efficiency.
III.1 Legal framework
In Morocco, the process of decentralization has gone through different steps as laws and regulatory provisions have been adopted to expand the prerogatives and resources of local governments. The first Communal Charter dates back to 1960, later replaced by the Communal Charter of 1976; the latter was amended in 1992 and 2002 (Law 78-00). In 2008, the Government initiated a revision of the 2002 Charter to provide inter alia formal legal status to groupings of municipalities and enable them to act as special purpose vehicles. One of the main pillars of the last charter was to provide local councils with margins and tools for an adequate financial resource base to cope with responsibilities devolved to them by the central government. The responsibilities and powers of the local governments were further defined, the status of local councilors was improved, and the revenue base broadened. It also unified management of cities with more than 500,000 inhabitants, which had previously been hampered by a fragmentation across district councils, under the authority of a central communal council. There are presently three tiers of local government in Morocco: the regions, the provinces and prefectures, and the urban and rural municipalities2.
The overarching aim of decentralization in Morocco is to support broad-based regionalization based on a territorial approach. This entails the promotion of regional economic development poles through a reorganization of the current administrative structures of the provinces and prefectures, and a stronger mandate for the regions to lead the socio-economic development agenda in their respective territories. For instance, several responsibilities have been transferred to local governments such as the creation and maintenance of hospitals, lycées, and university institutes; the training of personnel at the subnational level; and the development of regional infrastructure. However, the Ministry of Interior and Ministry of Economy and Finance retain some control over decisions taken by the local councils through the tutelle on a series of measures. The preparation and execution of sub-national budgets remain under the supervision of the central government. All sub-national budgets need to be submitted to and approved by the central government before they can be approved by the local assemblies. The tutelle also requires the use of budget surpluses generated during capital budget
2 The decree 2-97-246 of August 1997 established 16 regions, 75 provinces and prefectures, and 1503
municipalities. Since the decree 2-15-40 of February 2015, the number of regions has been reduced to 12 while the number of municipalities increased to 1538.
implementation to be pre-approved. Besides, funding agencies such as the Communal Equipment Fund (FEC) have been set up by the central government to partially fill investment gaps at the local level.
III.2 Subnational financial resources
Local governments budgets represent around 10 percent of the State budget and this ratio has remained stable over the past few years (World Bank, 2009b). However, there is an imbalance in how resources are shared between the different levels of governments. On average regional government budgets represent only 5 percent of subnational budgets while municipal budgets represent close to 80 percent. The remaining 15% are the provinces and prefectures' budgets. Subnational expenditures are characterized by the predominance of current expenditures which represent around 70% of the total, leaving little room for capital expenditures. However, when we look at the composition of expenditures at each level of local government, regional governments allocate a larger share of their budget to investment (77%), where municipal governments allocate only 28% of their budget.
Local governments financial resources consist of their own-source revenues, ceded revenues from the central government, intergovernmental transfers, and loans. Some local governments also have additional resources from past budget surpluses and natural resources royalty payments3.
Own revenues: Local own revenues are managed and collected by the
municipal/regional government, which determines the tax base and the tax rate. For municipal governments, these taxes include the tax on undeveloped urban land, the tax on building operations, the social solidarity contribution on the construction of housing units, the beverage tax, the tourist tax, the tax on bottled water, the tax on public transport and the tax on the extraction of quarry and mineral products. For regional governments, these consist of the tax on hunting licenses, the tax on mining, and the tax on port services.
Local own revenues represented on average 21% of subnational government revenues4 in
2009, both in urban and rural areas.
3 Typically in regions where Phosphate, Silver, Coal, Lead, Zinc, etc… are exploited. 4 Revenues excluding past budget surpluses.
Ceded revenues: for municipal governments, ceded revenues managed by the central
tax administration include the residence tax (which replaced the property tax in 2007) which is only collected in urban municipalities, the tax on communal services, and the business license fees. The central tax administration retains 10% of the amount collected to cover its collection costs, and redistributes the remaining 90% to municipalities. The tax base and the tax rate are set annually in the central government Finance Act.
As for local own revenues, ceded revenues averaged 21% in 2009. These two sources of revenues together represent less than half of subnational revenues. Moreover, the revenues collected on behalf of rural municipalities stood at only 6.5% of their revenues compared to 24% of urban municipalities' revenues.
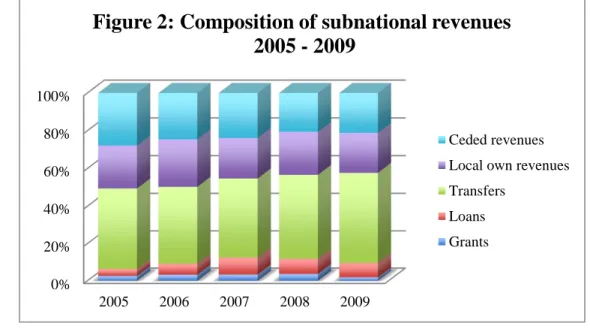
Transfers: since 1996, Morocco allocates to municipalities a share of the total VAT
revenues collected according to an explicit formula which considers their fiscal capacity and their tax effort (see table 1). Thus, 30% of the VAT revenues are transferred to municipalities and provinces while 1% of the corporate tax and the income tax revenues is transferred to regions. These transfers aim at reducing both vertical and horizontal imbalances, and to incentivize local governments to improve local revenue mobilization.
Local governments in Morocco also receive a second type of transfers called conditional or ad-hoc transfers. These represent 5% of VAT revenues and are allocated for specific purposes, including infrastructure construction, social and urban development, environmental protection, emergency funding for natural disasters or epidemics. Ad-hoc transfers are completely discretionary and the amount received by subnational governments may depend on the bargaining power of the local authorities.
Intergovernmental transfers represented on average 48% of subnational revenues in 2009, however they contribute more significantly to rural municipalities' revenues with an average share of 62%.
Table 1: Allocation criteria of formula based VAT transfers
Allocation criteria
Lump sum part Fiscal capacity Tax effort
Urban 15,50% 69% 15,50%
Source : Bulletin d’information de la Direction Générale des Collectivités Locales.
Loans and other resources: in addition to local revenues and transfers, local
governments have access to loans from the Communal Equipment Fund (FEC). The FEC is a bank under the supervision of the central government and is the main source of external financing for local authorities. The FEC also provides technical assistance and contributes to the promotion of local development. Several criteria need to be met to qualify for FEC loans: having a debt ratio below 40% of GDP; being able to generate future surpluses that can cover the entire debt service; providing a down payment of at least 20% of the cost of the project to be financed; and possessing the human, material and organizational resources to implement the project. Finally, both regional and municipal governments have some revenue sources that are less predictable and more discretionary, which include royalty payments from natural resources and previous years' budget surpluses.
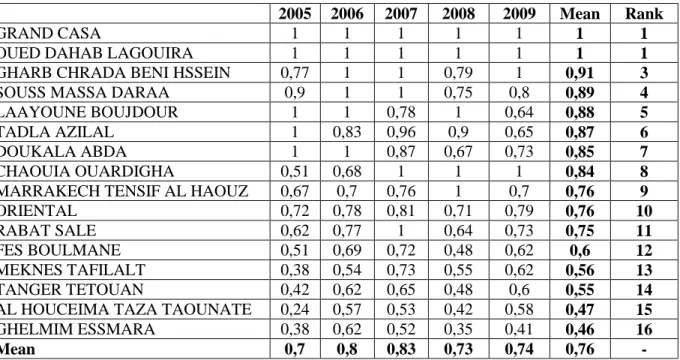
Loans represent a small share of local revenues and averaged 8% of subnational revenues in 2009. Contrarily, revenues from other sources represent a significant share of subnational budgets as many local governments usually have surpluses from past budget years. The existence of these past revenues leads to an unusual situation where subnational expenditures are always lower than subnational revenues. Figure 2 summarizes the composition of subnational revenues excluding past surpluses over the period 2005-20095.
5 See Appendix C for more details.
0% 20% 40% 60% 80% 100% 2005 2006 2007 2008 2009
Figure 2: Composition of subnational revenues
2005 - 2009
Ceded revenues Local own revenues Transfers
Loans Grants
Source: Trésorerie Général du Royaume and authors’ calculations.
IV. METHODOLOGY AND DATA
Previous studies have mostly relied on two distinct methods to evaluate public spending efficiency. The first method is referred to as the one-stage procedure that jointly estimates inefficiencies and their determinants. The second method, considered in this analysis, is the two-stage approach which consists on estimating the efficiency scores in the first stage and then regressing the estimated efficiency scores on external variables in the second stage of the analysis.
In the first stage, the literature adopts different methodologies usually divided into parametric and nonparametric approaches. Coelli, (1996) and Coelli and Perelman, (1999) explains the advantages and disadvantages of different methods such as Data Envelopment Analysis (DEA) and Stochastic Frontier Analysis (SFA). Nonparametric approaches are more appropriate for this study as they allow for the use of multiple outputs, which will provide us with the tools to measure impacts on multiple outcome variables - poverty, inequality, and vulnerability. They also do not require any assumptions on the functional form nor they require information on input and output prices.
IV.1 DEA methodology
Developed initially by Charnes et al., (1978) and inspired by the seminal work of Farrell, (1957), DEA assumes the existence of a convex production frontier. It imposes only limited restrictions on the representation of production technology and allows a comparison of the levels of efficiency between entities. The only hypothesis is that it is possible, with the same production technologies, to measure an increase in outputs while maintaining the level of inputs or to reduce inputs while maintaining outputs constant. This assumption ensures that there is a continuum of outputs across the production frontier. The advantage of this method is that it provides an intuitive tool for identifying best practices. The approach here is to empirically measure the efficiency of a Decision Making Unit (DMU) by calculating the distance separating the point representing the values of the factors and the level of services
observed with respect to a hypothetical point on the production frontier. In this way, it is possible to estimate the degree of efficiency of each entity offering the service in relation to that frontier which determines best practices. This allows the identification of the best performing DMUs, which can serve as references to those that are less efficient.
Suppose there are k inputs and m outputs for n regions (DMUs). Let us define xi as the column vector of the inputs and qi as the column vector of the outputs for the i-th region; X as the (k×n) input matrix and Q as the (m×n) output matrix. The DEA model is then specified as the solution to the mathematical programming problem below, for each of the n regions:
Min θ,λ θ
Subject to: -qi + Qλ ≥ 0
θxi – Xλ ≥ 0
I1'λ ≤ 1
θ is a scalar (that satisfies θ ≤ 1) and it is the score that assesses technical efficiency of unit (xi, qi). It measures the distance between a decision unit and the efficient frontier, defined as the linear combination of best-practice observations; when θ < 1, the region is inside the frontier (i.e., inefficient), while θ = 1 implies that the region is on the frontier (i.e., fully efficient). The vector λ is a (n×1) vector of constants, which measures the weights used to compute the location of an inefficient region if it were to become efficient; the peers are other regions that belongs to the best-practice frontier, and are therefore used as benchmarks. I1 is a n-dimensional vector of ones, the restriction I1'λ = 1 imposes convexity of the frontier, accounting for Variable Returns to Scale DEA-VRS (Banker et al., 1984). Dropping this restriction would amount to impose Constant Returns to Scale DEA-CRS (Charnes et al., 1978). Given that the assumption of CRS has often been considered over restrictive in the literature, this paper will compute the efficiency scores of Moroccan regions using an input-oriented DEA-VRS. A second stage Tobit regression is then used to analyze the determinants of these efficiency scores.
IV.2 Data
The analysis is based on a sample composed of 16 regions and 1503 municipalities, and covers the period 2005-2009 for which data are available. Disaggregated data on local revenues and expenditures were collected from the Trésorerie Générale du Royaume (TGR), a department of the Ministry of Finance. Socio-economic and demographic data come from “Le Maroc des regions” annual report published by the Haut Commissariat au Plan (HCP). Data on living standards, poverty, vulnerability, and inequality come from the HCP surveys. Data on human resources come from the “Collectivités locales en chiffres” a yearly report published by the Ministry of Interior.
Three indicators are used to measure pro-poor outcomes6:
The Gini index measures income inequality and varies between 0 (in the case of perfect equality) and 1 (in the case of absolute inequality). This indicator is computed by the TGR based on household consumption expenditures.
The Poverty rate represents the percentage of individuals whose standard of living is below the relative poverty line. In 2004 this threshold was 1687 MAD per month for households living in urban areas and of 1745 MAD per month for households living in rural areas.
The Vulnerability rate is the proportion of the population under the risk of falling into poverty; in 2004 this proportion included urban households with a monthly income between 1687 and 2531 MAD and rural households whose monthly income is between 1745 and 2618 MAD.
Our variables of interests are measured as follows:
The size of the local government budget is measured alternatively by subnational total revenues and subnational total expenditures in percentage of GDP.
The fiscal autonomy of the local government is measured by two proxies; first the share of subnational local own revenues over total subnational expenditures. Second, we use a broader definition of subnational local revenues that includes also subnational ceded revenues. Therefore, the second proxy of fiscal autonomy is computed as the sum of
6 Given that the higher the output measure the lower the performance, the output variables are transformed and constructed as follows: 𝑥𝑡= 100 − 𝑥 ; where x is alternatively one of the three output variables.
subnational local own revenues and subnational ceded revenues over subnational total expenditures.
The transfer dependency is measured as the share of intergovernmental transfers in subnational total expenditures. We also distinguish between formula-based transfers and ad-hoc transfers.
The degree of political decentralization is proxied by several indicators: the share of the municipal government expenditures in subnational total expenditures (total, current and capital expenditures), the share of the municipal government revenues in subnational total revenues, and the regional fragmentation proxied by the number of municipalities in each region.
As Morocco had local elections during the period covered in this study, we include a dummy variable equal to one the year of local elections and zero otherwise. Related to these elections, we also exploit the dataset and check whether the level of education of the elected officials in the regions, proxied by the share of elected officials that achieved at least a secondary level education, affect spending efficiency.
Finally, we follow the existing literature and include a number of variables in the model to control for exogenous factors that may affect spending efficiency: the logarithm of GDP per capita, the size of the population, and the degree of urbanization of the regions.
V. RESULTS AND ROBUSTNESS CHECKS V.1 Efficiency scores of Moroccan regions
Table 2 summarizes the DEA-VRS input-oriented efficiency scores for the 16 regions in Morocco. The average score of 0.76 between 2005 and 2009 and across regions suggests that Moroccan regions could have theoretically achieved the same level of output with about 24 percent fewer inputs. In other words, they could have significantly reduced poverty, vulnerability, and inequality without increasing their expenditures. Grand Casa and Oued Dahab Lagouira appear to be the most efficient regions while Ghelmim Essmara and Al Houceima Taza Taounate are the less efficient with the lowest average scores over the period
of 0.46 and 0.47 respectively. These results point to some positive correlations between regions' spending efficiency and their GDP and population sizes. On the other hand, there is a negative correlation between the number of municipalities in the region and their spending efficiency.
TABLE 2: Regional efficiency scores -- DEA
2005 2006 2007 2008 2009 Mean Rank
GRAND CASA 1 1 1 1 1 1 1
OUED DAHAB LAGOUIRA 1 1 1 1 1 1 1
GHARB CHRADA BENI HSSEIN 0,77 1 1 0,79 1 0,91 3
SOUSS MASSA DARAA 0,9 1 1 0,75 0,8 0,89 4
LAAYOUNE BOUJDOUR 1 1 0,78 1 0,64 0,88 5
TADLA AZILAL 1 0,83 0,96 0,9 0,65 0,87 6
DOUKALA ABDA 1 1 0,87 0,67 0,73 0,85 7
CHAOUIA OUARDIGHA 0,51 0,68 1 1 1 0,84 8
MARRAKECH TENSIF AL HAOUZ 0,67 0,7 0,76 1 0,7 0,76 9
ORIENTAL 0,72 0,78 0,81 0,71 0,79 0,76 10
RABAT SALE 0,62 0,77 1 0,64 0,73 0,75 11
FES BOULMANE 0,51 0,69 0,72 0,48 0,62 0,6 12
MEKNES TAFILALT 0,38 0,54 0,73 0,55 0,62 0,56 13
TANGER TETOUAN 0,42 0,62 0,65 0,48 0,6 0,55 14
AL HOUCEIMA TAZA TAOUNATE 0,24 0,57 0,53 0,42 0,58 0,47 15
GHELMIM ESSMARA 0,38 0,62 0,52 0,35 0,41 0,46 16
Mean 0,7 0,8 0,83 0,73 0,74 0,76 -
Source: Authors' calculations.
V.2 Size of local governments and spending efficiency
The first column of Table 3 presents the results of the baseline Tobit model with the control variables. They all appear to be significant determinants of spending efficiency: the coefficient for GDP per capita shows that richer regions have more efficient spending. Regarding the size of the population, spending efficiency is lower in more populous Moroccan regions, a finding which differs from some earlier research (Bahl and Nath, 1986; Oates, 1972). Finally, the coefficient for the urbanization variable displays a negative and significant sign, meaning that more urbanized regions are less efficient than regions with more rural areas. This can be counterintuitive as urbanization is usually expected to improve efficiency (Bahl and Nath,
1986). One reason could be that more urbanized regions have more financial resources, which can increase inefficient spending. Another explanation could be related to the fact that poverty being higher in rural areas compared to the national average, authorities have more room to reduce the gap compared to their counterparts in more urbanized areas.
The second and third columns show estimates from the different measures of the size of the regional budget. In both sets of estimates, aggregate revenue and expenditure measures appear to have significant and negative relationships with spending efficiency. In other words, regions with higher levels of revenues and expenditures compared to their GDP are less efficient in reducing inequality, poverty, and vulnerability. Besides, if we compare the effects of aggregate shares of expenditure and revenue, the negative impact of the share of expenditures on efficiency appears to be more pronounced. These results highlight the importance of calibrating redistributive policies by taking into account the economic activity in the regions. For instance, while intergovernmental transfers can help mitigate inter-regional disparities by increasing the revenues of regions with a relatively lower level of GDP, they can be at the cost of better spending efficiency. These transfers need to be accompanied with a broader regional development strategy.
TABLE 3: Subnational budgets and spending efficiency
Dependent variable: DEA efficiency
score (1) (2) (3) Subnational revenues -0.050** (0.025) Subnational expenditures -0.161*** (0.041) GDP per capita 0.480*** 0.339** 0.306* (0.138) (0.149) (0.140) Urban dummy -0.210** -0.194* -0.178 (0.087) (0.108) (0.125) Population -0.127** -0.066 -0.097 (0.043) (0.057) (0.065) Constant -3.775** -2.058 -0.501 (1.329) (1.509) (1.417) LR test 7.14 11.05 18.98 p-value 0.00 0.00 0.00 Log likelihood -13.19 -11.24 -6.62 N. Obs 80 80 80
Notes: Robust standard errors in brackets.
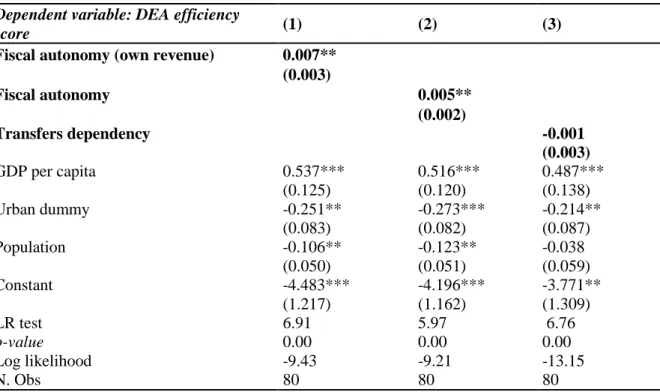
V.3 Fiscal autonomy, transfer dependency, and spending efficiency
In Table 4 we focus on how the different sources of regional revenues and the financing of public spending affect efficiency. The results in Column 1 and 2 suggest that fiscal autonomy of the regions, whether measured by own revenues only or by own and ceded revenues, positively affects spending efficiency; they are in line with earlier findings in Weingast, (2009) and Goerl and Seiferling, (2014). However these results differ from those of Balaguer-Coll et al., (2004, 2010) who find that a local government that is highly capable of generating own revenues would be less motivated to manage them efficiently.
If we turn to the results for transfer dependency (Table 4, column 3) measured by the share of regions' expenditures funded by transfers from the central government, it appears to have a negative but insignificant relationship with spending efficiency.
In sum, Moroccan regions need to rely more on their own-source revenues and less on intergovernmental transfers to cover their expenditure needs. In this context, while the central government transfers will continue to represent a significant share of local revenues to accompany the decentralization process, a greater attention should be paid to developing the capacity of local authorities in mobilizing local revenues.
TABLE 4: Fiscal autonomy, transfer dependency, and spending efficiency
Dependent variable: DEA efficiency
score (1) (2) (3)
Fiscal autonomy (own revenue) 0.007** (0.003) Fiscal autonomy 0.005** (0.002) Transfers dependency -0.001 (0.003) GDP per capita 0.537*** 0.516*** 0.487*** (0.125) (0.120) (0.138) Urban dummy -0.251** -0.273*** -0.214** (0.083) (0.082) (0.087) Population -0.106** -0.123** -0.038 (0.050) (0.051) (0.059) Constant -4.483*** -4.196*** -3.771** (1.217) (1.162) (1.309) LR test 6.91 5.97 6.76 p-value 0.00 0.00 0.00 Log likelihood -9.43 -9.21 -13.15 N. Obs 80 80 80
Notes: Robust standard errors in brackets.
*Statistical significance at 10%, **Statistical significance at 5%, ***Statistical significance at 1%.
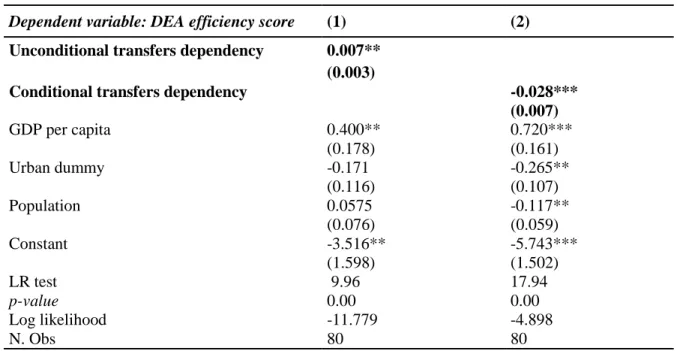
V.4 Transfer conditionality and spending efficiency
Columns 1 and 2 of table 5 present the results for the effects of formula-based (unconditional) and ad hoc (conditional) transfers respectively. It is worth noting that this is the first time such a distinction is made to measure the disaggregated effects of transfers on spending efficiency. The coefficient associated with formula-based transfers is significant and positive, meaning that the higher the share of revenues derived from formula-based transfers the more efficient is the region in spending. Conversely, ad hoc transfers seem to be negatively associated with spending efficiency.
There are two possible explanations for these results. On one hand, ad hoc transfers are more unpredictable than formula-based transfers, which can make it difficult for local authorities to effectively plan and use these resources efficiently. On the other hand, since ad hoc transfers are not, by definition, allocated to local authorities on a transparent and regular basis, the latter may exhibit less efficient spending behaviors due to the lack of accountability.
TABLE 5: Transfer conditionality and spending efficiency
Dependent variable: DEA efficiency score (1) (2)
Unconditional transfers dependency 0.007** (0.003)
Conditional transfers dependency -0.028***
(0.007) GDP per capita 0.400** 0.720*** (0.178) (0.161) Urban dummy -0.171 -0.265** (0.116) (0.107) Population 0.0575 -0.117** (0.076) (0.059) Constant -3.516** -5.743*** (1.598) (1.502) LR test 9.96 17.94 p-value 0.00 0.00 Log likelihood -11.779 -4.898 N. Obs 80 80
Notes: Robust standard errors in brackets.
*Statistical significance at 10%, **Statistical significance at 5%, ***Statistical significance at 1%.
V.5 Political decentralization and spending efficiency
The existing empirical research on the impacts of decentralization has mostly considered the government as being organized around two large entities: the central government on one hand and the subnational government on the other. We go further in this work by disaggregating the subnational government into two different sub-entities to see if a greater responsibility of the region compared to municipality or vice versa affects the efficiency of spending. We therefore use three indicators as proxies of the level of political decentralization: the share of expenditures and revenues managed by municipalities and the number of municipalities per region.
The results presented in columns 1-3 of Table 6 show that there is more spending inefficiency in regions where municipalities manage a larger share of the subnational expenditures. By breaking down these results further, we find that the higher the share of capital expenditures managed by municipalities the lower the efficiency of subnational spending; the coefficient associated with current expenditures appear to be insignificant. These results are also confirmed when we use the share of municipal revenues to subnational revenues (column 4).
In the last column of the table 6, we evaluate whether the number of municipalities per region, which is an indicator of the political and territorial fragmentation of the region, affects the spending efficiency. The results show that, in fact, the most fragmented regions are less efficient in reducing inequality, poverty, and vulnerability.
TABLE 6: Political decentralization and spending efficiency Dependent variable: DEA
efficiency score (1) (2) (3) (4) (5)
Municipal government total
expenditures -0.013** (0.006) Municipal government current expenditures -0.028 (0.023) Municipal government capital expenditures -0.008** (0.003) Municipal government total
revenues -0.023*** (0.005) Regional fragmentation -0.002* (0.001) GDP per capita 0.424** 0.411** 0.438*** 0.366** 0.436*** (0.135) (0.149) (0.127) (0.112) (0.129) Urban dummy -0.165** -0.178* -0.208** -0.172** -0.280*** (0.081) (0.092) (0.074) (0.067) (0.083) Population 0.037 0.013 0.0435 0.102** 0.040 (0.048) (0.054) (0.042) (0.044) (0.050) Constant -2.169 -0.489 -2.821** -0.946 -3.254** (1.493) (3.007) (1.258) (1.279) (1.258) LR test 4.40 7.75 3.63 2.85 5.27 p-value 0.01 0.00 0.02 0.04 0.01 Log likelihood -10.82 -12.38 -8.06 -3.35 -10.63 N. Obs 80 80 80 80 80
Notes: Robust standard errors in brackets.
*Statistical significance at 10%, **Statistical significance at 5%, ***Statistical significance at 1%.
The above results show that while moving toward more decentralized systems, the central government may need to consider giving the regional entities a more prominent role in managing decentralized spending and ensuring territorial coherence.
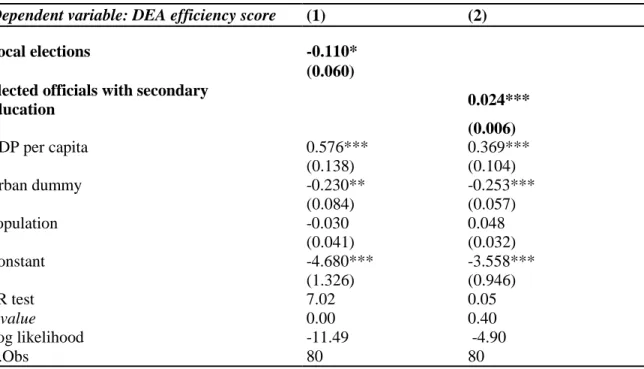
V.6 Spending efficiency in the context of local elections
In Table 7 we test whether the behavior of incumbent politicians closer to new elections has a significant impact on spending efficiency. However, the results need to be interpreted with caution as only one round of local elections occurred during the period of study.
The findings point to a negative and significant impact of local elections on spending efficiency (column 1); in other words, the local authorities manage public resources less efficiently the year of elections. Our results are in line with the literature on electoral budget cycle which states that incumbent politicians tend to increase inefficient public spending in proximity of the election year in order to get re-elected (Veiga and Veiga 2007).
We also assess whether the skills of elected officials (column 2), proxied by their level of superior education, play a determining role in explaining expenditure efficiency. The results confirm the intuition that when elected officials have at least completed a secondary education level the efficiency of spending in the region is improved. One explanation could be that the increased ability of the local authorities to formulate and monitor local budgets make public spending more efficient.
TABLE 7: Spending efficiency in the context of local elections
Dependent variable: DEA efficiency score (1) (2)
Local elections -0.110*
(0.060) Elected officials with secondary
education 0.024*** (0.006) GDP per capita 0.576*** 0.369*** (0.138) (0.104) Urban dummy -0.230** -0.253*** (0.084) (0.057) Population -0.030 0.048 (0.041) (0.032) Constant -4.680*** -3.558*** (1.326) (0.946) LR test 7.02 0.05 p-value 0.00 0.40 Log likelihood -11.49 -4.90 N.Obs 80 80
Notes: Robust standard errors in brackets.
V.7 Robustness checks
In this section, we consider various alternative approaches both to the first stage and second stage regressions in order to ascertain the robustness of the above findings. As for the first stage regressions, we use a Partial Frontier Analysis Order-m (PFA) to compute the efficiency scores. In the second stage, we test the validity of the relationships by relying on a Fractional Regression Model (FRM). Finally, we also check the consistency of our findings by running a pooling regression and by adding additional control variables to the baseline model.
V.7.1 Partial Frontier Analysis and Fractional Regression Model7
The use of the nonparametric approach to measure local government efficiency has the advantage of imposing less structure on the functional form and the ability to accommodate multiple inputs and outputs when the sample size is allowing it. However, Full-frontier nonparametric estimators such as DEA method envelop all data points and are therefore, highly sensitive to outliers, extreme values, and random shocks which can have an effect on the efficient frontier. Cazals et al., (2002); Daraio and Simar, (2007) and Tauchmann, (2012) suggest estimating partial frontier nonparametric approaches to obtain efficiency scores that are less sensitive to outliers. These nonparametric methods, which include the order-α and order-m methods, use only part of the observations in the sample to determine efficiency scores. In the second stage, the determinants of the PFA Order-m scores are estimated using the FRM approach to deal with the limitations associated with Tobit models (Simar and Wilson, 2007).
The Order-m-FRM regression results8 presented in Appendix E are broadly consistent with our previous findings. In particular, the size of subnational budgets continues to be negatively associated with spending efficiency although the coefficient for regional revenues becomes insignificant. The fiscal autonomy of local governments also remains associated with higher spending efficiency. The coefficient for transfer dependency, which was insignificant in the baseline model, becomes higher, significant, and negatively associated with spending efficiency; the impact of both transfers is confirmed and with a higher magnitude. Regarding the measures of regional fragmentation, two of the three indicators confirm that spending
7 These models are detailed in Appendix A.
efficiency is hampered by regional fragmentation; only the coefficient associated with municipal government expenditures becomes insignificant. Finally, there is a robust evidence of a relatively low efficiency of spending in elections' year as the Order-m-FRM results show an even higher coefficient compared to the baseline model.
We further tested the robustness of these findings by relaxing the panel structure of our data and running a pooled regression. This allows us to generate the efficiency score of each region not only compared to the 15 other regions, but to the 79 other observations (16 regions over 5 years) in the sample. The results presented in Appendix F are consistent with those of the panel data regressions.
V.7.2 Additional control variables
We estimate the impact of the decentralization variables by expanding the number of additional control variables. We added the squared population variable to account for the economies of scale and for the hypothesis that there appears to be a critical mass of population and activities before the benefits of decentralization can materialize (Prud’homme, 1995). The regional density of population is also included as a proxy of the geographical size of regions, as the quantity and quality of service delivery may vary in function of the geographical concentration or dispersion of individuals.
Two things are worth noticing in Appendix G. First, adding more independent variables increases the goodness of fit of the model in most cases. Second, the results confirm the previous findings, although the coefficients measured are larger compared to the baseline model.
VI. CONCLUSION
The purpose of this paper was to assess the efficiency of Moroccan local government spending in reducing poverty, inequality, and vulnerability. It investigated the role played by a set of variables reflecting the degree of decentralization. The analysis relied on a sample of 16 regions and 1503 municipalities, and employed a set of nonparametric approaches to study efficiency performances and their main determinants.
Over the last two decades, the Moroccan government has gradually granted the regions with increased political, administrative, and fiscal powers in the context of Morocco's advanced
regionalization. This paper has shown that regions with high expenditure and revenue to GDP ratios display less efficient spending patterns in reducing poverty, inequality and vulnerability. As highlighted in the existing literature, the sources of revenues play a crucial role in the efficiency of spending and in Morocco, regions that are able to finance a larger part of their spending by raising their own revenues are more efficient. Besides, our results do not support the hypothesis that overall transfer dependency motivates regions to spend inefficiently. However, when transfers are disaggregated, we show that transfers based on a transparent allocation formula improve the efficiency of spending, whereas the opposite is true when transfers are made in a discretionary way.
Another important contribution of this paper has been to see whether political decentralization and the fragmentation of local governments affect the efficiency of spending. In regions where municipalities have a greater responsibility for spending, those spending are made in a less efficient fashion. Moreover, regions that are more fragmented also have weaker performance in terms of spending efficiency. These results suggest that the regions must be given a more prominent role in managing public spending as they can help to maintain territorial coherence and serve as intermediate entities between the central government and the municipalities. Finally, we tested the existence of the electoral budget cycle in Morocco and political accountability. We show that in Morocco, spending efficiency tends to decrease the year of local elections. Moreover, when we look more closely at the characteristics of elected officials, our results show that the higher their level of education the more efficient is the region in the use of public resources.
In sum, greater decentralization in Morocco should be undertaken in a balanced fashion where the region, besides being a stronger political entity, is given a more prominent role in the economy compared to municipalities in order to coordinate local policy decisions and their externalities. While local authorities are called upon to increase their fiscal autonomy, it remains critical for the central government to ensure that transfers are allocated in a transparent and efficient way. This will help to achieve a more equal distribution of income and to alleviate economic poverty and vulnerability.
VII. REFERENCES
Akai, N., Sakata, M., 2002. Fiscal decentralization contributes to economic growth: Evidence from state-level cross-section data for the United States. J. Urban Econ. 52, 93–108. doi:10.1016/S0094-1190(02)00018-9
Bahl, R., Nath, S., 1986. Public Expenditure Decentralizatlon In Developing Countries. Gov. Policy 4.
Balaguer-Coll, M.T., Prior, D., Tortosa-ausina, E., 2010. Decentralization and efficiency of local government. Ann. Reg. Sci. 45, 571–601. doi:10.1007/s00168-009-0286-7 Balaguer-Coll, M.T., Prior, D., Tortosa-Ausina, E., 2004. On the determinants of local
government performance: A two-stage nonparametric approach.
Banker, A.R.D., Charnes, A., Cooper, W.W., 1984. Some Models for Estimating Technical and Scale Inefficiencies in Data Envelopment Analysis. Manage. Sci. 30, 1078–1092. doi:10.1287/mnsc.30.9.1078
Bardhan, P., Mookherjee, D., 2005. Decentralizing antipoverty program delivery in
developing countries. J. Public Econ. 89, 675–704. doi:10.1016/j.jpubeco.2003.01.001 Bardhan, P., Mookherjee, D., 1998. Expenditure Decentralization and the Delivery ofPublic
Services in Developing Countries. CIDER Work. Pap.
Blanchard, O., Shleifer, A., 2000. Federalism with and without political centralization: China versus Russia. NBER Work. Pap. Ser. Fed.
Borger, B. De, Kerstens, K., 2000. Cost efficiency of Belgian local governments : A comparative analysis of FDH , DEA , and econometric approaches. Reg. Sci. Urban Econ. 26 26, 145–170.
Cazals, C., Florens, J.P., Simar, L., 2002. Nonparametric frontier estimation: A robust approach. J. Econom. 106, 1–25. doi:10.1016/S0304-4076(01)00080-X
Charnes, A., Cooper, W.W., Rhodes, E., 1978. Measuring the efficiency of decision making units. Eur. J. Oper. Res. 2, 429–444. doi:10.1016/0377-2217(78)90138-8
Chu, K., Davoodi, H., Gupta, S., 2000. Income Distribution and Tax, and Government Social Spending Policies in Developing Countries. IMF Work. Pap. WP/00/62.
Coelli, T., 1996. A Guide to DEAP Version 2.1: A Data Envelopment Analysis (Computer) Program. CEPA Work. Pap. 96/08 1–49.
Coelli, T., Perelman, S., 1999. A comparison of parametric and non-parametric distance functions: With application to European railways. Eur. J. Oper. Res. 117, 326–339. doi:10.1016/S0377-2217(98)00271-9
Daraio, C., Simar, L., 2007. Conditional nonparametric frontier models for convex and nonconvex technologies: A unifying approach. J. Product. Anal. 28, 13–32. doi:10.1007/s11123-007-0049-3
De Mello, L., Barenstein, M., 2001. Fiscal Decentralization and Governance: A Cross-Country Analysis. IMF Work. Pap. WP/01/71.
Dethier, Jean-Jacques., 2000. Governance, Decentralization and Reform in China, India and Russia. Kluwer Academic Publishers and ZEF.
Dollar, D., Kraay, A., 2002. Growth still is good for the poor. J. Econ. Growth 7, 195–225. doi:10.1016/j.euroecorev.2015.05.008
Farrell, M.J., 1957. The Measurement of Productive Efficiency. J. R. Stat. Soc. Ser. A. doi:10.1016/S0377-2217(01)00022-4
Galli, R., Hoeven, R. van der, 2001. Is inflation bad for income inequality: The importance of the initial rate of inflation. ILO Work. Pap. 29.
Goerl, C.-A., Seiferling, M., 2014. Income Inequality, Fiscal Decentralization and Transfer Dependency. IMF Work. Pap. 14, 1. doi:10.5089/9781484354711.001
Grassmueck, G., Shields, M., 2010. Does government fragmentation enhance or hinder metropolitan economic growth? Pap. Reg. Sci. 89, 641–657. doi:10.1111/j.1435-5957.2010.00278.x
Lundberg, M., Squire, L., 2003. The Simultaneous Evolution of Growth and Inequality. Econ. J. 113, 326–344.
McDonald, J., 2009. Using least squares and tobit in second stage DEA efficiency analyses. Eur. J. Oper. Res. 197, 792–798. doi:10.1016/j.ejor.2008.07.039
Nativel, C., Sunley, P., 2002. Localising welfare-to-work ? Territorial flexibility and the New Deal for Young People. Environ. Plan. C Gov. Policy 20, 911–932. doi:10.1068/c0125 Oates, W.E., 1972. Fiscal Federalism. New York Harcourt Brace Jovanovich 6, 55–56.
doi:10.2307/2978885
OECD, 2003. Managing Decentralisation: A New Role for Labour Market Policy. Econ. Dep. Work. Pap.
Otsuka, A., Goto, M., Sueyoshi, T., 2010. Industrial agglomeration effects in Japan : Productive efficiency, market access, and public fiscal transfer 89. doi:10.1111/j.1435-5957.2010.00286.x
Prud’homme, R., 1995. The dangers of decentralization. World Bank Res. Obs. 10, 201–220. doi:10.1093/wbro/10.2.201
Ramalho, E.A., Ramalho, J.J.S., Henriques, P.D., 2010. Fractional regression models for second stage DEA efficiency analyses. J. Product. Anal. 34, 239–255.
doi:10.1007/s11123-010-0184-0
Rodríguez-Pose, A., Bwire, A., 2003. The economic ( in ) efficiency of devolution. Environ. Plan. 39. doi:10.1068/a36228
Seabright, P., 1995. Accountability and Decentralization in Government: An Incomplete Contracts Model. Eur. Econ. Rev. 40, 61–89. doi:10.1016/0014-2921(95)00055-0 Sepulveda, C.F., Martinez-vazquez, J., 2011. The Consequences of Fiscal Decentralization
on Poverty and Income Inequality. Environ. Plan. C Gov. Policy 29, 321–343.
Shleifer, A., Vishny, R.W., Quarterly, T., Aug, N., 1993. Corruption. Q. J. Econ. 108, 599– 617.
Simar, L., Wilson, P.W., 2007. Estimation and inference in two-stage, semi-parametric models of production processes. J. Econom. 136, 31–64.
doi:10.1016/j.jeconom.2005.07.009
Tanzi, V., 1996. Fiscal Federalism and Decentralization: A Review of Some Efficiency and Macroeconomic Aspects, in: Annual World Bank Conference on Development
Economics 1995. pp. 295–316.
Tauchmann, H., 2012. Partial frontier efficiency analysis. Stata J. 12, 461–478.
Thiessen, U., 2003. Fiscal Decentralisation and Economic Growth in High-Income OECD Countries. Fisc. Stud. 24, 237–274. doi:10.1111/j.1475-5890.2003.tb00084.x
Tiebout, C.M., 1956. A Pure Theory of Local Expenditures. J. Polit. Econ. 64, 416–424. doi:10.1086/257839
Treisman, D., 2002. Decentralization and the Quality of Government. Polit. Sci. 1–48. Tselios, V., Rodríguez-Pose, A., Pike, A., Tomaney, J., Torrisi, G., 2011. Income inequality,
decentralisation and regional development in Western Europe. Econ. Soc. Sci. Work. Pap. 16.
Veiga, L.G., Veiga, F.J., 2007. Political business cycles at the municipal level. Public Choice 131, 45–64. doi:10.1007/s11127-006-9104-2
Weingast, B.R., 2009. Second generation fiscal federalism: The implications of fiscal incentives. J. Urban Econ. 65, 279–293. doi:10.1016/j.jue.2008.12.005
Wooldridge, J., 2002. Econometric Analysis of Cross Section and Panel Data 735. doi:10.1515/humr.2003.021
World Bank, 2009a. Decentralization and Deconcentration in Morocco: Cross-Sectoral Status Review.
World Bank, 2009b. Public Financial Management Performance Report, World Bank, European Union.
Zhang, T., Zou, H.F., 2001. The growth impact of intersectoral and intergovernmental allocation of public expenditure: With applications to China and India. China Econ. Rev. 12, 58–81. doi:10.1016/S1043-951X(01)00043-8
VIII. APPENDICES
APPENDIX A: Partial Frontier Analysis, Fractional Regression Model
Nonparametric full frontier methods, such as Data Envelopment Analysis (DEA) and Free Disposal Hull (FDH) estimators are sensitive to outliers and measurement errors, and require using a large sample of observations and a limited number of inputs/outputs to get accurate results (Daraio and Simar, 2007).
Cazals et al., (2002); Daraio and Simar, (2007) and Tauchmann, (2012) suggest estimating a partial frontier nonparametric approach to obtain efficiency scores that are less sensitive to outliers. These nonparametric methods, which include the order α and order-m methods, use only part of the observations in the sample to determine efficiency scores.
The full nonparametric approaches define the best performers in the sample as the efficient units, and compares the other DMUs to this benchmark. Instead of benchmarking a decision-making unit relative to the best-performing peer in the sample, the PFA compares each decision-making unit against the best performers in an artificial subsample of m peers
randomly selected from the sample with replacement. This procedure is repeated n times resulting in n pseudo efficiency measures from which the final order-m efficiency measure is computed as the average. The parameter m represents the number of units used to benchmark performance and determines the degree of robustness of the obtained estimate. A large value of m is required to obtain a robust estimator. With order-m, DMUs can be above the production frontier, and the scores to be above 1. At small values of m, there will be many observations beyond the efficient frontier; however, as the value of m increases, fewer observations will be left beyond the frontier. For m approaching infinity, the order-m efficiency estimator converges to the full frontier FDH measure.
As for the choice of the appropriate model for the first stage above, the identification of the appropriate model to assess the determining factors of efficiency is crucial to avoid misleading results (Simar and Wilson, 2007; Ramalho et al., 2010). Ramalho et al., (2010) argue that the linear specification of the second-stage regression may not be appropriate as it violates the requirement that the predicted values of efficiency scores lie within a range of 0-1. Furthermore, Simar and Wilson, (2007) indicate that the standard approach of using a
two-limit Tobit model, with two-limits at zero and unity, is not the best specification to model the second-stage regression since few values, if any, are close to 0 but some values of unity. To cope with the problems associated with linear and Tobit models, Ramalho et al., (2010) suggest to use the FRM developed by Wooldridge, (2002). We follow the instrumentalist approach adopted by McDonald, (2009) and Ramalho et al., (2010), which has been also implicitly adopted for most two-stage DEA empirical studies. This approach considers the scores as observed measures of the relative technical efficiency of the sampled DMUs. Therefore, in the second stage, the scores can be treated like any other dependent variable in a regression analysis.
(Ramalho et al., 2010) suggest two frameworks for the second stage FRM9: a single-equation
model to explain the efficiency scores of all DMUs, including those of the efficient ones; or a two-equation model that explains separately, first, why some DMUs are efficient while others are not and, second, the relative efficiency of inefficient DMUs. We adopt a single-equation model in this work that we will compare to the second-stage Tobit model used in the baseline model. The FRM provides several alternative functional forms for dealing with the typical asymmetric nature of efficiency scores. We test for the appropriate functional form using alternative models including FRM Logit, Probit, log-logistic (Loglog) and Complementary log-logistic (cloglog). The P-test is used to select between these different specifications. In no case the test reject any of the tested specification; therefore, we present the most commonly used FRM Logit model10.
9 The order-m scores are normalized to range between 0 and 1. 10 The results using different specifications are available upon request.